All published articles of this journal are available on ScienceDirect.

A Preliminary Assessment of Cerebral Surface Strain
Abstract
Background:
Craniotomies are commonly performed neurosurgical procedures. Quantitating cerebral surface strain may facilitate the identification of intracerebral pathology and improve intraoperative management of underperfused brain tissue.
Objective:
The aim of this study was to test the use of digital image correlation software to quantify cerebral surface strain of intraoperative cerebral tissue during craniotomies.
Methods:
Ncorr, an open-source software program, was used to perform digital image correlation analysis from publicly available craniotomy videos. Mann-Whitney U tests were then utilized to assess statistical differences between craniotomy datasets.
Results:
Four different craniotomies were retrospectively examined, and the acquired cerebral surface strain data were subsequently extracted and analyzed. Statistically significant cerebral surface strain values were identified when comparing the four craniotomies. Additional prospective research is needed to establish baseline ranges of cerebral surface strain and to further understand the potential utility and limitations of this non-invasive intraoperative monitoring technique.
Conclusion:
This preliminary study successfully demonstrated the use of computer-based image analysis for the non-invasive quantification of cerebral surface strain during neurosurgery.
1. INTRODUCTION
Craniotomies are performed by neurosurgeons to establish surgical access for the treatment of intercranial pathologies. These include the excision of brain tumors, removal of extravasated blood after a hemorrhagic stroke or severe head trauma, or to surgically ligate an intracranial aneurysm. A less invasive type of craniotomy may be performed for minimally invasive procedures, such as the implantation of deep brain stimulators, drainage of small blood clots, shunting of excessive cerebral spinal fluid, or for brain biopsies.
During a craniotomy, the surgical team will include an anesthesiologist. The appropriate administration of anesthetic and related agents can cause permanent and/or major changes to important brain functions and cerebral blood flow [1]. Thus, the anesthesiologist controls the physiologic homeostasis of the patient [2]. Accordingly, it is critical that the neurosurgeon clearly communicates with the anesthesiologist information regarding the physical status of the brain.
In addition to vital signs, the anesthesiologist uses the necessary information gathered from the neurosurgeon’s evaluation to determine whether to increase or decrease the amount of anesthesia. Moreover, the administration of adjunct medications, such as diuretics, hypertonic saline, and steroids may be necessary to reduce brain edema. The use of hyperventilation may also reduce brain edema.
Additionally, drainage of cerebral spinal fluid or increasing the size of the craniectomy may further allow for improved cerebral perfusion caused by cancer, trauma, or intracranial bleeding. In certain situations, surgical removal of brain parenchyma may be necessary for adequate cerebral perfusion.
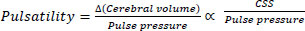
Pulsatility, which is physically similar and has the same dimensions as compliance, is used to assess the flow of blood through the brain’s tissues and could potentially be utilized as a marker for cerebral tissue perfusion [3]. This “brain pulse” occurs from the inflow of intracranial arterial blood. The resulting pressure wave is subsequently transmitted through the brain. Thus, pulsatility may help identify adequately perfused vs. underperfused areas of the brain.
Note that cerebral surface strain (CSS) offers a non-invasive quantitative assessment of the relative changes of the brain’s surface anatomy. These changes occur due to the increase of arterial blood pressure from diastole to systole.
Thus, when combined with pulse pressure, CSS may function as a plausible “surrogate” for assessing regional changes in cerebral volume:
 |
(1) |
It should be noted that blood pressure measurements were not available for this preliminary retrospective assessment. Nonetheless, statistically significant differences in CSS were observed for four different intracranial pathologies.
Consequently, CSS may potentially offer prognostic value as well. Thus, areas of lower CSS, which may have less pulsatility, may be relatively under-perfused compared with areas with higher CSS values.
This pilot study was conducted to determine the feasibility of image analysis of CSS during neurosurgery. Therefore, appropriate computer-based image analysis software was necessary to perform this assessment.
It should be noted that digital image correlation (DIC) optically tracks and measures changes in images. This technique is often used to measure displacement and strain in both two (2D) and three (3D) dimensions.
Specifically, 2D analysis is less technically challenging to implement in high-stress clinical or experimental environments [4]. In this retrospective analysis of preexisting craniotomy videos [6-9], 2D-DIC was used to measure surface displacement and CSS of brain tissue.
This extracted data could be utilized to ultimately develop an understanding of CSS and its potential applications during craniotomies.
Furthermore, Ncorr [5] is an open-source 2D-DIC software program that is wholly contained within the MATLAB environment.
In this paper, Ncorr was used to compute cerebral surface tissue displacement from four publicly available YouTube craniotomy videos. CSS was then calculated using these displacement values.
2. METHODS
Ncorr functions by comparing a series of images to a reference image. It then generates displacement and strain maps for a selected region of interest (ROI) based on the reference image. This subsequently allows for the analysis of different regions of the surgically exposed brain tissue and their respective surface strain values. Median and mean strain values were also determined.
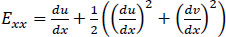
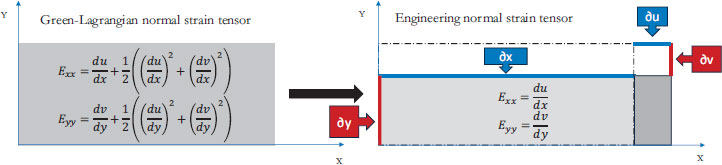
The methodology used to derive these displacement values is described by Blaber et al. [5]. Specifically, CSS is computed utilizing Green-Lagrangian strain [10] which is calculated via the displacement gradients obtained using Ncorr.
Moreover, the equations used to calculate Green-Lagrangian strain are:
 |
(2) |
 |
(3) |
 |
(4) |
Note that Exx and Eyy represent normal strain in the x and y directions respectively, whereas Exy represents shear strain. Furthermore, the x and y axes are associated with the horizontal and vertical directions, respectively.
Eqs. (2-4) calculate strain as a sum of specific displacement gradients. As these derivatives are small, when multiplied against one another or squared, their terms subsequently become effectively negligible. Thus, (2-3), and (4) can be simplified. These equations are subsequently referred to as engineering strain tensors (See: Appendix A).
 |
(5) |
 |
(6) |
 |
(7) |
For the determination of displacement, Ncorr requires one reference image against which every subsequent or “current” image is compared to.
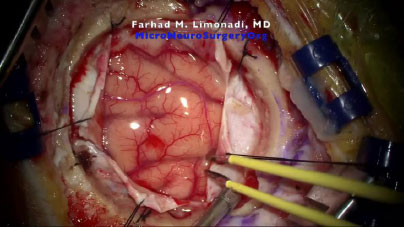
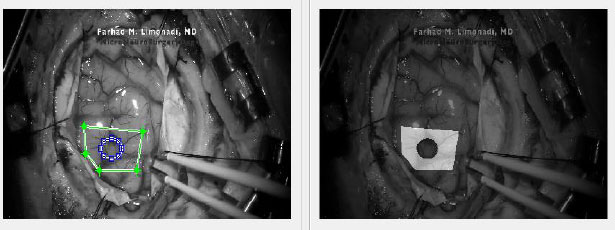
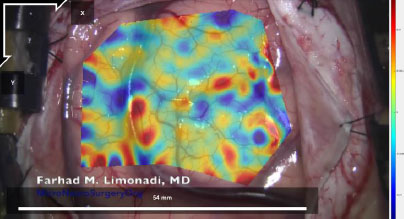
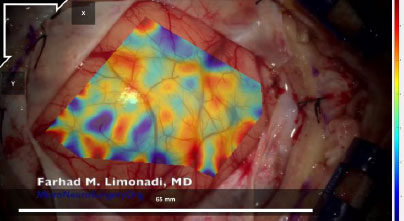
In addition, the reference image for the Metastatic Tumor [8] dataset is shown in Fig. (1). However, reflected glare from the surface of the brain presented a problem regarding the accuracy of the DIC calculations. This was alleviated by carefully placing “seeds” which are selected points that create checks for accuracy.
Additionally, the blue surgical clamps, seen on the right side of the image, also provided a reference that was used to translate the surface displacement unit from pixels to millimeters for each video. It should be noted that the resolution of YouTube JPEG videos is 1920 x 1080 pixels.
After the remainder of the frames were uploaded into Ncorr, a ROI had to be selected for analysis.
Selecting a single and relatively small ROI reduces the computation load by restricting the area of analysis. Furthermore, a smaller ROI increases specificity and can allow for comparisons between different regions. As demonstrated in Fig. (2), Ncorr also allows for the creation of polygonal or elliptical ROIs. Moreover, ROIs can also be “subtracted” to allow for greater precision or to eliminate regions that Ncorr is unable to process.
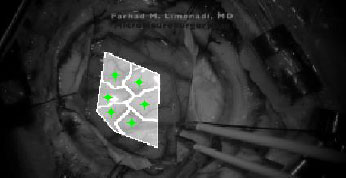
After the ROI is chosen, subset options must be selected. The two most important options are subset spacing and subset radius. These determine the “accuracy” of the DIC analysis as well as the computational load. Specifically, an increase in the subset spacing decreases the computation load but creates larger segments. This can negatively impact spatial resolution of the DIC analysis [5, 11]. Additionally, increasing subset radius improves pattern recognition and decreases the risk of generating artefactual data or noise. This occurs at the “cost” of spatial resolution [12]. A visualization of a subset can be seen in Fig. (3).
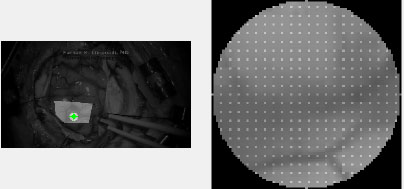
Lastly, Ncorr requires the user to place “seeds.” These are selected points within the ROI which provide initial guesses for the DIC algorithms. Seeds also partition the ROIs for multithreaded processing. In effect, seed placement allows the user to create subsections for analysis.
An example of seed placement is shown in Fig. (4). These initial guesses allow users to identify suboptimal seed placement, which may lead to inaccurate DIC analysis. For example, suboptimal placement may lead to the seed leaving the ROI entirely. This would potentially generate inaccurate displacement analysis.
Furthermore, the number of seeds is determined by the number of available CPU cores. Thus, more CPU cores will allow for greater computational speed. Additionally, excessive discontinuity between frames may result in a loss of pixels. This often happens near regions of heavy movement or reflective glare.
Moreover, DIC software usually requires randomly placed and positioned “artifacts” through which it can detect movement. Displacement data is then calculated using pattern precognition. Typically, artificial speckle patterns are painted or sprayed onto a test surface for this purpose. This was impossible in this application, as the source footage was based upon previously recorded YouTube craniotomy videos.
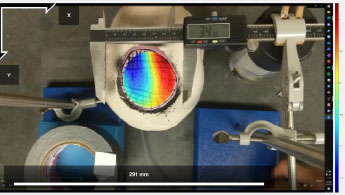
However, samples with sufficient “natural” textures may not require artificial patterning [13]. The network of blood vessels, sulci, and gyri which are visible on the brain’s surface, proved sufficient for Ncorr’s processing. This was verified by utilizing a mock craniotomy model which is illustrated in Fig. (5).
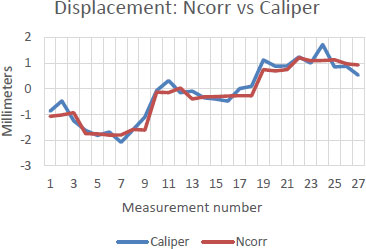
Note that a hole was cut into a plastic skull, and a water-filled balloon was then used to model the surface of the brain. Artifacts, in the form of geometric or random lines, were then drawn onto the balloon’s surface. The balloon was subsequently filled with increasing amounts of water (e.g., 30, 40, 50 mL). Ncorr then determined surface displacement. Manual measurements were also simultaneously obtained by means of a digital calliper. Microsoft Excel was then utilized to perform Spearman’s correlation tests to verify the accuracy of Ncorr.
The results from the mock craniotomies, which will be further discussed in the results section, indicated that the accuracy of Ncorr was sufficient for this preliminary analysis of CSS.
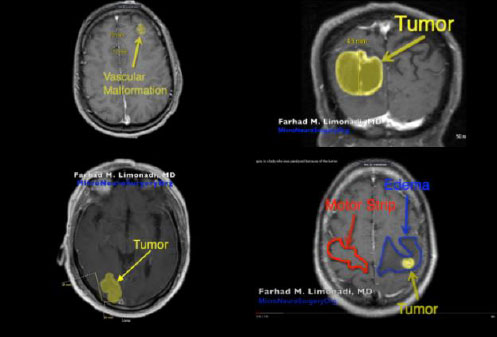
Subsequently, four YouTube craniotomy videos, Cavernoma [6], GBM [7], Metastatic Tumor [8], and Unknown Tumor [9] were extracted into MP4 files. Furthermore, the specific age and associated medical conditions for each patient’s video are displayed in Table 1. In addition, Fig. (6) illustrates the pre-operative MRI for each patient.
| Pathology | Age and Sex | Clinical Conditions |
|---|---|---|
| Cavernoma | ~40 year-old male | Three seizure episodes. Although these seizures were medically controlled, the patient requested surgical resection. |
| Glioblastoma Multiforme (GBM) | ~70 year-old male | Left homonymous hemianopsia and progressive confusion. This tumor was approximately 30 cubic centimeters in volume. |
| Metastatic Tumor | ~70 year-old female | Progressively growing mass in the right occipital lobe. The patient suffered from mild left homonymous hemianopsia. |
| Unknown Tumor | ~50 year-old female | Complete right-sided paralysis with a right-sided facial droop. |
It should be noted that each Institutional Review Board (IRB) deemed this study exempt, owing to its retrospective analysis of anonymous YouTube videos. Furthermore, the authors have received permission to use these copyrighted videos.
The sections of each video with stable (i.e., no movement of the camera) and uninterrupted frames of the pulsating surface tissue were identified and isolated. Each video section was then divided into a series of JPG images at a rate of twenty frames per second. These image files were then renamed according to Ncorr’s formatting requirements and analyzed. The resulting displacement and strain datasets were saved using MATLAB-compatible file formats. An example of the computed displacement plots can be seen in Fig. (7).
Afterwards, the strain data for each file was extracted and analyzed for maximum, minimum, median, and mean strain in the X and Y directions as well as shear strain. Following this analysis, the mean absolute strain values were compiled for each type of strain.
XLSTAT (Addinsoft) was used to perform non-parametric Mann-Whitney U-tests to assess statistical differences between the different craniotomy datasets. Microsoft Excel was also utilized for the preparation of box and whisker plots.
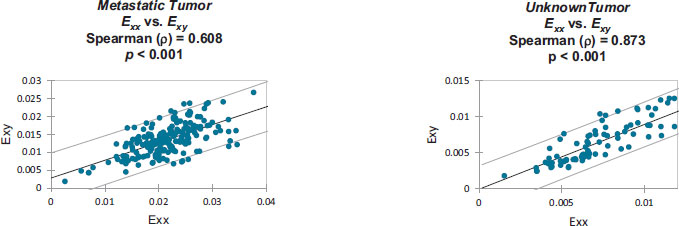
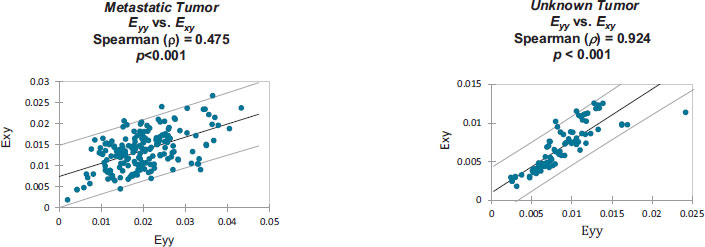
Furthermore, the correlation was also calculated within each patient’s individual strain dataset. (See: Appendix B).
3. RESULTS
Before discussing the CSS analysis of the craniotomies, it is necessary to first describe the results of the mock craniotomy tests. Fig. (8) compares Ncorr displacement results against hand-measured displacement measurements of the mock craniotomies. As the balloon representing the brain expands, as shown in Fig. (5), the right-side experiences positive (red) movement towards the right of the frame, while the left-side experiences negative (blue) movement towards the left of the frame.
A high degree of correlation was found between Ncorr and direct calliper-based measurements of displacement. Specifically, Spearman’s correlations ranged from 92% to 98%. As an example, the results, which are depicted in Fig. (8), correlated with 96.4% accuracy. Therefore, Ncorr was found to be sufficiently accurate to be used to track CSS using craniotomy videos.
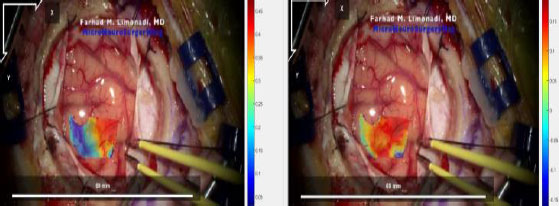
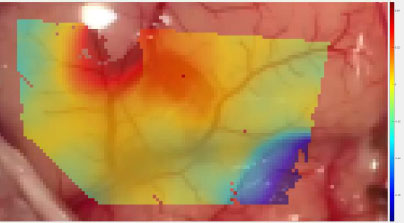
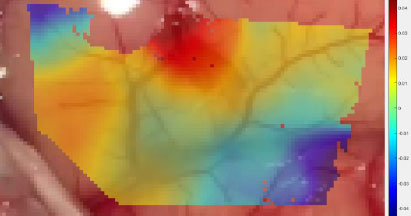
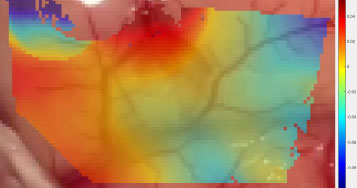
Analysis of the craniotomy videos revealed that strain maps throughout all four datasets were consistently aligned with surface topography and blood vessels. Fig. (9) demonstrates the shear strain from frame 139 of the Metastatic Tumor dataset [8]. Note that the transparency in this data plot was increased to emphasize those regions of strain which had a magnitude greater than 2%. The legend on the right notes that the darker red and darker blue sections of Fig. (9) had magnitudes between 0.04 (4%) and 0.06 (6%).
The bottom left to the top right of Fig. (9) displayed very low shear strain. This region had a mean shear strain magnitude of approximately 0.006 (0.6%).
However, the bottom right corner and the top right section of Fig. (9) displayed higher magnitudes of shear strain with absolute values between 0.04 (4%) and 0.06 (6%). Furthermore, these areas are separated from the middle region by blood vessels. Note that the relevant blood vessels are highlighted in pink for clarity. This trend is seen throughout the strain data, as seen in Figs. (10 and 11), and across the different datasets, as demonstrated in Figs. (12 and 13).
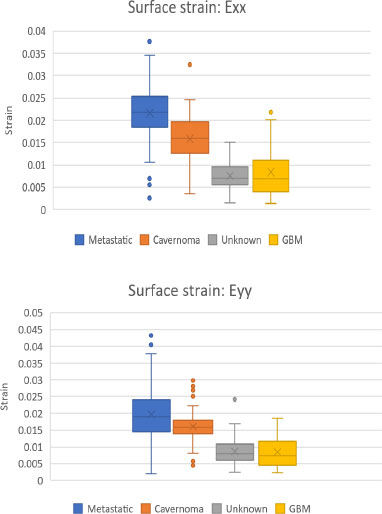
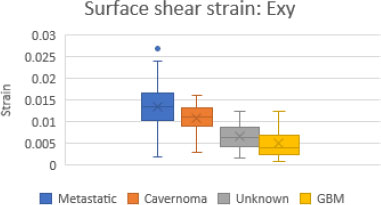
Figs. (14 and 15) are box and whisker plots of the mean normal strain values in the x and y directions and mean shear strain values for all four craniotomy datasets.
The Metastatic Tumor [8] craniotomy had the largest strain values in all directions. Moreover, Unknown Tumor [9] and GBM [7] had the smallest strain values in all directions.
As displayed in Table 2, two-tailed Mann-Whitney U tests, performed on the mean absolute values of the four datasets, revealed statistically significant differences (p < 0.0001) between all but two comparisons.
Specifically, the GBM [7] and Unknown Tumor [9] datasets produced statistically similar data for normal strain in both the X and Y directions.
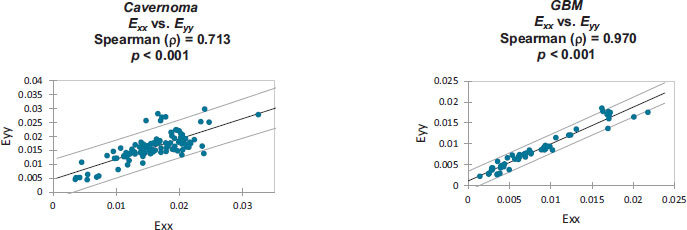
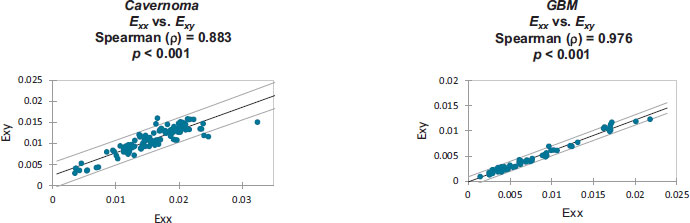
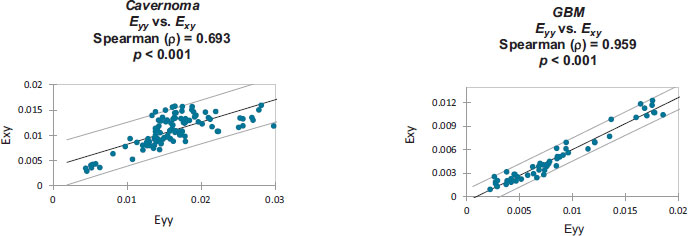
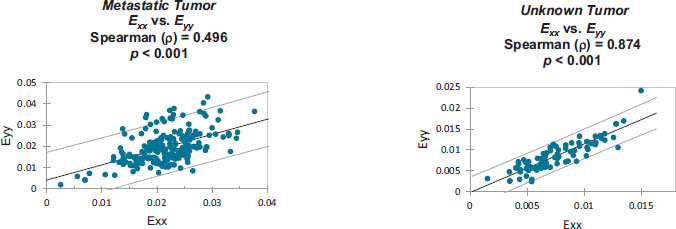
Strain correlation values within each individual patient’s craniotomy video are presented graphically in Appendix B. Overall. These strain values were found to have monotonically related correlations which were all statistically significant (p<0.001). Note that Spearman's rank correlation coefficient was utilized for this statistical analysis.
| - | GBM | Metastatic Tumor | Unknown Tumor |
|---|---|---|---|
| Cavernoma | p < 0.0001 | p < 0.0001 | p < 0.0001 |
| GBM | - | p < 0.0001 | n.s. |
| Metastatic Tumor | - | - | p < 0.0001 |
| - | GBM | Metastatic Tumor | Unknown Tumor |
|---|---|---|---|
| Cavernoma | p < 0.0001 | p < 0.0001 | p < 0.0001 |
| GBM | - | p < 0.0001 | n.s. |
| Metastatic Tumor | - | - | p < 0.0001 |
| - | GBM | Metastatic Tumor | Unknown Tumor |
|---|---|---|---|
| Cavernoma | p < 0.0001 | p < 0.0001 | p < 0.0001 |
| GBM | - | p < 0.0001 | p < 0.0001 |
| Metastatic Tumor | - | - | p < 0.0001 |
4. DISCUSSION
This study has demonstrated the potential for 2D-DIC to quantitate CSS from craniotomy videos. The collected data suggests that different intracranial pathologies, as well as their size, location, and related edema may be associated with statistically significant differences in CSS values.
As shown in the MRI images in Fig. (6), the craniotomy with the most visible edema, Unknown Tumor [9], had relatively small median CSS values which are presented in Figs. (14 and 15). This indicates that the presence of edema may cause significant reductions in CSS. Thus, edema may have resulted in the brain being less pulsatile, which subsequently may have reduced the observed CSS values.
Furthermore, GBM [7], which was a relatively large tumor, was strongly associated with a reduction in the magnitude of the observed CSS. This tumor may have resulted in an increase in intracranial pressure and, therefore, a reduction in pulsatility. Thus, we can infer that the reduced magnitude of the observed CSS may be indicative of a possible reduction in localized cerebral perfusion due to the compressive effect of the tumor.
In addition, the craniotomies of two small superficial tumors, Metastatic Tumor [8] and Cavernoma [6], had relatively large median CSS values.
An important factor that may greatly affect CSS in these craniotomies is the location of the craniotomy. It is plausible that there are regional differences in CSS. We cannot determine whether this is true or not from our limited dataset.
As demonstrated, CSS aligns with brain surface topography and differs when subject to different pathologies. Moreover, regional cerebral blood flow differences are similarly associated with neuropathology [14]. We expect that further studies may reveal regional differences in the CSS of the brain.
External factors, such as anesthetic technique, may also play a significant role in CSS. In addition, coexisting medical diseases, smoking history, as well as chronic alcohol or narcotic abuse may alter CSS either directly or indirectly.
The variation in CSS seen between these craniotomies may also be largely tied to age and gender. Note that cerebral pulsatility increases with age, the female sex, arterial stiffening, and pulse pressure [15]. Thus, patients’ preoperative medical history will undoubtedly play a role in understanding CSS values in depth.
Ncorr is a 2D-DIC program and may generate error regarding CSS calculations [16]. However, 2D-DIC does not suffer a significant loss in accuracy or precision in comparison to 3D-DIC. It has been noted that the “absolute difference in the average displacements and strain between 3D-DIC and 2D-DIC were in the range of the 3D-DIC variability” [4].
Murienne and Nguyen specifically noted that 2D-DIC might be used as an alternative to 3D-DIC under certain conditions, such as the inflation of a latex membrane [4].
Therefore, it is applicable to use Ncorr to analyze CSS, wherein the cyclic expansion/contraction of cerebral tissue is minimal [4].
2D-DIC is also effective when measuring the deformation of stiff membranes, where the margin of error is roughly equivalent to 3D-DIC. Moreover, 2D-DIC seems to be considerably more accurate than 3D-DIC when measuring vertical displacement, which further reinforces the use of Ncorr for CSS calculation [4].
Additionally, the angle of the camera lens with respect to the surface of the brain is crucial regarding accuracy. 2D-DIC was deemed ideal for these craniotomies largely for its precision when the plane of the brain’s surface is parallel to the camera lens.
The selection of DIC parameters also strongly affects the computed CSS and displacement values. High spatial resolution may lead to Ncorr's inability to accurately track the “movement” of the recognized patterns which consist of blood vessels, sulci, and gyri. Additionally, YouTube’s processing algorithm likely introduces noise artifacts.
In future studies, this issue would largely be alleviated by using high-resolution video cameras, which would capture additional detail. This would enable smaller subset spacing while compensating for the requisite decrease in spatial resolution, thus improving displacement calculations.
Higher-resolution files, captured with the camera lens parallel to the surface of the brain, would also allow for more optimization of the DIC settings to reduce noise, increase accuracy, and increase spatial resolution. At the same time, using higher-resolution files may strongly increase processing time, which would necessitate an increase in subset spacing.
The quality of the video camera and lens represent additional important factors. Specifically, lens distortion may introduce sufficient error in strain calculations to warrant consideration [17]. Limitations, such as the small sample size, suboptimal DIC settings to regulate noise vs. spatial resolution, and lack of an optimally sized artificial speckle pattern, may undermine the general validity of our initial findings.
Therefore, while promising, these preliminary results require additional analyses on a larger cohort of craniotomies which would be supplemented by MRI imaging and thorough clinical descriptions of patient conditions. Data regarding patients’ intraoperative blood pressure, intracranial pressure, and anesthetic technique are also necessary.
A similar non-contact optical technique is a flow motion tracking modality that utilizes stereo images. Using this technique, Ji et al. observed that CSS is directly related to the magnitude of tissue compliance [18].
It should be noted that Ji et al. obtained displacements in three dimensions rather than two by using two stereo images. Ji et al. also applied a smoothing technique to the displacement field to reduce noise when calculating strain.
Their method of measuring displacement was also very different from that used by Ncorr. Specifically, Ji et al. used an optical flow algorithm with an additional gradient constancy assumption to allow for the extraction of displacement vectors.
Ji et al. found highly different strain results from those shown in Figs. (14 and 15). It should be noted that Ncorr found average strain values almost entirely below 0.03 (3%), whereas the optical flow motion tracking modality found average strains between 0.067 (6.7%) and 0.047 (4.7%). Furthermore, the largest strains found by Ji et al. reached up to 0.18 (18%).
Quantitative data regarding CSS has significant potential for use in neurosurgery and neuroanesthesia. Primarily, this information could be used to gauge the real-time response of the brain to different surgical techniques as well as to different anesthetic and adjunct agents.
Instead of relying on the palpation of the surface of the brain and qualitatively “guessing” its pulsatility, a real-time measurement of pulsatility would allow for a greater understanding of the perfusion of different cerebral surface regions. For example, ranges of CSS values for perfused vs. underperfused regions or along surface topography could eventually be compiled with respect to different patient populations. These data would provide the surgeon and anesthesiologist with additional information for comparison during surgery.
Measuring CSS in real-time during neurosurgery is a strong first step towards being able to quantitatively measure pulsatility. In addition, recent advances in GPU-accelerated DIC, such as GPUCorrel [19], offer open-source software which may greatly ease and accelerate clinical research in this direction.
CONCLUSION
CSS has the potential for use as a non-invasive marker for localized brain tissue perfusion. Currently, neurosurgeons physically palpate the surface of the brain to qualitatively assess pulsatility.
In this study, Ncorr was used to derive CSS and surface displacement from four craniotomy videos. Retrospective analysis of this CSS data subsequently revealed statistical differences between means of the absolute strain values in 16 of 18 (89%) statistical tests.
Thus, this study has demonstrated the successful use of Ncorr 2D-DIC to quantitate CSS and a “significant step” in the intraoperative measurement of pulsatility. Future work is needed to document CSS data across a large number of craniotomies to establish baseline ranges for normal strain.
Studies continuing this work could potentially benefit by utilizing a high-resolution video camera accurately aligned with the surface of the brain.
Furthermore, it is important to optimize DIC settings for noise reduction, spatial resolution, and to improve the overall accuracy of displacement measurements.
Once intraoperative CSS is more thoroughly documented, 3D-DIC programs should be run simultaneously with 2D-DIC programs to measure differences in calculated CSS.
Lastly, CSS during neurosurgery could also be paired with other variables for analysis, such as cerebral perfusion pressure and/or cerebral blood flow.
LIST OF ABBREVIATIONS
| DIC | = Digital Image Correlation |
| CSS | = Cerebral Surface Strain |
| ROI | = Region of Interest |
ETHICS APPROVAL AND CONSENT TO PARTICIPATE
It should be noted that each Institutional Review Board (IRB) deemed this study exempt, owing to its retrospective analysis of anonymous YouTube videos. Furthermore, the authors have received permission to use these copyrighted videos.
AVAILABILITY OF DATA AND MATERIALS
The data and supportive information are available within the article.
ACKNOWLEDGEMENTS
Declared none.
APPENDIX A
When both strains and rigid body rotations are small, the quadratic terms in the Green-Lagrangian strain tensor can be ignored, leading to engineering strain tensors.
APPENDIX B
Monotonically increasing strain relationships are illustrated, within each patient-specific dataset, along with their associated 95% confidence intervals:
Strain values from: Cavernoma [6].
Strain values from: GBM [7].
Strain values from: Metastatic Tumor [8].
Strain values from: Unknown Tumor [9].