All published articles of this journal are available on ScienceDirect.

Entropy Measures with Three-axis Motion Time-series Data: Comparison of Dominant and Non-dominant Hand in Multi-directional Reach
Authors Info & Affiliations
Abstract
Background:
Motion variance differs among individuals, knowing as the differences in dominant and non-dominant hand functions provide beneficial information to clinicians or therapists regarding accurate diagnosis and rehabilitation purposes. However, due to subjective considerations, there are some limitations of the handedness questionnaires, which are one of the standard methods for evaluating interlimb function differences.
Objective:
This study aims to quantify the differences in upper limb motions between the dominant and non-dominant hands in the reaching task using approximate entropy (ApEn) and sample entropy (SampEn) measures. This study also provides proper combinations of parameter values m and r for the ApEn and SampEn measures in the hand movement data of the reaching task.
Methods:
Twenty volunteers performed a multi-directional reaching task. The acceleration data of hand motions were recorded by GENEActiv 3D acceleration sensor (Activinsights Ltd., UK) with a sampling frequency of 1000 Hz. In addition, the ApEn and SampEn values were analysed.
Results:
The ApEn values of the dominant hand were statistically significantly lower than those of the non-dominant hand for parameter combinations of m=2,3,4,5 with r=0.15,0.20,0.25 for the Y- and Z-axis (p<0.05). The SampEn values of the dominant hand significantly demonstrated lower than those of the non-dominant hand for all axes when computing on combinations of parameter m=2,3,4,5 with r=0.15,0.20 (p<0.05).
Conclusion:
The ApEn and SampEn measures could be used to predict the degree of regularity or complexity of the reaching hand motion time-series data. These entropy measures also reveal the differences between the dominant and non-dominant hand movements, quantifying movement differences in the dynamic motor tasks associated with hemispheric brain asymmetry.
1. INTRODUCTION
Reaching, a representative dynamic movement corresponding to handedness has been extensively studied in healthy people and people with diseases [1-10]. It is also one of the significant fundamental tasks of upper limb performances in daily activities. As the brain's two cerebral hemispheres are asymmetrical in structure and function [11, 12]. The demonstration of the hemispheric brain asymmetry to control upper limb movements is commonly known as handedness [13-19].
According to the research of M.P. Bryden [20], there would be no differences between the dominant and non-dominant hands for performing unskilled or simple tasks, e.g., reaching. The preferred hand would perform better than the non-dominant hand for skilled tasks. On the other hand, based on the dynamic dominance model of brain lateralisation, the movement differences of each arm would be observed [17, 21]. The dominant hand movements would be smoother and straighter than those of the non-dominant hand [17]. The relationship between a bias in the preferential use of one hand over another hand and a bias in the skill to perform the task of one hand over the other is still unclear. Researchers have studied the link between hand preference and hand performance related to the lateralisation of motor control mechanisms for each hemispheric asymmetry system. They examined the differences between both hands when performing the reaching tasks to attain an advanced understanding of specialised motor skill lateralisation [17, 20, 22]. In a clinical situation, comparing interlimb functions is crucially recommended to clinicians and therapists and should be cautiously undertaken because the differences in interlimb movements affect physical performance. Comparing dominant and non-dominant hand functions were examined in healthy volunteers and patients regarding accurate diagnosis and rehabilitation purposes [23-30]. The data on handedness ques-tionnaires, which were one of the common methods to evaluate the differences between the dominant and non-dominant hand functions, is required to give more accuracy in rating the functionality scales because of its natural subjective considerations [25, 27]. Therefore, investigating the quanti-tative data of the differences between the dominant and non-dominant hand motions is essential.
The imaging technologies, e.g., functional MRI [31, 32], one of the most widely used methods to study a function of hemispheric brain asymmetry, have some limitations in evaluating a dynamic movement, e.g., motion artifact [15, 19]. In measuring the characteristics of reaching and exploring arm-hemispheric asymmetry, many studies have examined the quantification of reaching using various variables of kinematics [17, 19] and kinetics techniques [13]. Nevertheless, there is still a lack of studies investigating the complexity and chaotic behaviour of the acceleration time-series data when performing the reaching task between the dominant and non-dominant hand movements by using entropy measures. Approximate entropy (ApEn) and sample entropy (SampEn) are two popular entropy measurement methods in time domain analysis to investigate the predictability and complexity of the time-series data. These two entropy measures have now been broadly applied in many studies regarding quantifying complexity measures in several biological time-series signals [33], e.g., the centre of pressure [34-39] and heart rate [40, 41].
The computation of ApEn and SampEn values is dependent on the input parameters m (length of subseries data), r (tolerance of similarity), and N (length of signal data) [38, 39]. The input parameter m=1,2,3 and the use of r values between 0.10-0.25 multiply the standard deviation (SD) of the time-series data was traditionally recommended to calculate the ApEn and SampEn values because of producing good statistical validity of entropy for predicting the randomness of the clinical data, e.g., respiratory and cardiovascular data [34, 42-45]. Nevertheless, these recommendations do not always bring about optimal entropy values for other data types. Moreover, there are no clear instructions and standard guidelines on what input parameter values should be selected for other types of time-series data to measure the regularity and complexity of the signals using the ApEn and SampEn [38, 39]. So, each study of biological signals should also examine their own input parameters, m and r, to calculate the ApEn and SampEn values for providing important information.
Currently, there have not been any researches that study the parameter combinations m and r to examine the differences in the entropy analysis of reaching through the motion time-series data. This study aims to examine the differences in the three-axis acceleration time-series data of the upper limb motions between the dominant and non-dominant hands in the reaching task using the ApEn and SampEn measures. This study will provide information for future research regarding the studies of handedness or arm laterality in controlling movements in the reaching task and also provide the combinations of parameter values m and r for the ApEn and SampEn measures in the hand movement data of the reaching task.
2. MATERIALS AND METHODS
2.1. Participants
Twenty volunteers (10 males and females) aged between 24-40 years participated in the study. They had no history of neurological diseases and musculoskeletal impairments of the upper limbs, which could interfere with task performance. The handedness of participants was assessed by the Edinburgh inventory [46]. Nineteen volunteers were right-handed, and one was left-handed. Before starting the experiment, the participant information sheet was provided to all participants, and they then signed a consent form. The ethical approval was proved by the School Research Ethics Committee of the School of Science and Engineering, University of Dundee (UOD-SSEREC-BE-RPG-2019-006).
2.2. Reaching Task Design
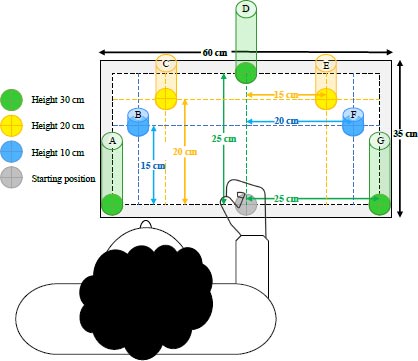
As reaching is essential in daily activities, this study then designed a simulated task for reaching in three-dimensional space to measure the movement differences between both arms [47-49]. The mimic three-dimensional reaching task was modified from moving hands on a dimensional board in Praditpod’s study [50]. Seven pillars with different heights were placed on the board with different locations to provide multi-directional reaching movements to represent hand movements in everyday manual activities. The details of the height and location of each pillar on the board are shown in Fig. (1).
2.3. Procedure
The participants wore a wearable sensor on both wrists throughout the experimental period. Before starting the experiment, they placed their hand on a starting point (a grey marker) on the board with a side fist position (Fig. 1). The researcher demonstrated the sequences of the reaching task to them for one trial. They were then introduced to perform the reaching task on both hands and were trained on the task by watching a video and/or handout, which illustrated the sequences of the reaching task.
They were asked to perform the reaching task as fast and smoothly as possible. Reaching movements were also recorded by video recorder during the experiment. The participants’ faces were not captured to preserve their privacies. The sequences of the reaching task are described in Appendix A.
2.4. Data Analysis
A commercial three-dimensional accelerometer sensor, the GENEActiv accelerometer sensor (Activinsights Ltd., UK), recorded the motion data of the reaching task. The acceleration data were recorded at a frequency of 1000 Hz to avoid losing the important data of the motion signals [51] and to generate the time-series data to be closer to the actual movements as well as to prevent aliasing when doing signal processing as the frequency of reaching is still unknown. The data were extracted and downloaded from the sensor via GENEActiv PC software once the recording of hand motions was complete. The derivative acceleration data were imported to MATLAB software (Version 9.2, MathWorks, USA) for entropy analysis.
2.4.1. Entropy Measures
Entropy is an idea that addresses information related to the predictability and randomness of the dynamic system. This study employed the approximate entropy (ApEn) and sample entropy (SampEn) as the methods for entropy estimation of the hand motion time-series data.
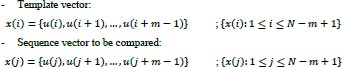
Pincus introduced a set of data complexity measurements, which is called approximate entropy, that is easily applied to short and noisy time-series data of clinical biological signals [43, 52, 53]. The concept of the ApEn is that the N length of time-series data is divided into the m length of embedding vectors, which are called a template vector and a compared vector. After that, the similarity of these two vectors is compared. The template vector is compared with all the next following vectors in the sequences. Those two compared vectors containing m data points and having a range from
 to
to
 are generated as:
 |
Then, the maximum difference of distance between the template vector,
 , and the compared vector,
 , is calculated by computing component-by-component of all their corresponding scalar components as follows:
 |
If the distance difference between each scalar component of
and
is less than or equal to the value of r, those compared vectors are considered as “possible”. Then, the next component is computed. Consequently, if the distance difference between all scalar components of
and
meets the required condition that
 those compared vectors are considered as “template match”.
To compute the value of the function
 , the conditional probabilities are calculated by the total of template matches divided by those of possible vectors as follows:
 |
(1) |
Of the
calculation, the vector
 is called a template vector, whereas the vector
 within threshold r is called a template match vector. So,
is the conditional probability that any vectors
are in threshold r of the data set.
within threshold r is called a template match vector. So,
is the conditional probability that any vectors
are in threshold r of the data set.
The function
 , the average of natural logarithms of function
, is computed as:
, the average of natural logarithms of function
, is computed as:
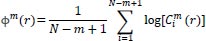 |
(2) |
The statistical estimator of the parameter ApEn (m, r) is defined as:
 |
(3) |
Therefore, the value of ApEn can be approximately calculated as:
 |
(4) |
Besides, sample entropy (SampEn), a modified version of the ApEn, is a powerful and useful method to understand, quantify, and measure the complexity or the amount of regularity of a time series of biological signals in experimental clinical studies [43, 44, 53, 54]. Because of the bias of ApEn, to exclude self-matches calculating and consider only the first
 vectors of length m to ensure that
 and
and
 for
for
 were defined. Therefore, Richman and Moorman defined the algorithm of the SampEn as follows [44].
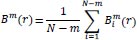
The total number of possible vectors,
 , is defined as:
 |
(5) |
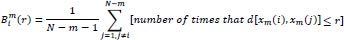
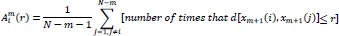
The function
 which is the conditional probability that two vectors match for
m
points, is defined as:
which is the conditional probability that two vectors match for
m
points, is defined as:
 |
(6) |
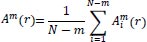
Likewise, the total number of template match vectors,
 , is defined as:
 |
(7) |
Then, the function
 , which is the conditional probability that two vectors are similar for m+1 points, is defined as:
 |
(8) |
The statistical estimator of the parameter SampEn (m, r) is defined as:
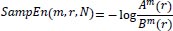 |
(9) |
Therefore,
 |
(10) |
2.5. Statistical Analysis
A Shapiro-Wilk test was used to test for the normality of the ApEn and SampEn values. The statistically significant differences between the dominant and non-dominant hands have been examined through a Paired T-test for normal distribution data and a Wilcoxon Signed Rank test for non-normal distribution data [54-57]. Statistical significance was set at p<0.05.
3. RESULTS
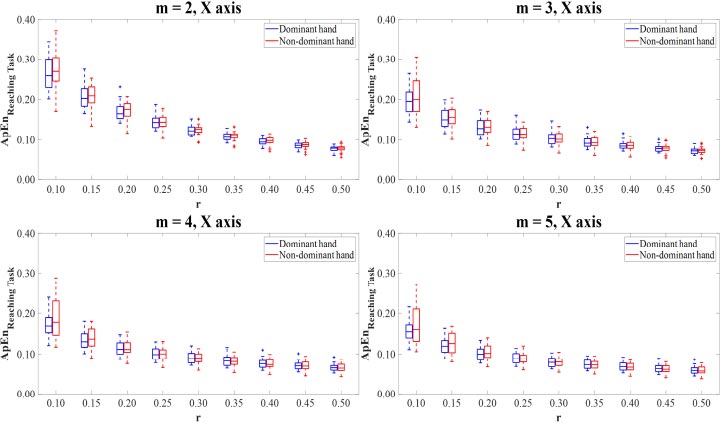
The combinations of parameter values were set m=2,3,4,5 and r=0.10,0.15,0.20,0.25,0.30,0.35,0.40,0.45,0.50 to calculate the ApEn and SampEn values of the motion time-series data. For the multi-directional reaching task, the ApEn and SampEn values were computed on the X-axis, Y-axis, Z-axis, and Vector magnitude of the dominant and non-dominant hand motion time-series data for all thirty-six combinations of parameter values m and r. On the ApEn and SampEn values, low values describe that the time-series signal is less complex and has high predictability, while high values mean that the signal is more complex and has poor predictability.
3.1. Approximate Entropy
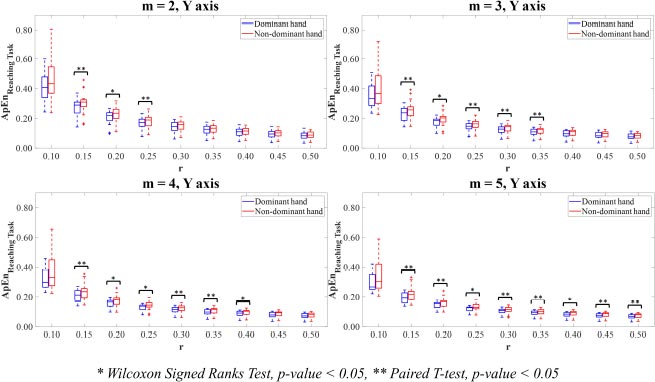
The ApEn values of the dominant and non-dominant movements in terms of mean and standard deviation (SD) are shown in Table 1. The ApEn values of the dominant hand movements were mostly lower than those of non-dominant hand movements. Paired T-test and Wilcoxon Signed Rank test revealed that there were no differences in the ApEn values between the dominant and non-dominant hands on X-axis (Fig. 2). There were significant differences (p<0.05) between the ApEn values for the dominant hand movements compared to the non-dominant hand movements on Y-axis (Fig. 3), Z-axis (Fig. 4), and Vector Magnitude (Fig. 5).
In Y-axis, the dominant hand motion time-series signal showed significantly higher predictability than the non-dominant hand. Statistical analysis showed that those differences were significant for the combinations of parameter values m=2 with r=0.15,0.20,0.25, m=3 with r=0.15,0.20, 0.25,0.30,0.35, m=4 with r=0.15,0.20,0.25,0.30,0.35,0.40, and m=5 with r=0.15,0.20,0.25,0.30,0.35,0.40,0.45,0.50 (p<0.05).
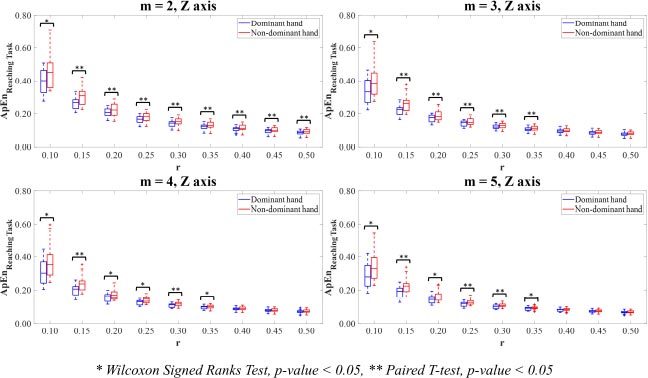
In Z-axis, the motion time-series data of the dominant hand showed lower ApEn values than the non-dominant hand. Of parameter value m=2, the ApEn values computing on the combinations with all parameter values r in the dominant hand were statistically significantly lower than those in the non-dominant hand (p<0.05). The results of parameter values m= 3,4,5 showed that the ApEn values in the dominant hand were statistically significantly lower than those in the non-dominant hand for the combinations with r=0.10,0.15,0.20,0.25,0.30,0.35 (p<0.05).
| Approximate entropy values (N = 20) | |||||||||||||||||
| m | r | X-axis | Y-axis | Z-axis | Vector magnitude | ||||||||||||
| Dominant hand | Non-dominant hand | Dominant hand | Non-dominant hand | Dominant hand | Non-dominant hand | Dominant hand | Non-dominant hand | ||||||||||
| Mean | SD | Mean | SD | Mean | SD | Mean | SD | Mean | SD | Mean | SD | Mean | SD | Mean | SD | ||
| 2 | 0.10 | 0.2649 | 0.0419 | 0.2695 | 0.0484 | 0.4185 | 0.0996 | 0.4582 | 0.1329 | 0.3998* | 0.0770 | 0.4604* | 0.1135 | 0.2556 | 0.0406 | 0.2804 | 0.0652 |
| 0.15 | 0.2066 | 0.0306 | 0.2077 | 0.0307 | 0.2712** | 0.0618 | 0.3040** | 0.0716 | 0.2658** | 0.0379 | 0.3028** | 0.0551 | 0.1885 | 0.0270 | 0.2004 | 0.0345 | |
| 0.20 | 0.1696 | 0.0228 | 0.1714 | 0.0232 | 0.2070* | 0.0473 | 0.2284* | 0.0542 | 0.2059** | 0.0282 | 0.2244** | 0.0380 | 0.1514 | 0.0204 | 0.1590 | 0.0240 | |
| 0.25 | 0.1437 | 0.0166 | 0.1447 | 0.0188 | 0.1660** | 0.0413 | 0.1817** | 0.0426 | 0.1659** | 0.0235 | 0.1803** | 0.0268 | 0.1276 | 0.0156 | 0.1323 | 0.0183 | |
| 0.30 | 0.1233 | 0.0122 | 0.1250 | 0.0149 | 0.1406 | 0.0386 | 0.1516 | 0.0367 | 0.1397** | 0.0193 | 0.1514** | 0.0228 | 0.1097 | 0.0129 | 0.1136 | 0.0149 | |
| 0.35 | 0.1080 | 0.0098 | 0.1098 | 0.0127 | 0.1208 | 0.0342 | 0.1289 | 0.0319 | 0.1215** | 0.0175 | 0.1304** | 0.0215 | 0.0963 | 0.0107 | 0.0994 | 0.0126 | |
| 0.40 | 0.0950 | 0.0084 | 0.0972 | 0.0108 | 0.1053 | 0.0314 | 0.1109 | 0.0275 | 0.1072** | 0.0157 | 0.1154** | 0.0193 | 0.0854 | 0.0091 | 0.0884 | 0.0113 | |
| 0.45 | 0.0850 | 0.0073 | 0.0864 | 0.0097 | 0.0928 | 0.0295 | 0.0980 | 0.0256 | 0.0952** | 0.0141 | 0.1022** | 0.0175 | 0.0769 | 0.0078 | 0.0794 | 0.0102 | |
| 0.50 | 0.0769 | 0.0071 | 0.0777 | 0.0093 | 0.0825 | 0.0268 | 0.0870 | 0.0233 | 0.0858** | 0.0134 | 0.0920** | 0.0163 | 0.0696 | 0.0069 | 0.0720 | 0.0092 | |
| 3 | 0.10 | 0.1947 | 0.0331 | 0.2056 | 0.0481 | 0.3580 | 0.0844 | 0.3934 | 0.1220 | 0.3392* | 0.0781 | 0.4029* | 0.1103 | 0.2053** | 0.0397 | 0.2292** | 0.0661 |
| 0.15 | 0.1547 | 0.0250 | 0.1552 | 0.0266 | 0.2283** | 0.0452 | 0.2566** | 0.0608 | 0.2207** | 0.0338 | 0.2582** | 0.0500 | 0.1509 | 0.0229 | 0.1606 | 0.0314 | |
| 0.20 | 0.1322 | 0.0218 | 0.1319 | 0.0210 | 0.1747* | 0.0329 | 0.1948* | 0.0444 | 0.1723** | 0.0227 | 0.1898** | 0.0319 | 0.1222 | 0.0188 | 0.1283 | 0.0205 | |
| 0.25 | 0.1165 | 0.0196 | 0.1157 | 0.0183 | 0.1417** | 0.0291 | 0.1579** | 0.0350 | 0.1407** | 0.0175 | 0.1523** | 0.0203 | 0.1036 | 0.0160 | 0.1081 | 0.0161 | |
| 0.30 | 0.1043 | 0.0169 | 0.1034 | 0.0160 | 0.1217** | 0.0289 | 0.1340** | 0.0313 | 0.1196** | 0.0139 | 0.1286** | 0.0170 | 0.0906 | 0.0137 | 0.0945 | 0.0135 | |
| 0.35 | 0.0941 | 0.0140 | 0.0937 | 0.0142 | 0.1064** | 0.0268 | 0.1165** | 0.0280 | 0.1052** | 0.0130 | 0.1118** | 0.0167 | 0.0808 | 0.0114 | 0.0838 | 0.0117 | |
| 0.40 | 0.0856 | 0.0110 | 0.0851 | 0.0122 | 0.0945 | 0.0255 | 0.1022 | 0.0250 | 0.0937 | 0.0132 | 0.0998 | 0.0155 | 0.0730 | 0.0100 | 0.0753 | 0.0103 | |
| 0.45 | 0.0781 | 0.0090 | 0.0782 | 0.0105 | 0.0849 | 0.0249 | 0.0914 | 0.0231 | 0.0842 | 0.0127 | 0.0899 | 0.0146 | 0.0666 | 0.0088 | 0.0682 | 0.0093 | |
| 0.50 | 0.0717 | 0.0076 | 0.0722 | 0.0094 | 0.0767 | 0.0232 | 0.0815 | 0.0209 | 0.0768 | 0.0123 | 0.0818 | 0.0139 | 0.0610 | 0.0078 | 0.0624 | 0.0088 | |
| 4 | 0.10 | 0.1716 | 0.0309 | 0.1856 | 0.0483 | 0.3268 | 0.0757 | 0.3595 | 0.1109 | 0.3112* | 0.0766 | 0.3731* | 0.1068 | 0.1849** | 0.0404 | 0.2095** | 0.0649 |
| 0.15 | 0.1334 | 0.0225 | 0.1375 | 0.0266 | 0.2078** | 0.0383 | 0.2344** | 0.0540 | 0.2010** | 0.0336 | 0.2388** | 0.0484 | 0.1357 | 0.0232 | 0.1457 | 0.0313 | |
| 0.20 | 0.1139 | 0.0186 | 0.1139 | 0.0188 | 0.1586* | 0.0268 | 0.1764* | 0.0385 | 0.1552* | 0.0227 | 0.1736* | 0.0301 | 0.1114 | 0.0167 | 0.1154 | 0.0201 | |
| 0.25 | 0.1011 | 0.0162 | 0.0995 | 0.0155 | 0.1291* | 0.0231 | 0.1431* | 0.0292 | 0.1267* | 0.0156 | 0.1389* | 0.0174 | 0.0945 | 0.0141 | 0.0976 | 0.0150 | |
| 0.30 | 0.0913 | 0.0151 | 0.0900 | 0.0139 | 0.1108** | 0.0230 | 0.1220** | 0.0265 | 0.1090** | 0.0121 | 0.1172** | 0.0136 | 0.0832 | 0.0134 | 0.0852 | 0.0125 | |
| 0.35 | 0.0836 | 0.0144 | 0.0824 | 0.0129 | 0.0968** | 0.0215 | 0.1070** | 0.0242 | 0.0968* | 0.0107 | 0.1019* | 0.0131 | 0.0735 | 0.0116 | 0.0760 | 0.0107 | |
| 0.40 | 0.0766 | 0.0130 | 0.0758 | 0.0119 | 0.0865* | 0.0209 | 0.0946* | 0.0222 | 0.0870 | 0.0108 | 0.0910 | 0.0123 | 0.0666 | 0.0104 | 0.0688 | 0.0097 | |
| 0.45 | 0.0708 | 0.0111 | 0.0701 | 0.0111 | 0.0782 | 0.0209 | 0.0853 | 0.0209 | 0.0783 | 0.0106 | 0.0817 | 0.0119 | 0.0608 | 0.0092 | 0.0625 | 0.0089 | |
| 0.50 | 0.0656 | 0.0095 | 0.0650 | 0.0102 | 0.0713 | 0.0198 | 0.0768 | 0.0194 | 0.0713 | 0.0108 | 0.0747 | 0.0116 | 0.0559 | 0.0082 | 0.0574 | 0.0082 | |
| 5 | 0.10 | 0.1556 | 0.0279 | 0.1699 | 0.0466 | 0.3015 | 0.0705 | 0.3302 | 0.1013 | 0.2891* | 0.0745 | 0.3467* | 0.1008 | 0.1693** | 0.0384 | 0.1944** | 0.0634 |
| 0.15 | 0.1194 | 0.0205 | 0.1261 | 0.0275 | 0.1934** | 0.0336 | 0.2182** | 0.0496 | 0.1878** | 0.0343 | 0.2245** | 0.0479 | 0.1243** | 0.0243 | 0.1357** | 0.0314 | |
| 0.20 | 0.1006 | 0.0171 | 0.1035 | 0.0192 | 0.1472** | 0.0231 | 0.1636** | 0.0340 | 0.1443* | 0.0228 | 0.1629* | 0.0296 | 0.1021 | 0.0168 | 0.1071 | 0.0201 | |
| 0.25 | 0.0890 | 0.0145 | 0.0889 | 0.0147 | 0.1196* | 0.0195 | 0.1323* | 0.0251 | 0.1174** | 0.0151 | 0.1299** | 0.0163 | 0.0879 | 0.0128 | 0.0902 | 0.0152 | |
| 0.30 | 0.0806 | 0.0129 | 0.0794 | 0.0122 | 0.1032** | 0.0190 | 0.1132** | 0.0225 | 0.1010** | 0.0120 | 0.1093** | 0.0114 | 0.0769 | 0.0110 | 0.0789 | 0.0119 | |
| 0.35 | 0.0745 | 0.0122 | 0.0729 | 0.0111 | 0.0906** | 0.0177 | 0.0996** | 0.0208 | 0.0896* | 0.0103 | 0.0949* | 0.0109 | 0.0680 | 0.0101 | 0.0704 | 0.0101 | |
| 0.40 | 0.0687 | 0.0117 | 0.0674 | 0.0104 | 0.0809* | 0.0176 | 0.0885* | 0.0194 | 0.0809 | 0.0094 | 0.0850 | 0.0103 | 0.0616 | 0.0094 | 0.0639 | 0.0091 | |
| 0.45 | 0.0638 | 0.0113 | 0.0627 | 0.0099 | 0.0729** | 0.0177 | 0.0804** | 0.0187 | 0.0735 | 0.0090 | 0.0766 | 0.0100 | 0.0563 | 0.0087 | 0.0582 | 0.0083 | |
| 0.50 | 0.0596 | 0.0105 | 0.0588 | 0.0096 | 0.0667** | 0.0169 | 0.0731** | 0.0176 | 0.0676 | 0.0094 | 0.0701 | 0.0100 | 0.0518 | 0.0080 | 0.0535 | 0.0078 | |
** Paired T-test, p-value < 0.05
| Sample entropy values (N = 20) | |||||||||||||||||
| m | r | X-axis | Y-axis | Z-axis | Vector magnitude | ||||||||||||
| Dominant hand | Non-dominant hand | Dominant hand | Non-dominant hand | Dominant hand | Non-dominant hand | Dominant hand | Non-dominant hand | ||||||||||
| Mean | SD | Mean | SD | Mean | SD | Mean | SD | Mean | SD | Mean | SD | Mean | SD | Mean | SD | ||
| 2 | 0.10 | 0.1396** | 0.0318 | 0.1553** | 0.0526 | 0.3049 | 0.0837 | 0.3388 | 0.1157 | 0.2915** | 0.0786 | 0.3493** | 0.1093 | 0.1570** | 0.0462 | 0.1819** | 0.0729 |
| 0.15 | 0.0967** | 0.0193 | 0.1050** | 0.0299 | 0.1844** | 0.0453 | 0.2122** | 0.0581 | 0.1802** | 0.0402 | 0.2154** | 0.0561 | 0.1027 | 0.0274 | 0.1153 | 0.0397 | |
| 0.20 | 0.0747** | 0.0143 | 0.0809** | 0.0210 | 0.1354** | 0.0298 | 0.1546** | 0.0411 | 0.1335** | 0.0287 | 0.1518** | 0.0371 | 0.0762 | 0.0197 | 0.0845 | 0.0270 | |
| 0.25 | 0.0611 | 0.0115 | 0.0655 | 0.0158 | 0.1061** | 0.0231 | 0.1210** | 0.0285 | 0.1041** | 0.0205 | 0.1174** | 0.0245 | 0.0603 | 0.0154 | 0.0663 | 0.0205 | |
| 0.30 | 0.0516** | 0.0094 | 0.0549** | 0.0124 | 0.0887** | 0.0201 | 0.1001** | 0.0232 | 0.0856** | 0.0154 | 0.0960** | 0.0177 | 0.0495 | 0.0127 | 0.0544 | 0.0164 | |
| 0.35 | 0.0446** | 0.0079 | 0.0477** | 0.0106 | 0.0756** | 0.0165 | 0.0851** | 0.0188 | 0.0733** | 0.0130 | 0.0810** | 0.0142 | 0.0417 | 0.0109 | 0.0456 | 0.0136 | |
| 0.40 | 0.0389** | 0.0067 | 0.0418** | 0.0090 | 0.0659** | 0.0143 | 0.0734** | 0.0160 | 0.0638** | 0.0112 | 0.0706** | 0.0120 | 0.0358 | 0.0095 | 0.0391 | 0.0115 | |
| 0.45 | 0.0345** | 0.0060 | 0.0371** | 0.0077 | 0.0582** | 0.0131 | 0.0650** | 0.0145 | 0.0560** | 0.0094 | 0.0618** | 0.0098 | 0.0311 | 0.0084 | 0.0340 | 0.0100 | |
| 0.50 | 0.0310** | 0.0053 | 0.0332** | 0.0067 | 0.0520** | 0.0114 | 0.0576** | 0.0120 | 0.0500** | 0.0084 | 0.0552** | 0.0083 | 0.0274 | 0.0075 | 0.0300 | 0.0088 | |
| 3 | 0.10 | 0.1166** | 0.0306 | 0.1345** | 0.0519 | 0.2689 | 0.0719 | 0.2995 | 0.1070 | 0.2567** | 0.0753 | 0.3163** | 0.1057 | 0.1339** | 0.0441 | 0.1589** | 0.0691 |
| 0.15 | 0.0793** | 0.0178 | 0.0884** | 0.0287 | 0.1556** | 0.0347 | 0.1796** | 0.0500 | 0.1521** | 0.0365 | 0.1870** | 0.0511 | 0.0868 | 0.0250 | 0.0979 | 0.0357 | |
| 0.20 | 0.0620** | 0.0125 | 0.0676** | 0.0196 | 0.1122** | 0.0215 | 0.1284** | 0.0337 | 0.1109** | 0.0252 | 0.1282** | 0.0322 | 0.0649 | 0.0173 | 0.0715 | 0.0232 | |
| 0.25 | 0.0518 | 0.0101 | 0.0553 | 0.0146 | 0.0874** | 0.0163 | 0.1002** | 0.0225 | 0.0862** | 0.0172 | 0.0979** | 0.0200 | 0.0518 | 0.0136 | 0.0565 | 0.0172 | |
| 0.30 | 0.0446 | 0.0085 | 0.0472 | 0.0115 | 0.0731** | 0.0143 | 0.0831** | 0.0181 | 0.0711** | 0.0128 | 0.0796** | 0.0139 | 0.0430 | 0.0114 | 0.0467 | 0.0137 | |
| 0.35 | 0.0393 | 0.0075 | 0.0416 | 0.0098 | 0.0626** | 0.0120 | 0.0713** | 0.0148 | 0.0611** | 0.0105 | 0.0671** | 0.0110 | 0.0367 | 0.0098 | 0.0396 | 0.0113 | |
| 0.40 | 0.0349 | 0.0066 | 0.0369 | 0.0083 | 0.0550** | 0.0107 | 0.0620** | 0.0128 | 0.0534** | 0.0089 | 0.0586** | 0.0092 | 0.0318 | 0.0086 | 0.0343 | 0.0096 | |
| 0.45 | 0.0314 | 0.0059 | 0.0331 | 0.0072 | 0.0489** | 0.0100 | 0.0552** | 0.0117 | 0.0470** | 0.0075 | 0.0515** | 0.0075 | 0.0279 | 0.0076 | 0.0301 | 0.0083 | |
| 0.50 | 0.0285 | 0.0052 | 0.0301 | 0.0063 | 0.0441** | 0.0088 | 0.0493** | 0.0099 | 0.0422** | 0.0069 | 0.0462** | 0.0064 | 0.0248 | 0.0068 | 0.0267 | 0.0073 | |
| 4 | 0.10 | 0.1091** | 0.0304 | 0.1282** | 0.0514 | 0.2560 | 0.0673 | 0.2847 | 0.1027 | 0.2428** | 0.0736 | 0.3035** | 0.1041 | 0.1246** | 0.0434 | 0.1495** | 0.0676 |
| 0.15 | 0.0726** | 0.0181 | 0.0825** | 0.0290 | 0.1443* | 0.0301 | 0.1669* | 0.0456 | 0.1408** | 0.0352 | 0.1759** | 0.0492 | 0.0796 | 0.0253 | 0.0949 | 0.0461 | |
| 0.20 | 0.0559** | 0.0124 | 0.0621** | 0.0198 | 0.1021** | 0.0173 | 0.1169** | 0.0294 | 0.1010** | 0.0243 | 0.1182** | 0.0306 | 0.0594 | 0.0172 | 0.0655 | 0.0220 | |
| 0.25 | 0.0465 | 0.0097 | 0.0502 | 0.0145 | 0.0790** | 0.0128 | 0.0901** | 0.0191 | 0.0777** | 0.0163 | 0.0892** | 0.0184 | 0.0476 | 0.0131 | 0.0516 | 0.0161 | |
| 0.30 | 0.0402 | 0.0079 | 0.0427 | 0.0112 | 0.0660** | 0.0113 | 0.0745** | 0.0150 | 0.0639** | 0.0122 | 0.0720** | 0.0123 | 0.0396 | 0.0108 | 0.0427 | 0.0127 | |
| 0.35 | 0.0357 | 0.0069 | 0.0377 | 0.0095 | 0.0564** | 0.0094 | 0.0640** | 0.0123 | 0.0550** | 0.0100 | 0.0605** | 0.0097 | 0.0339 | 0.0093 | 0.0363 | 0.0105 | |
| 0.40 | 0.0319 | 0.0062 | 0.0337 | 0.0081 | 0.0495** | 0.0085 | 0.0558** | 0.0106 | 0.0482** | 0.0085 | 0.0528** | 0.0082 | 0.0295 | 0.0083 | 0.0315 | 0.0089 | |
| 0.45 | 0.0290 | 0.0057 | 0.0305 | 0.0070 | 0.0440** | 0.0079 | 0.0499** | 0.0098 | 0.0427** | 0.0070 | 0.0463** | 0.0067 | 0.0260 | 0.0074 | 0.0278 | 0.0077 | |
| 0.50 | 0.0265 | 0.0052 | 0.0278 | 0.0062 | 0.0397** | 0.0072 | 0.0448** | 0.0084 | 0.0383** | 0.0063 | 0.0416** | 0.0057 | 0.0232 | 0.0066 | 0.0248 | 0.0068 | |
| 5 | 0.10 | 0.1046** | 0.0295 | 0.1235** | 0.0496 | 0.2460 | 0.0657 | 0.2736 | 0.1012 | 0.2339** | 0.0724 | 0.2937** | 0.1030 | 0.1186** | 0.0419 | 0.1425** | 0.0659 |
| 0.15 | 0.0687** | 0.0180 | 0.0793** | 0.0291 | 0.1380* | 0.0276 | 0.1593* | 0.0429 | 0.1346** | 0.0351 | 0.1691** | 0.0482 | 0.0752** | 0.0252 | 0.0863** | 0.0339 | |
| 0.20 | 0.0522** | 0.0125 | 0.0590** | 0.0202 | 0.0964** | 0.0150 | 0.1102** | 0.0269 | 0.0956** | 0.0244 | 0.1124** | 0.0297 | 0.0557 | 0.0174 | 0.0619 | 0.0217 | |
| 0.25 | 0.0430** | 0.0097 | 0.0473** | 0.0148 | 0.0738** | 0.0106 | 0.0841** | 0.0170 | 0.0727** | 0.0162 | 0.0841** | 0.0178 | 0.0446 | 0.0130 | 0.0485 | 0.0158 | |
| 0.30 | 0.0370 | 0.0077 | 0.0398 | 0.0114 | 0.0615** | 0.0093 | 0.0691** | 0.0132 | 0.0595** | 0.0122 | 0.0675** | 0.0118 | 0.0373 | 0.0105 | 0.0400 | 0.0124 | |
| 0.35 | 0.0328 | 0.0065 | 0.0349 | 0.0095 | 0.0525** | 0.0078 | 0.0591** | 0.0108 | 0.0510** | 0.0098 | 0.0565** | 0.0090 | 0.0319 | 0.0089 | 0.0340 | 0.0101 | |
| 0.40 | 0.0295 | 0.0057 | 0.0312 | 0.0080 | 0.0460** | 0.0072 | 0.0515** | 0.0092 | 0.0447** | 0.0084 | 0.0492** | 0.0076 | 0.0278 | 0.0079 | 0.0296 | 0.0086 | |
| 0.45 | 0.0269 | 0.0053 | 0.0282 | 0.0069 | 0.0409** | 0.0067 | 0.0461** | 0.0085 | 0.0395** | 0.0070 | 0.0431** | 0.0062 | 0.0246 | 0.0071 | 0.0261 | 0.0074 | |
| 0.50 | 0.0247 | 0.0049 | 0.0258 | 0.0061 | 0.0369** | 0.0060 | 0.0415** | 0.0074 | 0.0356** | 0.0062 | 0.0387** | 0.0053 | 0.0220 | 0.0064 | 0.0233 | 0.0066 | |
** Paired T-test, p-value < 0.05
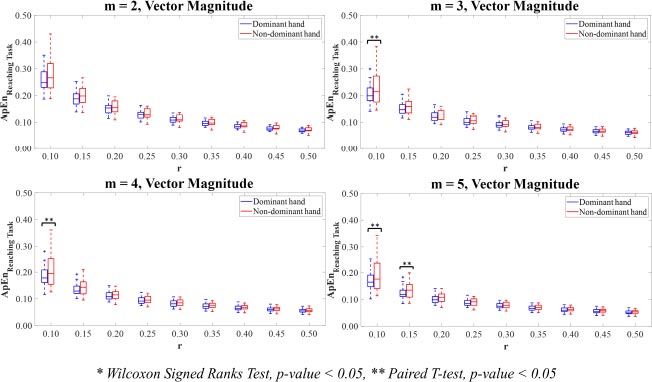
For Vector Magnitude, the motion time-series data of the dominant hand showed lower ApEn values than the non-dominant hand. The statistically significant differences in the ApEn values between the dominant and non-dominant hands were only observed in the combinations of parameter values m=3,4 with r=0.10 and m=5 with r=0.10,0.15 (p<0.05).
3.2. Sample Entropy
The SampEn values of the dominant and non-dominant movements in terms of mean and standard deviation (SD) are shown in Table 2. The SampEn values of the dominant hand movements were entirely lower than those of the non-dominant hand movements. The Paired T-test and Wilcoxon Signed Rank test indicated significant differences (p<0.05) between the SampEn values of the dominant and non-dominant hand movements in all axes.
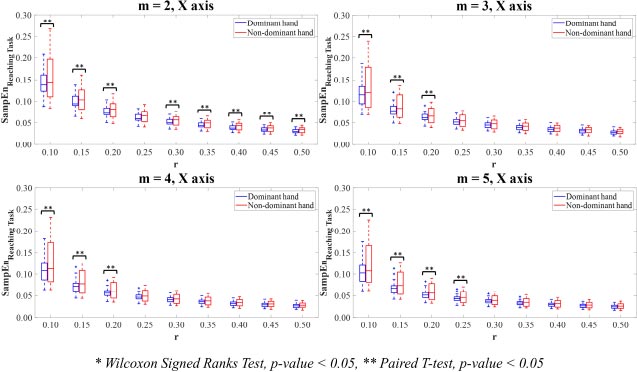
In X-axis (Fig. 6), the SampEn values computing on the combinations of parameter value m=2 with all parameter values r, except r=0.25, in the dominant hand was statistically significantly lower than those in the non-dominant hand (p<0.05). A statistically significant difference was found between the SampEn values of the dominant and non-dominant hands for the combinations of parameter values m=3 with r=0.10,0.15,0.20 (p<0.05). For parameter values m=4,5, the SampEn values of the dominant hand significantly demonstrated lower than the non-dominant hand when combined with parameter values r=0.10,0.15,0.20 and r=0.10,0.15,0.20,0.25 for m=4,5, respectively (p<0.05).
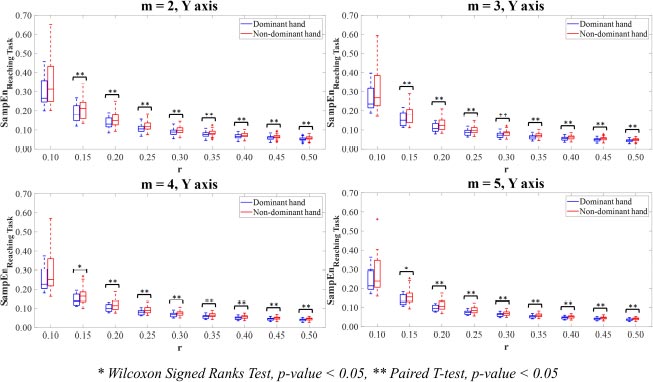
In Y-axis (Fig. 7), all parameter value combinations m and r, excluding the combinations of parameter values m=2,3,4,5 with r=0.10, had significant differences between the hand motion time-series data of the dominant and non-dominant hands (p<0.05).
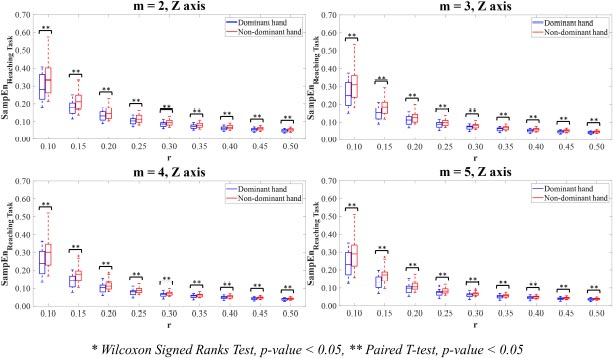
Moreover, the significant differences in the SampEn values between the dominant and non-dominant hands were found on Z-axis for all parameter value combinations m and r (p<0.05) (Fig. 8).
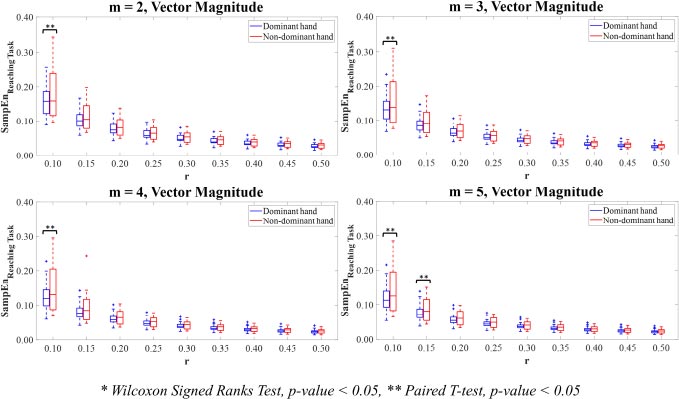
For Vector Magnitude (Fig. 9), there were only significant differences between the SampEn values for the dominant hand compared to the non-dominant hand for the combinations of parameter values m=2,3,4 with r=0.10 and m=5 with r=0.10,0.15 (p<0.05).
4. DISCUSSION AND FURTHER STUDY
The current study aims to assess the differences in the degree of complexity and regularity of hand movements between the dominant and non-dominant hands when performing the reaching task. For this goal, the hand motion time-series data of the reaching task of healthy subjects have been analysed by the ApEn and SampEn, which are widely used to evaluate the degree of complexity of physiological signals in terms of considering the dynamics of point-to-point time-series data [34, 38-40, 43-45, 52, 58-62].
In previous studies, the reaching movements, which have been applied to a wide range of research to explore the difference between dominant and non-dominant movements, were performed in the horizontal plane [13, 19, 63-67]. Although some studies showed that subjects could freely move in all directions, the reaching movements still have a limitation in the vertical plane due to the experiment setup [66]. Compared with previous studies, the current reaching task has advantages over the previous reaching tasks. The current task is designed to encourage subjects to perform hand motions in both horizontal and vertical planes and allow them to move in all directions of three-dimension space without limited movements.
The significant differences in the entropy measures in this study markedly provide useful information regarding lower entropy values, especially the SampEn values, of the dominant hand compared to the non-dominant hand for the reaching task. In other words, it could be indicated that the dominant hand movements are more regular than the non-dominant hand. The dominant hand generally reflects more efficient motor control (greater manual dexterity) than the non-dominant hand [13, 68-72]. The more regularity observed in the dominant hand movements might associate with the effects of the central nervous system (CNS) that controls the ability of intersegmental dynamics and body movements regarding a mechanism of distinct neural control [69, 72]. Moreover, the reason to support the findings of this study could be that most participants in this study are right-handed, and the left-brain hemisphere of a right-handed person plays a greater role in controlling the movements [16, 32]. According to the natural assumption of hemispheric brain asymmetry in motor lateralisation, several studies supported that the dominant hand was generally better than the non-dominant hand in proficiency in performing the tasks [19, 22]. The findings of differences between entropy values of the dominant and non-dominant hands in this study correspond with the results of previous studies that examined the differences between the dominant and non-dominant hands in various features, e.g., muscle torque and electromyography [69], movement path [13, 72], handgrip strength [73, 74].
This study also examines the ability of ApEn and SampEn measures to evaluate the complexity of the motion time-series data. The results show that the ApEn and SampEn are reliable methods for analysing the complexity of the hand motion time-series data and describing the significant difference in the time-series data between the dominant and non-dominant hand movements. From a statistical testing perspective, the dominant hand movements on the X-axis, Y-axis, Z-axis, and Vector Magnitude of the reaching task show generally lower ApEn values than the non-dominant hand movements. Of the SampEn measure, the results highlight that the movements of the dominant hand showed entirely lower complexity than those of the non-dominant hand for all parameter combinations for all axes and Vector Magnitude. Previous studies supported these findings, which found that the SampEn demonstrated high ability and consistency for the complexity measures without crossover issues as an advantage of the SampEn over the ApEn [38, 44, 45, 75, 76]. Compared with other studies, similar behaviour of the ApEn and SampEn values has been observed in this study for all parameter value combinations. For a selected parameter value m, the ApEn and SampEn values tend to decrease as r values increase. Similarly, for a selected parameter value r, the ApEn and SampEn values tend to decrease as m values increase [38, 39].
Additionally, these initial results have proved the importance of chosen parameter value combinations m and r in recognising the significant differences between experimental groups. Based on entropy computations with parameter values m=2,3,4,5 with r values between 0.10-0.50 times SD of the hand motion data, the findings allow the researchers to narrow down the choices of potential values of parameter combinations m and r in case of using the ApEn and SampEn for calculating the complexity of the hand movements. Also, the suggestions from the previous study proposed that the low value of parameter m is recommended, and the parameter value r requires a large number enough to ensure that the amount of sequences of vectors within tolerance r is adequate to estimate the conditional probabilities [45]. From the statistical perspective, the chosen combinations of parameter values m=2,3,4,5 with r=0.15,0.20,0.25 reveal the significant differences between the ApEn values on Y-axis and Z-axis (p<0.05). To reveal the significant differences between the SampEn values on all axes (p<0.05), the chosen parameter value combinations m=2,3,4,5 with r=0.15,0.20 are employed. Noticeably, it could be observed that the SamEn potentially produces more significant differences between the dominant and non-dominant hands than the ApEn for the most axis of reaching movements.
For further studies, researchers who are interested in estimating the complexity levels of motion time-series signals may favour the SampEn measure over the ApEn measure when dealing with the complexity analysis of the physiological time-series data [38, 44, 45, 75, 76]. For the ApEn measure, parameter value combinations m=2,3,4,5 with r=0.15,0.20,0.25 are suggested for analysing the reaching data. Of the SampEn measure, the chosen parameter value combinations m=2,3,4,5 with r=0.15,0.20 are suggested for analysing the reaching data to reveal the movement differences in all axes. Moreover, this study also provides the multi-directional reaching task, which could be a useful and functional diagnosis as well as an assessment tool for further research that would like to study motions in healthy and patient groups.
CONCLUSION
In summary, the current findings suggest that the entropy values of the dominant hand movements are lower than those of the non-dominant hand movements representing less complex and highly predictable dominant hand movements. Furthermore, the ApEn and SampEn measures can estimate the degree of regularity or complexity of the hand motion time-series data for the reaching task and reveal the differences between the dominant and non-dominant hand movements. Interestingly, the relative consistency results and the ability to distinguish the differences between interlimb movements were mostly observed in the SampEn measure, enhancing the advantage of the SampEn over the ApEn when dealing with the hand motion time-series data.
LIST OF ABBREVIATIONS
| ApEn | = Approximate Entropy |
| SampEn | = Sample Entropy |
| SD | = Standard Deviation |
AUTHORS’ CONTRIBUTIONS
- Supervision: Chunhui Li, Zhihong Huang
- Conception and design of the study: Nuttaporn Praditpod, Chunhui Li, Zhihong Huang, Phongpan Tantipoon,
- Methodology: Nuttaporn Praditpod, Chunhui Li, Zhihong Huang, Phongpan Tantipoon
- Data acquisition: Nuttaporn Praditpod, Phongpan Tantipoon
- The conception of statistical analysis: Xinyu Zhang, Petra Rauchhaus
- Data analysis: Nuttaporn Praditpod, Phongpan Tantipoon
- Data interpretation: Nuttaporn Praditpod, Chunhui Li, Phongpan Tantipoon
- The original draft of the manuscript: Nuttaporn Praditpod, Phongpan Tantipoon
- Revising and editing the manuscript: Nuttaporn Praditpod, Chunhui Li, Phongpan Tantipoon
All authors have read and concurred with the content in the final version of the manuscript to be submitted.
ETHICS APPROVAL AND CONSENT TO PARTICIPATE
The ethical approval was proved by the School Research Ethics Committee of the School of Science and Engineering, University of Dundee (UOD-SSFRFC-BE-RPG-2019-006).
HUMAN AND ANIMAL RIGHTS
No animals were used in this research. All procedures performed in studies involving human participants were in accordance with the ethical standards of institutional and/or research committees and with the 1975 Declaration of Helsinki, as revised in 2013.
CONSENT FOR PUBLICATION
Before starting the experiment, the participant information sheet was provided to all participants, and they then signed a consent form. Participants can decide to stop participating in this study at any time without explanation or penalty and do not have to give a reason.
STANDARDS OF REPORTING
STROBE guidelines were followed.
AVAILABILITY OF DATA AND MATERIALS
The data that support the findings of this study are available from the corresponding author, [C.L], only on special request.
FUNDING
This research did not receive any specific grant from funding agencies in the public, commercial, or not-for-profit sectors. NP and PT work at Thammasat University, Thailand. XZ, PR, CL, and ZH work at the University of Dundee, UK.
CONFLICT OF INTEREST
The authors declare no conflict of interest.
Appendix A
The sequences of mimic reaching task in order to touch all seven targets in different directions were as follows:
Starting Place hand with side fist position on a starting point
Step 1 Move hand to the pillar A and fully place hand on the top of pillar, then back to the starting point
Step 2 Move hand to the pillar C and fully place hand on the top of pillar, then back to the starting point
Step 3 Move hand to the pillar F and fully place hand on the top of pillar, then back to the starting point
Step 4 Move hand to the pillar D and fully place hand on the top of pillar, then back to the starting point
Step 5 Move hand to the pillar G and fully place hand on the top of pillar, then back to the starting point
Step 6 Move hand to the pillar E and fully place hand on the top of pillar, then back to the starting point
Step 7 Move hand to the pillar B and fully place hand on the top of pillar, then back to the starting point as the end position
ACKNOWLEDGEMENTS
The authors would like to thank all volunteers for participating in the study. NP and PT are supported by a studentship provided by Royal Thai Government Scholarship and Thammasat University, Thailand. NP is also partially supported by the Funds for Women Graduates Foundation, UK.

