All published articles of this journal are available on ScienceDirect.
Grid Search based Optimum Feature Selection by Tuning hyperparameters for Heart Disease Diagnosis in Machine learning
Abstract
Background:
Heart disease prediction model helps physicians to identify patients who are at high risk of developing heart disease and target prevention strategies accordingly. These models use patient demographics, medical history, lifecycle factors, and clinical measurements to calculate the risk of heart disease within a certain time frame. In identifying important features of heart disease, a popular approach is using Machine learning (ML) models. ML models can analyse a large amount of data and find patterns that are difficult for humans to detect.
Methods:
In this proposed work, Random Forest classifier is used to identify the most important features that contribute to heart disease and increase the prediction accuracy of the model by tuning the hyperparameters using grid search approach.
Results:
The proposed system was evaluated and compared in terms of accuracy, error rate and recall with the traditional system. As the traditional system achieved accuracies between 81.97% and 90.16%., the proposed hyperparameter tuning model achieved accuracies in the range increased between 84.22% and 96.53%.
Conclusion:
These evaluations demonstrated that the proposed prediction approach is capable of achieving more accurate results compared with the traditional approach in predicting heart disease by finding optimum features.
1. INTRODUCTION
In recent years, data science has contributed a significant role in the healthcare industry by providing better Machine learning tools for predicting chronic diseases. Heart disease is one of the common ailments suffered by ordinary people [1]. According to the World health organization, the mortality rate of heart disease patients is nearly 17.9 million every year, which is a leading death rate worldwide [2]. For diagnosing and building better clinical decision support, ML models can be deployed to mitigate the disease by understanding the symptoms of heart disease based on the relevant feature sets [3]. Machine learning has emerged with practical techniques to make predictions from a large pool of data. Its analytical tool gives a solution when predicting complex diseases like knowledge transformation of medical records, cardiac diseases, and gene data analysis [4-6]. Machine Learning (ML) comprises learning algorithms explored on the existing data to discover the hidden pattern, and the rules of learning models used to predict the occurrence and non-occurrence of the target data, particularly in the research area [7]. This ML algorithm works with noisy data as well. ML model ranks different features depending upon their relevance to the paradigm and assign some weights during the learning process [8-12]. Predominantly ML harnesses both supervised and unsupervised learning methods. The former learning technique produces the best relationship and dependencies between the prediction output and the trained set's input features.
Thus producing predicted output for the new dataset. Though many ML models have been explored [13, 14] and are perhaps successful in their analysis, predicting heart disease emerges as a significant paradigm that needs improved models and methods. This prediction comes under supervised learning using classification techniques to learn the relationship and dependency amidst features and the target class [14-19]. In machine learning, hyperparameter tuning is proclaimed to train the model. The problem dwells in choosing the optimal hyperparameters. In this concern, Random Forest plays a significant role in predicting the target values. RF is an ensemble model constructed from a set of independent and distinct decision trees based on the randomization technique using a random vector parameter that selects the features randomly in the training set [20-22]. Generally, the feature selection technique handles high dimensional dataset [23] that requires huge memory leading to an overfitting problem. Weighted features can be selected to improve model performance and reduce processing time [24-31]. Thus selecting a small number of relevant features reduces the dimension of the data set using feature selection [32] and extraction by transforming and removing unwanted data using Grid optimization methods.
In the proposed model, the motivation of this work is to identify the essential features by tuning the hyperparameters during feature selection and improving the performance of the classifiers deploying grid search methods. Optimal parameters are chosen during the tuning process and thus predicting heart disease.
The contribution of the proposed work is listed below:
- Three grid search methods, such as best-random, first grid, and second, are constructed in the initial phase.
- In the second phase, the hyperparameter tuning process is carried out with Grid search and random search models by fixing the baseline parameters.
- In the third phase, the feature extraction and feature selection process with the cross-validation method is implemented.
- After selecting optimal parameters, the best model is determined by validating with parameters such as runtime, mean error, and accuracy.
- In the final phase, the classification accuracy of the RF model is enhanced with the best grid model.
2. LITERATURE SURVEY
The authors proposed deep learning methods, Logistic regression, SVM and RF models. They explored the heart disease data by tuning the hyperparameter with relevant feature selection and producing more than 78% accuracy [33].
They have proposed generalized discriminant analysis (GDA) to classify 15 features with an HRV signal. The features have been reduced to 5 sets using the GDA model and produced a 100% precision result with an SVM classifier [34].
An effective technique to speed up the performance of the model by hyperparameter tuning using Grid search implemented on text data with a kNN algorithm. The model is tuned with three parameters using BM25 similarity [35].
Authors implemented the Naïve Bayes algorithm to predict heart disease patients and proposed a novel Heart Disease Prediction System (HDPS) system [36-38]. The author has examined specific parameters and predicted Heart disease by deploying a K-mean clustering algorithm [39].
Bayesian hyperparameter optimization algorithm was proposed to improve the model [40]. This Bayesian model is used for hyperparameter tuning that obtains optimized values with less consumption time and performance improvement, thus achieving global optimization.
Authors proposed Enhanced Bat Optimization (EBO) algorithm to select appropriate features from the gene dataset. A subset of significant genes is selected using the bat algorithm associated with Hilbert Schmidt Independence Criterion (HSIC) measure [41].
The authors proposed a system by tuning the hyperparameters to predict heart disease [42]. The performance of the model was enhanced using the grid search approach with five Logistic regression, K-Nearest Neighbor, support vector machine, decision tree, and random forest. The metrics used to evaluate the performance of the algorithms were precision, recall and F1_Score [43-49].
A framework was designed with five algorithms: RF, Naïve Bayes, SVM, Hoeffding DT, and Logistic Model Tree. The heart disease classification was carried out by selecting the best features from the dataset by obtaining 81.24% accuracy [50].
Authors devised a prediction model with a finely tuned technique that identified the key features. A classification model was constructed using RF, SVM and DT models that produced higher predictive accuracy [51].
Researchers proposed a deep learning model using Neural Network (NN) for classifying electrocardiogram(ECG) signals for selecting the relevant set of features and enhancing the performance of the classifier [52].
A clinical decision support system (CDSS) was proposed to analyze heart failure. The author implemented machine learning algorithms like neural network (NN), support vector machine (SVM), classification, and regression. (CART) with fuzzy rules and random forests (RF) and the CART model and RF produced 87.6% accuracy [53].
Authors deployed the SVM model for diagnosing heart disease patients with diabetes. The author obtained 94.60% accuracy by predicting the significant features considering age, blood pressure and sugar [54].
They proposed a cardiovascular feature reduction process by implementing the Fisher ranking method, discriminant analysis (DA), and binary classification with extreme learning method (EML). The model obtained an accuracy of 100% in detecting heart disease [55].
An automatic classification in analyzing cardiac arrhythmia with linear and non-linear with dimensional reduction models under unsupervised learning using a neural network (NN) classifier was carried out and achieved 99.83% of F1-score using fast ICA algorithm with only 10 components [56].
Researchers have made a complete analysis of different feature selection techniques. Various functional issues of feature selection algorithms have been in terms of dimensionality reduction and classification accuracy [57-63]. They demonstrated a new perspective feature selection process from the adaptable reconstruction graph and feature subset [64-69]. Authors minimize the tuning issues of several optimization methods in feature selection-based data analysis by selecting features from Binary Teaching and Learning Optimization technique (BTLO) [70-76] where the size and number of subsets generated are the control variables. They found that the loss of data occurred in a conventional SVM method where feature extraction and parameter tuning were done independently [77]. In order to overcome this, a convex energy dependent system is proposed where the feature selection and parameter tuning are integrated [78].
Authors have initiated an unsupervised feature selection framework for social media data [79]. In this paper, under the unsupervised case, the problems of feature selection in social media data are investigated.
The proposed method increases the model performance by implementing a grid optimization model in a random search using a cross-validation technique. Section 2 elucidates the proposed methodology with three models: best-random using cv method, First-grid with cv and Second-grid. Section 3 exemplifies the results and discussion phase, and section 4 summarizes the proposed method.
3. PROPOSED METHODOLOGY
The proposed work is organized with three models for optimal feature selection in predicting heart disease. Feature selection plays a significant role in predicting the disease. The factors that increase the risk of heart disease include triglyceride, high cholesterol [80-83], and American Heart Association [84] indicates that body mass index (BMI), leg swelling, chronic cough and high blood pressure [85]. Feature extraction is carried out by tuning the parameters using the Grid search algorithm to select optimum attributes. The scheduled model is explored on the heart disease dataset (Cleveland dataset) collected from the UCI machine learning repository. The dataset consists of 14 features with 303 instances where 300 instances are taken for analysis. The characteristic features, along with their description and range of values, are outlined in Table 1.
| Features | Description | Ranges |
|---|---|---|
| Age | Age (in years) | 30–92 |
| Sex | Gender | 1: male; 0: female |
| BMI | Body mass index | 15.302–41.304 |
| Cholesterol | Blood Cholesterol level | 79–525 |
| HDL | High-Density Lipoprotein | 22–118 |
| SBP | Systolic blood Pressure | 75–219 |
| DBP | Diastolic blood Pressure | 10–137 |
| Triglyceride | Teen’s body fat | 20–1868 |
| Haemoglobin | Haemoglobin | 7–19 |
| TD | Thyroid disease | Categorical – yes, no |
| CRF | chronic renal failure | Categorical – yes, no |
| Cirrhosis | Cirrhosis | Categorical – yes, no |
| Smoking | Smoking habit | Categorical – yes, no |
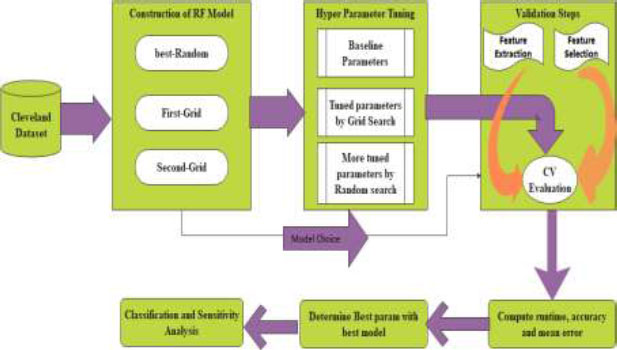
The relevant (important features) from the dataset are extracted during the grid search, and the model is trained using hyperparameters to perceive the optimal model. The schemed model contemplates recall measure, and the model is trained to reduce the false-negative rate during classification using the Random Forest. The method is designed with three phases. 1. Construction of RF Model 2. Hyperparameter Tuning 3. Validation phase. The architecture of the prompted framework is delineated in Fig. (1). Three models are validated with cross-validation to extenuate the overfitting paradigm. The average accuracy, average error, runtime, validation score, and train time are computed for all three models for determining the best parameters from the best model to increase the recall ratio during classification.
3.1. Construction of RF Model
Random Forest (RF) is an ensemble learning model for classification and regression constructed using multiple decision trees. Bootstrap is employed to maximize the diversity of each tree. In RF, each decision tree is trained. Let the training set is taken as Td = {(x1, y1), (x2, y2) …. (xn,yn)}. Td is the training data for each decision tree Dt and let E(x) represents the estimation result on sample x then,
 |
(1) |
Each node in the bootstrap tests the particular features, and finally, the leaf node represents the output. The aggregated results of all bootstrap sets are expressed as:
 |
(2) |
Where Z is the average output of n trees,
 |
(3) |
Where
3.2. Hyperparameter Tuning
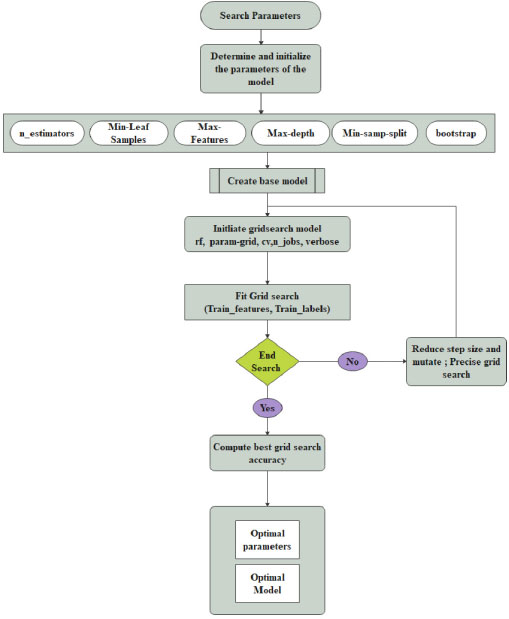
In the proposed work, a hyperparameter is used to set before training the model. For Random Forest classification, four parameters such as the number of trees, depth of the tree, a minimum number of samples and the minimum number of samples present at leaf node shown in Fig. (3). These parameters are adjusted to determine which features to modify or retain from the dataset and those features are extracted after tuning. Initially, baseline parameters are set as default values. In the grid search model, the number of trees is 10 with 10 levels. 2 to 10 data samples are considered for splitting a node. Then the random grid is created using 5 fold cross-validation with 100 different combinations. For more tuning, a second-round random search is established for moderating the number of features by tuning the hyperparameters. Parameter selection, splitting the trees and selecting the samples for training the tree are described in the Grid Search Algorithm. In the RF classifier, parameter tuning is an essential factor for improving model performance. In the suggested method, six parameters such as n_estimators, Min-Leaf samples, Max-features, Max-depth, min-samp-split and bootstrap. Initially, the value n_estimators is set as 10. Min-Leaf samples portray the minimum number of samples at the end of the search. Its values are fixed as 1. A third and fourth hyperparameter is exploited to solve the overfitting of the training data. The tree min-samp-split parameter is tuned to regularize it. The last parameter, bootstrap, is set as the default value.
3.3. Validation Steps
All three models are evaluated using average accuracy and average errors, along with performance and compared to determine the best model's best parameters [86-92]. Generally, a random search narrows down the parameter ranges. Instead of sampling randomly, all the combinations of the parameters can be evaluated to determine the best parameters provided by the random search. If the performance decreases, then the hyper meter tuning is formulated. Features are selected corresponding to the hyperparameter tuning. Moreover, the feature importance is evaluated for obtaining model accuracy. In the proposed model, 7 features are deliberated to speed up the accuracy of the model. The steps of the Grid Search Algorithm are as follows:

3.4. Algorithm for Grid Search
Step 1: Initialize the params; n_estimators, M_features, M_depth, m_samsplit, m_samleaf, bootstrap
Step 2: Create a Parameter Grid
Step 3: Create a Base model (default model)
Step 4: Initiate Grid search model with params (rf, param-grid, cv, n_jobs, verbose)
Step 5: Find Grid Search with train_features, train_labels
Step 6: Compute the best grid.
Step 7: Print best param.
After evaluating the model, the data samples are examined for predicting the true positive (TPv), true negative (TNv), false positive (FPv) and False-negative (FNv). The propounded model addresses the Recall measure where the True positive rate is increased by reducing the false negatives. A recall is calculated as:
 |
(4) |
Among the three models, the second grid model produces higher accuracy with a minimum error rate when compared to the other two models and produces higher recall results with the Random Forest classifier. The comparison of the Random classifier before and after grid search is obtained in Table 2. The heart disease dataset with 300 instances, correctly and incorrectly classified, is portrayed in the table, showing that grid optimization enhances RF classifier performance.
Among 300 instances, it is explicitly shown that 291 instances are correctly classified. The number of incorrect classifications is reduced after the grid search optimization by tuning n_estimators and min-samp-split, revealing that the Grid search model improves the performance of the RF classifier.
4. RESULTS AND EXPERIMENTS
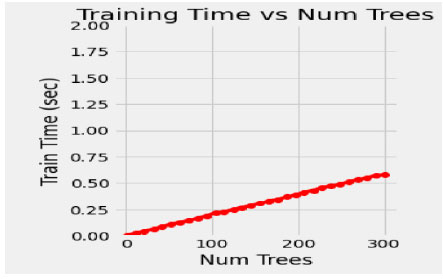
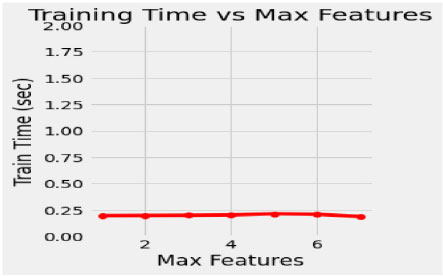
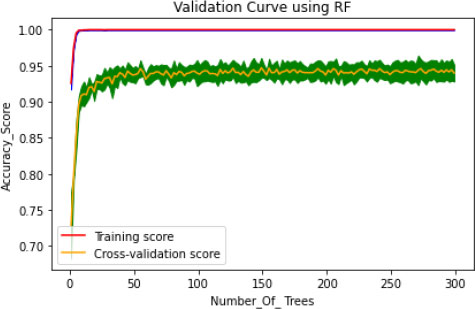
In the proposed model, the initial tree is set as 10, considering the performance of the model and its execution cost. 50 intervals increase the number of trees to speed up the performance of the model, such as 50, 100, 150, 200, 250 and 300. The train time varies for each set of trees, and it dramatically increases for every additional 50 number trees shown in Fig. (4). Simultaneously, the train time remains constant during the extraction of maximum features (Fig. 5). In this concern, it is essential to check for optimization values of the corresponding hyperparameters with a validation curve. Table 3 depicts the train time, validation score and training score for the number of trees. The validation scorestreaks at n=10 and starts fluctuating throughout the decision tree's entire traverse and explicate minimum variation from the training score. The hyperparameters such as n-estimators and min-samples –split are tuned to improve the performance of the Random Forest.
| No. of Instances | Before Grid Search | After Grid Search | ||
|---|---|---|---|---|
| Correctly Classified | Incorrectly Classified | Correctly Classified | Incorrectly Classified | |
| 300 | 252 | 48 | 291 | 9 |
| No. of Trees | Train Time(Secs) | Validation-Score | Train-score |
|---|---|---|---|
| 100 | 0.25 | 0.94 | 0.99 |
| 150 | 0.39 | 0.93 | 0.99 |
| 200 | 0.45 | 0.94 | 0.99 |
| 250 | 0.52 | 0.93 | 0.99 |
| 300 | 0.65 | 0.94 | 0.99 |
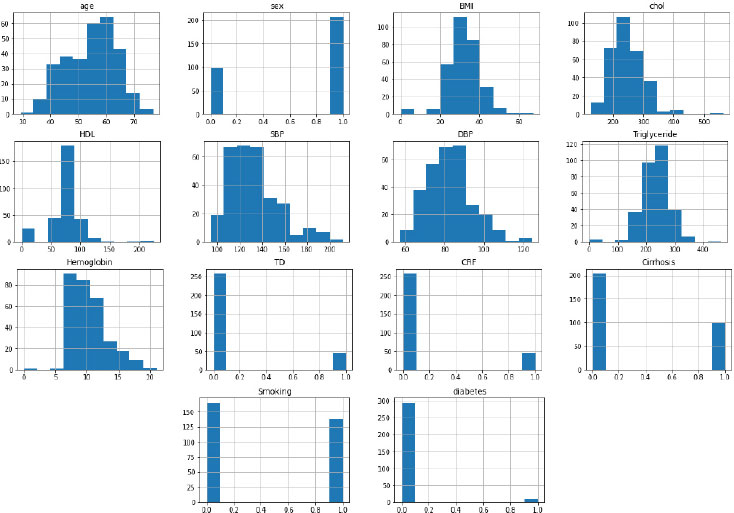
Generally, the model is optimized on training data to produce a better score, but on the other hand, if the model performs very well on the training set, it might provide poor results on a test set in some cases. This kind of overfitting paradigm can be solved by the cross-validation method. The hyperparameter optimization works well for overfitting only through the cv technique. Initially, the model fits k=5, training the four folds and finally evaluating the fifth fold. The model is trained on 1,2, 3 and 5th fold during the second turn, evaluating the fourth fold. This process is repeated 5 times, evaluating the new fold. At the end of every fold, the average performance is evaluated. The number of trees is trained in the proposed model, and accuracy of the cv score is probably nearer to the training score (Fig. 6). This validation is pursued to reduce the overfitting problem on the test data. The histogram plot of 14 attributes concerning the range values is presented in Fig. (7). To select the relevant features showing high correlation are selected and extracted using the grid search model. Thus seven features are chosen as essential features that increase the hyperparameters, such as n-estimators and min-samp-split. These features satisfy the classification performance in increasing the right positive rate.
Table 4 shows the performance measure of optimization models concerning the number of features extracted and several trees taken for the grid search method. The table shows the three models explored on data samples with 7 essential features for the optimization method. The first two models are carried with cross-validation and the second grid without cross-validation produces good results compared to the other two models.
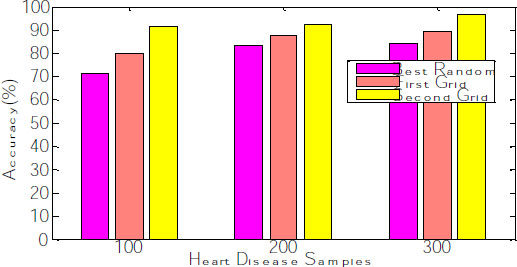
The corresponding graph concerning the accuracy, error rate and recall is shown in Fig. (8), exhibiting that the second grid model produces 91.34, 92.11 and 96.53 for 100, 200 and 300 samples. The other two models, such as best-random and First-grid, produce an average of 78% and 89%, which is less when compared to the third model.
| Optimization Models | No. of Features | No. of Trees | Accuracy | Error Rate | Recall |
|---|---|---|---|---|---|
| Best-random | 7 | 100 | 71.05 | 74.59 | 72.43 |
| 200 | 80.09 | 64.59 | 85.22 | ||
| 300 | 84.22 | 55.45 | 86.45 | ||
| First-grid | 7 | 100 | 90.03 | 70.19 | 80.98 |
| 200 | 87.59 | 62.43 | 90.26 | ||
| 300 | 89.44 | 53.32 | 92.17 | ||
| Second-grid | 7 | 100 | 91.34 | 65.45 | 92.12 |
| 200 | 92.11 | 60.44 | 95.25 | ||
| 300 | 96.53 | 52.17 | 97.01 |
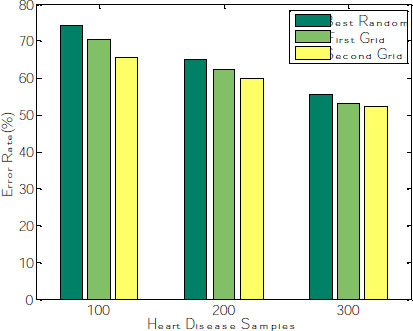
After fitting the random model with 5 fold cross-validation by setting the random search, the parameters random grid, number of iterations= 100; cv= 5, verbose =2, random state= 42, the model need to be evaluated. Generally, the number of iterations needs to be reduced, leading to the over-fitting problem. Hyperparameter tuning is done on n_estimators and splitting the nodes at leaf level during the random search to alleviate this overfitting. The cross-validation curve can determine this. The mean absolute error (MAE) and Root means squared error(RMSE) decrease gradually when the number of trees is increased. The average error rate is evaluated and shown in Fig. (9). The graph explains that the Error rate is also reduced for the second grid compared with the other two models.
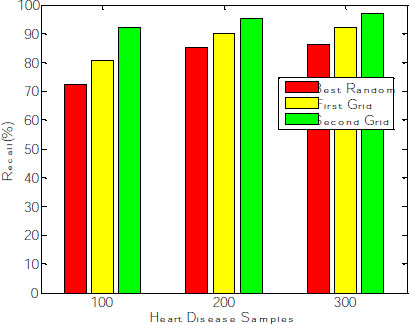
The proposed work contemplates increasing the positive rate and reducing the false-negative rate to identify patients with the disease for further treatment. Among 300 observations, 291 instances are correctly classified, wherein the recall rate of the proposed model increases concerning several samples. The best Random model produces an average recall rate of 81%. First-grid produces 87%, and Second Grid produces 95% of the sensitivity rate (Fig. 10), proving that the Random Forest classifier produces enhanced results after the Grid search optimization method deployed for feature extraction. The time complexity of the proposed model with Random Forest classifier is O(n*log(n)*d*k), where k=number of Decision Trees, n= number of training examples and d= number of dimensions of the data.
CONCLUSION
In this research, feature selection and feature extraction methods are based on the grid search optimization method. This method is used to select the feature, and the model is created and fit by tuning hyperparameters corresponding to the features and samples. The proposed model is designed by integrating the Random Forest (RF) classifier to determine relevant features. Grid Search Optimization (GSO) is applied to the heart disease dataset to predict disease, and the model is trained to increase the correct positive rate, thereby reducing the false negative. It increases the sensitivity measure of the Random Forest (RF) classifier. This grid search is integrated cross-validation to solve the over-fitting problem of the model. The proposed model selects essential features, and the model is trained on those features; thus, the dimensionality of samples is reduced to some extent.
Meanwhile, it increases the prediction accuracy of the RF model. Generally, random forest produces better accuracy in tuning the hyperparameter. The n-estimators and minimum split at the nodes are the two parameters tuned to enhance the performance of the model, which in turn increases RF classifier performance. When the model produces low accuracy, the model is created with another set of features. These combinations take some computational time to create another new model, which remains a challenge in the present work.
ETHICS APPROVAL AND CONSENT TO PARTICIPATE
Not applicable.
HUMAN AND ANIMAL RIGHTS
No animals/humans were used for studies that are the basis of this research.
CONSENT FOR PUBLICATION
Not applicable.
AVAILABILITY OF DATA AND MATERIALS
The heart disease dataset (Cleveland dataset) was collected from the UCI machine learning repository. The dataset consists of 14 features with 303 instances where 300 instances are taken for analysis.
FUNDING
None.
CONFLICT OF INTEREST
The authors declare no conflicts of interest, financial or otherwise.
ACKNOWLEDGEMENTS
Declared none.

