Comparison of Biomechanical Parameters between Medial and Lateral Compartments of Human Knee Joints
Abstract
Background:
The knowledge of biomechanics helps in predicting stresses in different parts of the knee joint during daily activities.
Objective:
The objective of this study is to evaluate the biomechanical parameters of the knee joint, such as contact pressure, contact area, and maximum compressive stress, at full extension position during the gait cycle.
Methods:
The three-dimensional finite element models of human knee joints are developed from magnetic resonance images (MRI) of multiple healthy subjects. The knee joints are subjected to an axial compressive force of 1150 N at full extension position.
Results:
The maximum compressive stresses on the medial and lateral tibial cartilages were 2.98±0.51 MPa and 2.57±0.53 MPa, respectively. The maximum compressive stresses on the medial and lateral menisci were 2.81±0.92 MPa and 2.52±0.97 MPa, respectively. The contact area estimated on medial and lateral tibial cartilages were 701±89 mm2 and 617±63 mm2, respectively.
Conclusion:
The results were validated using experimental and numerical results from literature and were found to be in good agreement. The magnitude of maximum compressive stress and the contact pressure was found to be higher at the medial portion of the cartilages as compared to that in the lateral portion of the cartilages. This study shows that the medial meniscus is more prone to tear under severe loading conditions, as the stresses in the medial meniscus are higher than that in the lateral meniscus. The total contact area in the medial tibial cartilage is larger than that in the lateral tibial cartilage.
1. INTRODUCTION
The knee joint is the largest synovial joint in the human body and is subjected to high loads [1]. Accordingly, it is one of the most injured parts of the human body and is highly susceptible to osteoarthritis. It is characterized by a complex 3D geometry and multibody articulations that give rise to complex biomechanical behavior during physiological activities [2]. A proper understanding of the biomechanics enables the clinicians to treat knee joint injuries and design implants or prostheses. The knowledge of the biomechanical response of the knee joint is essential for improving diagnostics, treatment, and surgical planning.
Axisymmetric models have been developed by different researchers to determine the biomechanical response of the knee joint under physiological loads [3, 4]. However, it could not predict the non-uniform 3D stresses induced in the different parts of the tibiofemoral joint. Also, the tibiofemoral joint is not symmetrical from the anatomical perspective. With the advancement in the area of finite element analysis, 3D finite element (FE) models have offered a better representation of stress distribution in the different parts of the knee joint. Bendjaballah et al. [2] developed a 3D non-linear FE model of the knee joint to examine its biomechanics at zero degree flexion. It was observed that the larger portion of the load was taken up by the uncovered cartilage as compared with the menisci. The ligaments were represented by one-dimensional truss elements. Some authors [5-7] have constructed 3D FE models of the human knee joint to evaluate its biomechanical parameters. However, these models have represented the ligaments by springs instead of considering their actual geometry. Donahue and Hull [5] constructed an FE model of soft tissues to study the contact behavior of the knee joint. It was proved that the assumption of rigid material behavior for bones had a negligible effect on the contact parameters of the knee joint. Zielinska and Donahue [7] developed a 3D FE model of the knee joint to determine the area of contact and pressure distribution under a vertical compressive load. Yang et al. [6] developed a 3D FE model of the knee joint to determine the influence of tibiofemoral alignment on its stress distribution. It was observed that there was a considerable increase in the maximum normal stress in the cartilage of the femur after the application of varus moment.
A few researchers have constructed a complete 3D FE model of the knee joint to determine its biomechanical behavior under physiological load. Peña et al. [8] constructed a 3D FE model of the knee joint to determine the contact area and pressure distributions between cartilages and menisci and the stress distribution in the menisci and cartilages under a vertical compressive load. It was observed that the peak contact pressure was located in the posterior section of the medial meniscus. Dong et al. [9] created a 3D FE model of the knee joint to determine the distribution of maximum compressive stresses on the articular cartilages and menisci. It was observed that the maximum compressive stress occurred in the anterior section of the lateral meniscus and posterior section of the medial meniscus. It was also found that the maximum compressive stress was located at the posterior portions of the medial femoral and tibial cartilages. Most of the reported studies have considered a single subject while investigating the biomechanical response of the knee joint.
Most of the reported studies have one or more of the following limitations. The material behavior of the meniscus and cartilage were considered as linear elastic and isotropic. The actual geometry of the ligaments was not considered. From the reported studies, it was found that only a single subject was considered to determine the biomechanical parameters of the knee joint. Multiple subjects were not taken into account while reporting the results of the FE analysis. The reason may be the significant amount of time required to develop the FE model of the knee joint. This study presents 3D FE models of the knee joints of multiple subjects, considering the actual geometry of the ligaments. The reason for considering multiple subjects in this study is to make the results of the analysis statistically significant. The 3D FE model of the knee joint consists of bones, menisci, cartilages, ligaments and tendons. The focus was on the menisci and cartilages since these parts are subjected to significant stresses during different activities of the knee joint. The main objective of this study is to determine the biomechanical parameters such as contact pressure, contact area, and maximum compressive stress in the cartilages and menisci of the knee joints belonging to multiple subjects.
2. MATERIALS AND METHODS
2.1. Data Acquisition and 3D Knee Model
The number of healthy subjects considered in the present study was based on the equation representing the sample size for repeated measures ANOVA [10].
 |
(1) |
Where, n = minimum sample size required
Z(1-α/2) = 1.96 at α = 0.05 for 95% confidence interval (95% CI), Z(1-β)=0.84 at 80 % power
σ = standard deviation = 1.04 [11], m = number of measurements = 4,
ρ = Intraclass Correlation=0.4 and d = clinically significant difference=1.17 [9].
Substituting the values in Eq. (1), it was found that the number of healthy subjects required for the study was four. The details of the subjects taken up in the present study are shown in Table 1. The age and gender of the subjects were according to the availability of MRI for research at the clinical repository.
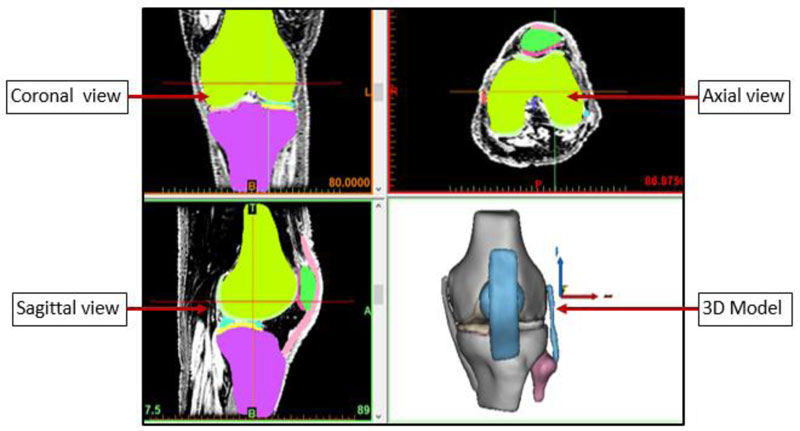
The MRI of knee joints of four male subjects corresponding to the full extension position were collected from the hospital repository (Department of Radio Diagnosis and Imaging) as per the principles of retrospective study for which the approval (IEC Project No. IEC 170/2014) from the institutional ethical committee of Kasturba Medical College (Kasturba Hospital) was obtained. The contours of bones (femur, tibia, patella, and fibula), cartilages (femoral cartilage, tibial cartilage, and patellar cartilage), menisci (medial meniscus and lateral meniscus), ligaments (anterior cruciate ligament, posterior cruciate ligament, medial collateral ligament, and lateral collateral ligament), and quadriceps tendon were manually extracted using Mimics Research V19.0 (Materialise, Belgium). Fig. (1) depicts the contour segmentation process of different parts of the knee joint. The anatomical correctness of the models was ensured by referring to the anatomy textbook [12].
The 3D models were then individually exported in .stp format to HYPERMESH 2017 (Altair Engineering Inc., USA). The models were meshed with quadratic tetrahedral elements (C3D10 elements) in Hypermesh software. The volumetric meshes of all the parts were exported to ABAQUS 2017 (Dassault Systemes Simulia Corp., USA) in .inp format. A similar procedure was adopted for the 3D modeling and meshing of different parts of the remaining three knee joints.
| Subject | Age | Gender |
|---|---|---|
| 1 | 21 yrs | Male |
| 2 | 25 yrs | Male |
| 3 | 46 yrs | Male |
| 4 | 50 yrs | Male |
2.2. Material Models
The bones were assumed rigid because of their high stiffness as compared to that of the soft tissues [5]. In general, articular cartilages, menisci, and ligaments are anisotropic and viscoelastic in nature. Taking into account the loading time of the knee joint corresponding to the single-leg stance and since it is very less when compared to the viscoelastic time constant, which approaches 1500 s [13], articular cartilage was considered linearly elastic and isotropic. There is no considerable change in their response in a short time after loading [14]. The menisci were considered linearly elastic and transversely isotropic. The material properties of cartilages and menisci are represented in Table 2.
E1 and E3 denote Young's modulus in radial and axial directions, respectively and E2 denotes Young's modulus in a circumferential direction. G12, G23 and γ12, γ23 denote in- plane shear modulus and poisson ratio, respectively. G13 and γ13 denote out-of-plane shear modulus and Poisson's ratio, respectively.
The ligaments were assumed to be isotropic and hyperelastic, represented by an incompressible Neo–Hookean behavior [8] with the strain energy density function:
 |
(2) |
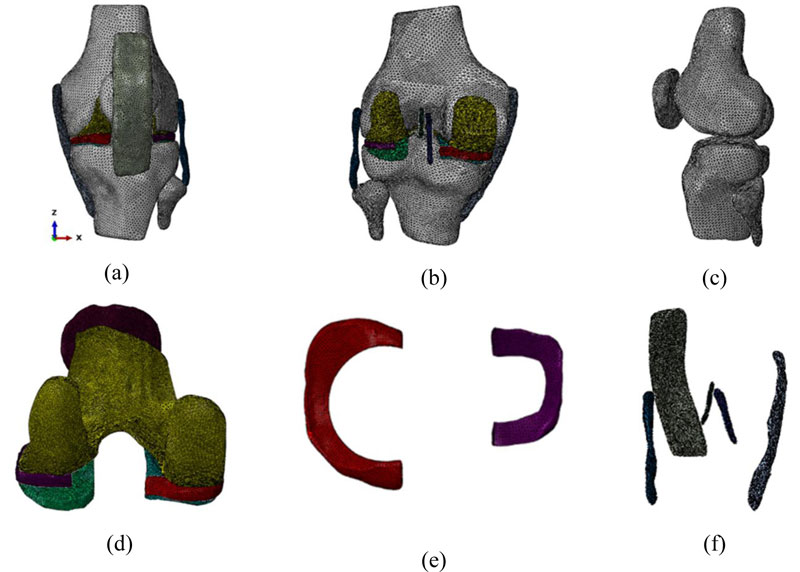
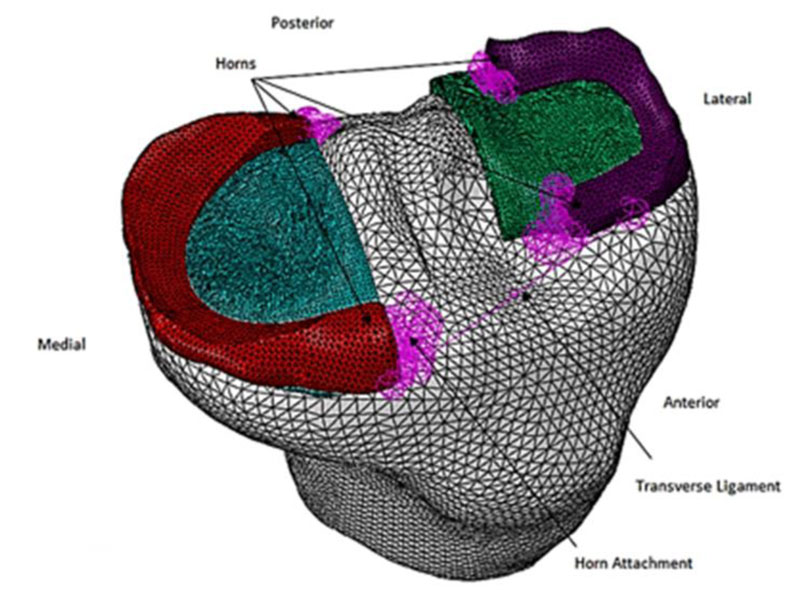
Where, C1 is the initial shear modulus and  is the first modified invariant of the right Cauchy–Green strain tensor. The Neo–Hookean parameter C1 was adopted with values of 6.06, 5.83, 6.43, 6.06, and 6.06 MPa for the posterior cruciate ligament (PCL), anterior cruciate ligament (ACL), medial collateral ligament (MCL), lateral collateral ligament (LCL), and patellar tendon (PT), respectively [18]. Fig. (2) shows the FE model of the knee joint. The horn attachments connecting anterior and posterior horns of the menisci to the tibial plateau were represented by a set of springs. At each horn attachment, ten springs with a stiffness of 200 N/mm each were used to connect the horn to the tibia plateau, which resulted in a total stiffness of 2000 N/mm for each attachment [5]. A transverse ligament connecting the anterior horns of medial and lateral menisci was modeled as a spring and represented by SPRINGA element (ABAQUS element library) with a stiffness of 900 N/mm. Fig. (3) shows the horn attachments and the transverse ligament represented by SPRINGA elements.
2.3. Contact Interactions, Loads and Boundary Conditions
Cartilage is an elastic tissue that covers the ends of the bones, with no relative motion between cartilage and bone. A ligament connects two bones and the medial meniscus is connected to the medial collateral ligament. These connections were represented by the ‘tie constraint’ feature available in ABAQUS for the purpose. The ‘Tie constraint’ does not allow sliding or separation between the surfaces. Hence, it was used between bone and cartilage, bone and ligament, and between the medial meniscus and medial collateral ligament. The presence of synovial fluid in the joint makes the friction negligible at the femoral–tibial cartilage, cartilage-meniscus, and femoral–patellar cartilage interfaces. Therefore, the ‘Frictionless contact’ (non-linear) feature of the software was used in modeling these interfaces.
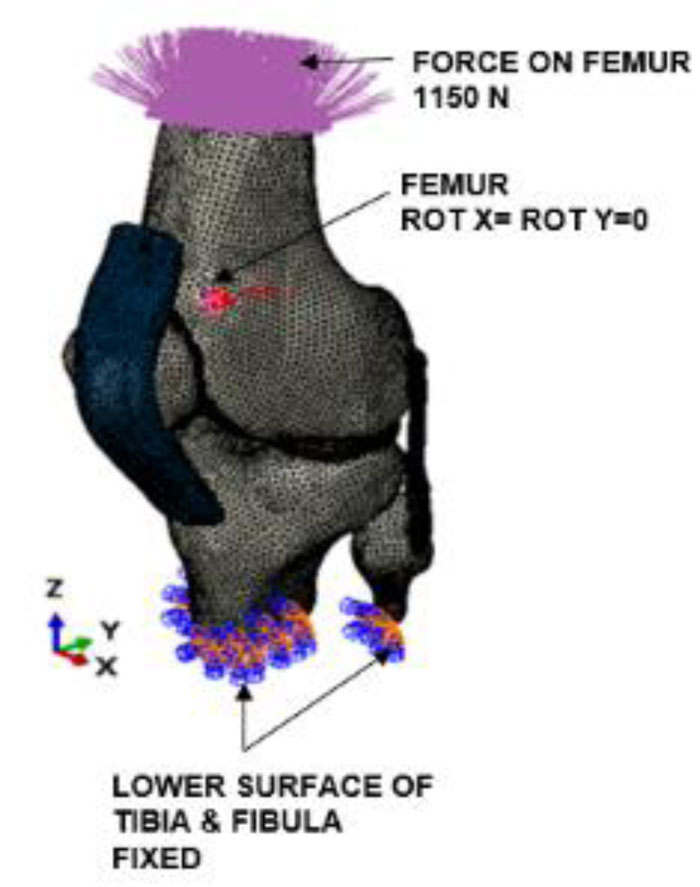
Flexion-extension (Rotation about X-axis in the model) and varus-valgus rotations (Rotation about Y-axis in the model) were constrained for the femur so that the knee joint can be analyzed under full extension position. The above constraint was applied to the reference point that is created such that it coincides with the location of the center of gravity of the femur. The lower surfaces of the tibia and fibula were fixed. A vertical compressive force of 1150 N, which is the force of the gait cycle for full extension position, was applied on the top surface of the femur [19]. Fig. (4) shows the FE model of the knee joint with boundary conditions. The FE analysis of the knee joint was carried out with the boundary conditions described earlier.
2.4. Mesh Convergence Study
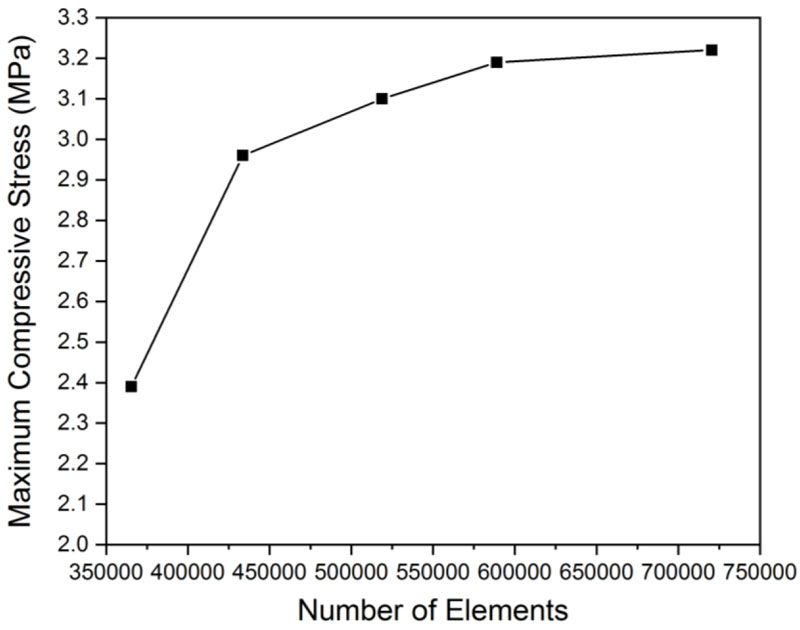
FE analysis was performed to determine the maximum compressive stresses in the knee joint. Mesh convergence study (Grid independence test) was undertaken to determine the appropriate number and size of the elements required in a model to ensure that the results of an analysis are independent of these factors. It is known that increasing the number of elements to discretize the system would ensure a more accurate solution. Therefore, the analysis was done for the different numbers of elements and their results were compared with one another. Fig. (5) depicts the results of the mesh convergence study performed on the medial meniscus of the knee joint (Subject 3). It could be observed that the increase in maximum compressive stress, when the number of elements was changed from 5,89,073 to 7,20,447 elements, was negligibly small (1.3%) when compared with the same observed when the number of elements was changed from 3,65,289 to 4,33,589 elements (25.6%), 4,33,589 to 5,18,702 elements (5.4%), and 5,18,702 to 5,89,073 elements (3.73%) in sequence. Hence, it could be concluded that mesh convergence is achieved. The optimum number of elements obtained by the mesh convergence study (5,89,073 elements) could be adopted for the FE analysis of all the subjects.
3. RESULTS
The compressive stress, contact pressure, and contact area on cartilages and menisci were considered for assessing the response of the joint for the applied load and specified boundary conditions. The maximum compressive stresses in the femoral cartilage, menisci, and tibial cartilages were determined for subjects 1, 2, 3, and 4.
Fig. (6) depicts the distribution of maximum compressive stress (minimum principal stress) (σ3) in the menisci, femoral and tibial cartilages for subject 1. The stress (maximum compressive stress) of 2.52 MPa was located on the medial portion of femoral cartilage (FC). The stress of 2.45 MPa was higher on medial tibial cartilage (MTC) as compared to lateral tibial cartilage (LTC) with 2.25 MPa. The stress of 1.66 MPa was higher on the medial meniscus (MM) as compared to the lateral meniscus (LM) with 1.47 MPa. The stresses in the menisci, femoral and tibial cartilages for subjects 2, 3, and 4 are presented in Table 3.
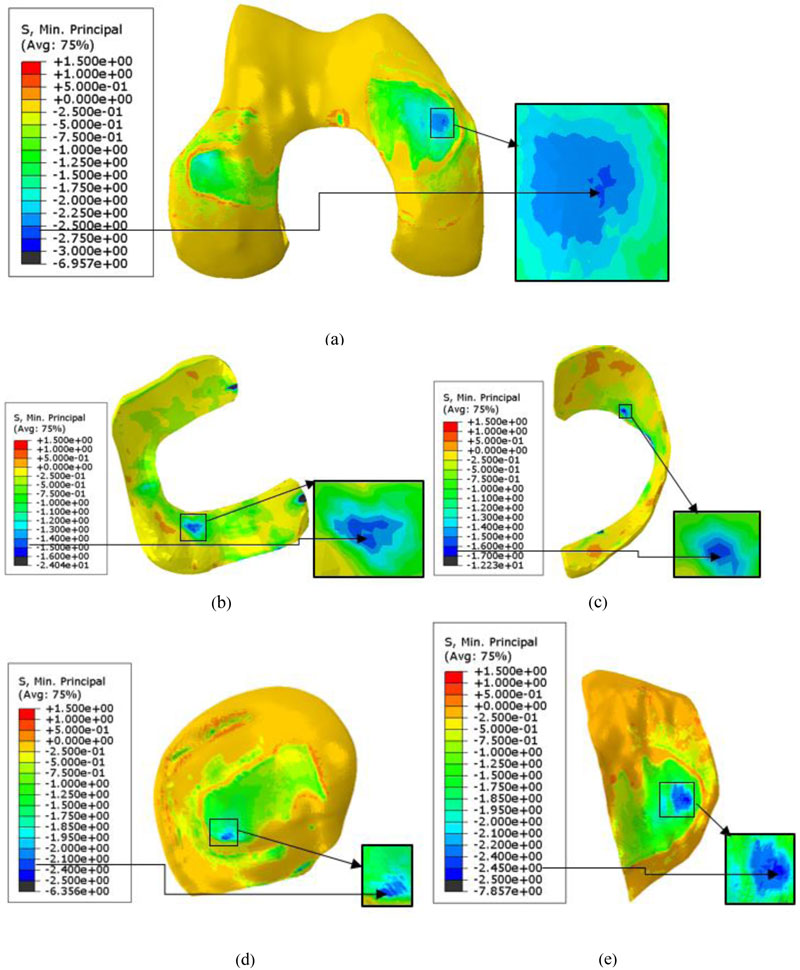
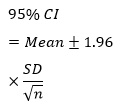
Table 3 and Fig. (7) show a comparison of the results of the present study with the results obtained by other authors. It can be noted that the sample size was calculated (Eq.1) based on a 95% CI (Z1-α/2 = 1.96 ). Accordingly, the 95% CI [20] could be expressed as follows:
The present study determined the 95% CI by considering the mean and standard deviation of stress measured in four subjects. The stress (mean±95% CI) of 2.92±0.9 MPa was located on the medial portion of FC. The stress of 2.98±0.51 MPa was higher on the Medial Tibial Cartilage (MTC) as compared to Lateral Tibial Cartilage (LTC) with 2.57±0.53 MPa. The stress of 2.81±0.92 MPa was higher on the Medial Meniscus (MM) as compared to the Lateral Meniscus (LM) with 2.52±.97 MPa.
 |
(3) |
| SFC | SLTC | SMTC | SLM | SMM | ||||||
|---|---|---|---|---|---|---|---|---|---|---|
| Magnitude (Location) | Contact Region |
Magnitude (Location) | Contact Region |
Magnitude (Location) | Contact Region |
Magnitude (Location) | Contact Region |
Magnitude (Location) | Contact Region |
|
| Subject 1 | 2.52 (A) | FC-MTC | 2.25 (C) | FC-LTC | 2.45 (A) | FC-MTC | 1.47 (A) | FC-LM | 1.66 (P) | FC-MM |
| Subject 2 | 2.44 (A) | FC-MTC | 2.30 (C) | FC-LTC | 2.67 (A) | FC-MTC | 3.76 (P) | FC-LM | 3.91 (C) | FC-MM |
| Subject 3 | 4.29 (A) | FC-MTC | 3.38 (C) | FC-LTC | 3.59 (C) | FC-MTC | 2.81 (A) | FC-LM | 3.06 (P) | FC-MM |
| Subject 4 | 2.42 (A) | FC-MTC | 2.34 (C) | FC-LTC | 3.20 (C) | FC-MTC | 2.05 (A) | FC-LM | 2.60 (C) | FC-MM |
| Mean | 2.92 | 2.57 | 2.98 | 2.52 | 2.81 | |||||
| SD | 0.92 | 0.54 | 0.52 | 0.99 | 0.94 | |||||
| 95% CI | 2.92±0.9 | 2.57±0.53 | 2.98±0.51 | 2.52±0.97 | 2.81±0.92 | |||||
| Dong et al. [9] | 3.20 | 1.70 | 2.75 | 2.83 | 3.00 | |||||
The contact pressure distributions in the femoral cartilage, menisci, and tibial cartilages were determined for subjects 1, 2, 3, and 4. Fig. (8) depicts the contact pressure distributions in the menisci, femoral, and tibial cartilages for subject 1. The pressure (maximum contact pressure) of 3.03 MPa was located on the medial portion of FC. The pressure of 2.43 MPa was higher on MTC as compared to LTC with 2.13 MPa. The pressure of 2.1 MPa was higher on MM as compared to LM with 0.996 MPa.
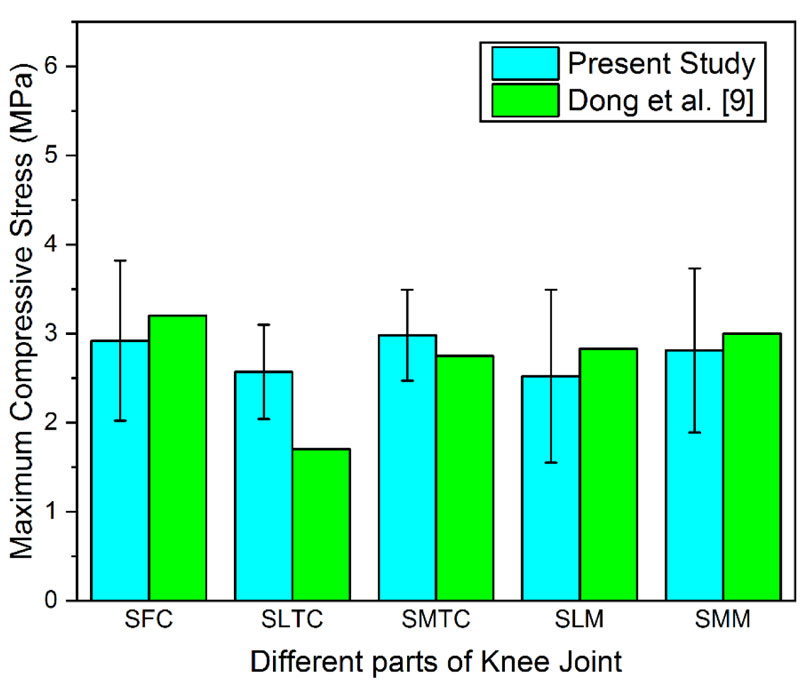
SFC-Compressive stress in FC, SLTC- Compressive stress in LTC, SMTC- Compressive stress in MTC, SLM-Compressive stress in Lateral Meniscus and SMM- Compressive stress in Medial Meniscus. The Error bars indicate standard error.
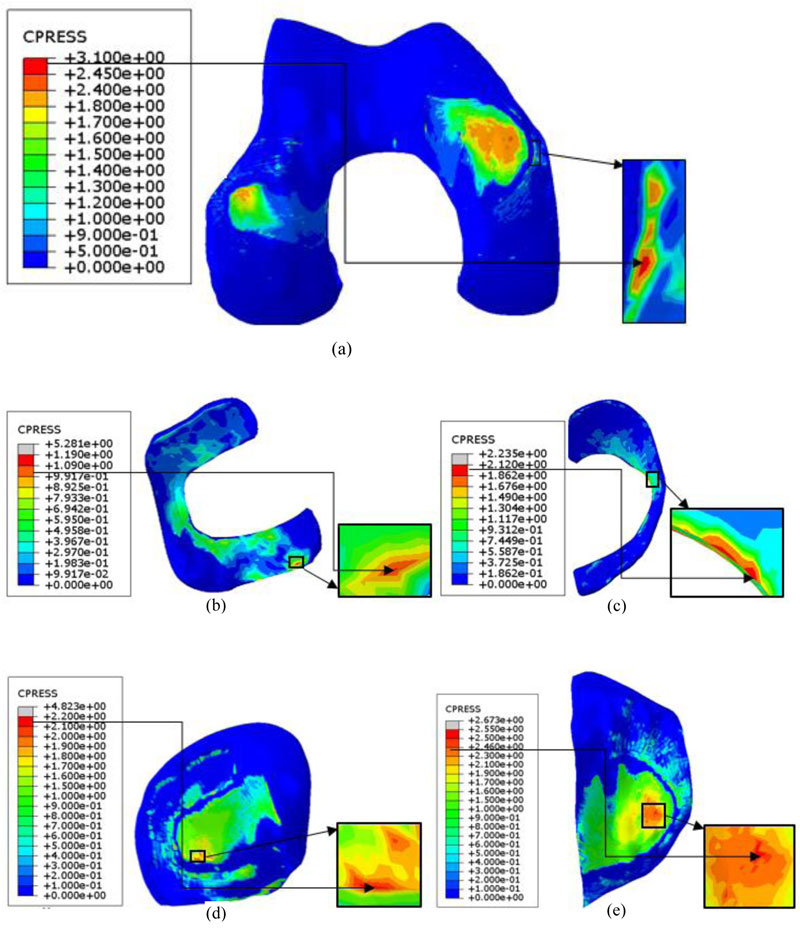
The contact pressure in the menisci, femoral, and tibial cartilages for subjects 2,3 and 4 are shown in Table 4 and Fig. (9). The present study determined the 95% CI by considering the mean and standard deviation of contact pressure measured in four subjects. The pressure (mean±95% CI) of 3.97±1.03 MPa was located on the medial portion of FC. The pressure of 3.91±1.17 MPa was higher on the medial tibial cartilage (MTC) as compared to lateral tibial cartilage (LTC) with 2.89±0.63 MPa. The pressure of 2.38±0.28 MPa was higher on the medial meniscus (MM) as compared to the lateral meniscus (LM) with 1.58±0.7 MPa.
| CFC | CLTC | CMTC | CLM | CMM | ||||||
|---|---|---|---|---|---|---|---|---|---|---|
| Magnitude (Location) | Contact Region |
Magnitude (Location) | Contact Region |
Magnitude (Location) | Contact Region |
Magnitude (Location) | Contact Region |
Magnitude (Location) | Contact Region |
|
| Subject 1 | 3.03 (A) | FC-MM | 2.13 (A) | FC-LTC | 2.43 (C) | FC-MTC | 0.996 (A) | FC-LM | 2.1 (C) | FC-MM |
| Subject 2 | 5.45 (P) | FC-MM | 2.59 (A) | LM-LTC | 3.47 (C) | MM-MTC | 2.06 (P) | FC-LM | 2.2 (C) | FC-MM |
| Subject 3 | 3.51 (P) | FC-MTC | 3.32 (C) | FC-LTC | 4.98 (C) | FC-MTC | 2.33 (A) | FC-LM | 2.74 (C) | FC-MM |
| Subject 4 | 3.89 (P) | FC-MM | 3.5 (C) | LM-LTC | 4.76 (C) | MM-MTC | 0.95 (P) | FC-LM | 2.47 (C) | FC-MM |
| Mean | 3.97 | 2.89 | 3.91 | 1.58 | 2.38 | |||||
| SD | 1.05 | 0.64 | 1.19 | 0.71 | 0.287 | |||||
| 95% CI | 3.97±1.03 | 2.89±0.63 | 3.91±1.17 | 1.58±0.7 | 2.38±0.28 | |||||
| Peña et al. [8] | - | - | - | 1.45 | 2.90 | |||||
| Bae et al. [15] | 2.32 | 2.46 | 2.62 | 2.27 | 2.57 | |||||
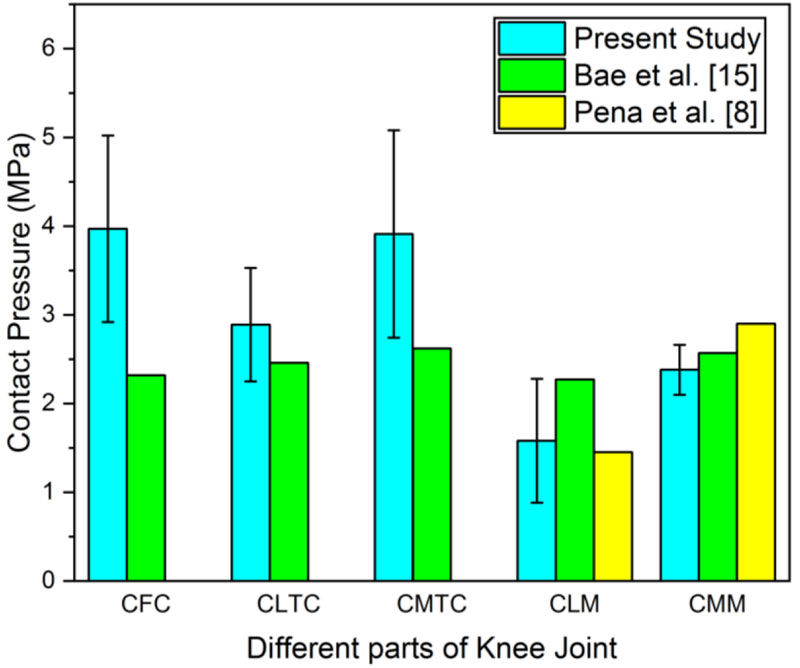
CFC- Contact pressure in FC, CLTC- Contact pressure in LTC, CMTC- Contact pressure in MTC, CLM- Contact pressure in LM and CMM- Contact pressure in MM. The Error bars indicate standard error.
The contact area between femoral and tibial cartilages and between menisci and tibial cartilages was determined for subjects 1, 2, 3, and 4. Fig. (10) depicts the contact area in the femoral cartilage, menisci and tibial cartilages for subject 4.
The total contact area measured on MTC and LTC for Subject 1 was 688 mm2 and 644 mm2, respectively. The total contact area measured on MTC and LTC for subjects 2, 3, and 4 is summarized in Table 5. Table 5 and Fig. (11) show a comparison of the results of the present study with the results obtained by other authors. The contact area (mean±95% CI) estimated on MTC and LTC was 701±89 mm2 and 617±63 mm2, respectively.
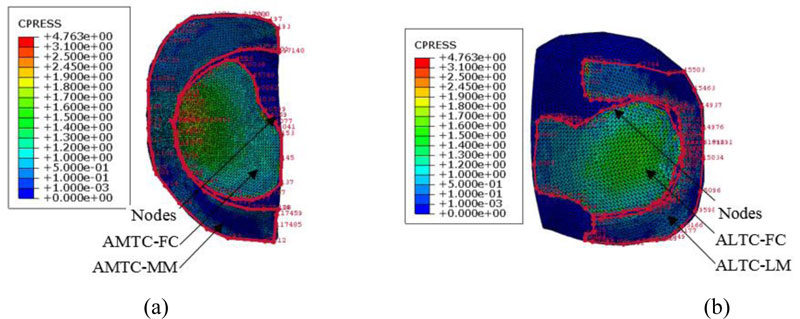
AMTC-FC- Area of contact between MTC and FC, AMTC-MM- Area of contact between MTC and MM, ALTC-FC- Area of contact between LTC and FC and ALTC-LM- Area of contact between LTC and LM.
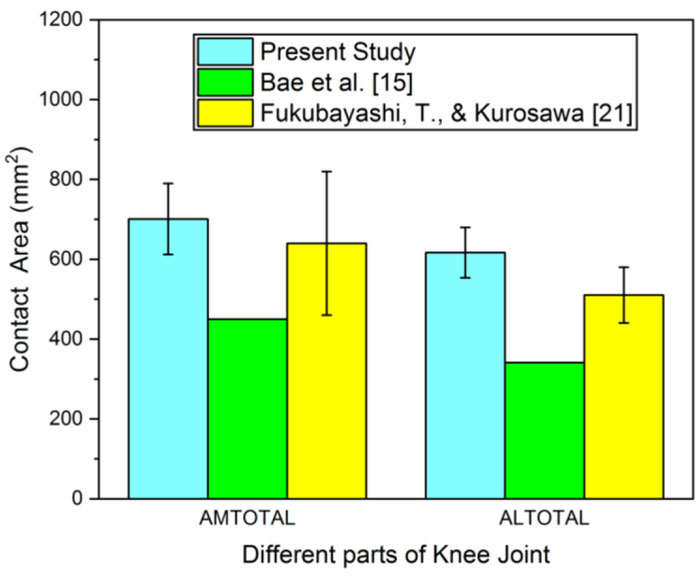
AMTOTAL-Total area of contact on the medial side and ALTOTAL-Total area of contact on the lateral side. The Error bars indicate standard error.
| - | AMTC-FC | AMTC-MM | AMTOTAL | ALTC-FC | ALTC-LM | ALTOTAL |
| Subject 1 | 330 | 358 | 688 | 262 | 382 | 644 |
| Subject 2 | 307 | 406 | 713 | 339 | 355 | 694 |
| Subject 3 | 241 | 350 | 591 | 225 | 334 | 559 |
| Subject 4 | 380 | 432 | 812 | 322 | 247 | 569 |
| Mean | 315 | 387 | 701 | 287 | 330 | 617 |
| SD | 57 | 38 | 89 | 52 | 57 | 63 |
| 95% CI | 315±56 | 387±37 | 701±87 | 287±51 | 330±56 | 617±62 |
| Bae et al. [15] | 197 | 253 | 450 | 186 | 155 | 341 |
| Fukubayashi, T., and Kurosawa [21] | - | 640±180 | - | - | 510±70 | |
4. DISCUSSION
In this study, four models of knee joints were constructed, including bones, cartilages, menisci, ligaments, and tendons. This study was performed to compare the distribution of contact pressure, contact area, and maximum compressive stress between the medial and lateral portions of cartilages and menisci.
It could be observed from Table 3 that the magnitude of maximum compressive stresses was higher on the medial portion of the femoral and tibial cartilages for all the subjects. This is because the center of pressure of the knee joint is positioned over the medial condyle at the full extension position during its gait cycle [22]. The reason for the higher magnitude of maximum compressive stress induced in the medial meniscus is because it is more constrained than the lateral meniscus, as it is attached to MCL [23]. In the case of Subject 3, the maximum compressive stress of 4.29 MPa on FC was higher when compared to that obtained for other subjects because the cartilage thickness is lesser in the region of contact at the femoral cartilage-tibial cartilage interface. This holds good as per the study conducted by Li et al. [24], which predicts that a decrease in the thickness of the cartilage layer is associated with a corresponding increase in the stress in the cartilage.
The material properties used for the different parts in the present study, along with boundary conditions, have a closer resemblance with those considered by Dong et al. [9]. Therefore, it could be appropriate to compare the values of stresses with those reported by Dong et al. [9]. It could be noted that most of the results of the present study (Table 3) are comparable with those reported by Dong et al. [9]. The subject-specific data, such as anatomy and the size of the joint, could be the reasons for the difference in the results of some parts of the knee joint between the present study and the results reported by Dong et al. [9]. Moreover, the results reported by the author were obtained by considering a single subject, whereas in the present work, the results were reported by considering multiple subjects for making them statistically significant.
It could be seen that the magnitude of contact pressure was higher on the medial portion of the femoral and tibial cartilages for all the subjects (Table 4). This is because the center of pressure of the knee joint is positioned over the medial condyle at the full extension position during its gait cycle [22]. The values of contact pressure determined from the present study are in agreement with the published results [8, 15] (Table 4). In the present study, a vertical load of 1150 N was considered, whereas Bae et al. [15] considered a vertical load of 1000 N along with an abductor force of 500 N. This could be the reason for the difference in results of some of the parts of the knee joint between the present study and Bae et al. [15]. The subject-specific data, such as anatomy and the size of the joint, could be the reason for the difference in the results in the menisci between the present study and the results reported by Peña et al. [8].
The contact area estimated on MTC and LTC in the present study were 701±87 mm2 and 617±62 mm2, respectively. It could be observed that the total contact area in MTC was more than that in the LTC (Table 5). This is in agreement with the results reported in previous studies [25, 26]. The contact area measured on MTC and LTC in an experimental study by Fukubayashi, T., and Kurosawa [21] was 640±180 mm2 and 510±70mm2, respectively. It could be seen that the results of the present study are comparable with the results reported in the experimental study. The contact area measured on MTC and LTC in an FE study by Bae et al. [15] was 450 mm2 and 341 mm2, respectively. Bae et al. [15] considered a vertical load of 1000 N along with an abductor force of 500 N. This could be the reason for the difference in results between the present study (Table 5) and published literature.
The present study has a few limitations. First, linearly elastic material properties were assumed for menisci and cartilages. However, this is justified considering the short duration of loading on the knee joint. Second, the present study was carried out by considering the material properties taken from the literature. It would be better to consider the subject-specific material properties to reflect the actual biomechanical behavior of the knee joint. Third, the effect of different angles of flexion on the contact stresses in the knee joint was not considered. The present study considered multiple subjects for analysis to make the results statistically significant, which is not the case, as found in the reported literature. Therefore, this study may motivate other researchers to take up further investigations by considering multiple subjects into account.
CONCLUSION
Four models of knee joints are developed considering bones, cartilages, menisci, ligaments, and tendons. The models are analyzed with the application of axial compressive force, which corresponds to the force of the gait cycle for the full extension position of the knee joint. The magnitude of maximum compressive stress, contact pressure, and contact area in the cartilages and menisci are determined. The results of the present study demonstrate statistical significance by considering the finite element analysis of knee joints of multiple subjects. The results were compared with those published in the literature and were found to be in close agreement. The reason for the observed difference in the magnitude of maximum compressive stress, contact pressure, and contact area are discussed with suitable justifications. This study confirms that the medial femoral and tibial cartilages are subjected to a higher magnitude of stress and contact pressure as compared to their lateral counterparts. The contact area in the medial tibial cartilage is larger than that in the lateral tibial cartilage. This study shows that the medial meniscus is more likely to rupture under extreme loading conditions, as the stresses in the medial meniscus are more than that in the lateral meniscus. The models could be further developed to serve as a clinical tool for surgery planning to treat patients with knee injuries.
ETHICS APPROVAL AND CONSENT TO PARTICIPATE
The study was approved by the Communication of the Decision of the Institutional Ethics Committee (Registration No. ECR/146/Inst/KA/2013/RR-16) (IEC Project No. IEC 170/2014)
HUMAN AND ANIMAL RIGHTS
No animals were used in this research. All human research procedures followed were in accordance with the ethical standards of the committee responsible for human experimentation (institutional and national) and with the Helsinki Declaration of 1975, as revised in 2008.
CONSENT FOR PUBLICATION
All patients participated on a voluntary basis and gave their informed consent.
AVAILABILITY OF DATA AND MATERIALS
The authors confirm that the data supporting the findings of this research are available within the article.
FUNDING
None.
CONFLICT OF INTEREST
The authors declare no conflict of interest, financial or otherwise.
ACKNOWLEDGEMENTS
Declared none.

