All published articles of this journal are available on ScienceDirect.

Research on Algorithm of Extracting PPG Signal for Detecting Atrial Fibrillation based on Probability Density Function
Abstract
The paper introduced a new method based on probability density function (PDF) and phase space diagram method for photoplethysmography (PPG) signal extracting. In the paper, PPG information was generated from human fingertips by smartphones. The pulse wave period was then separated and reconstructed into probability density function (PDF) by the phase space diagram algorithm. The difference between normal sinus rhythm (NSR) and atrial fibrillation (AF) was finally found by skewness of the PDF. The results of the present study demonstrates that the new method is vividly viable for detecting AF on the smartphone.
1. INTRODUCTION
Atrial fibrillation (AF) is one of the most common sustained arrhythmias in adults, and its occurrence increases with age. The incidence rate is estimated to be 5% for people over 60 years old, and 10% for people over 80 years old [1]. Moreover, the AF increases the mortality rate and risk of stroke [2]. Several risk factors for AF include myocardial infarction or congestive heart failure [3, 4].
At present, AF detection mainly relies on professional hospital equipment [5].
However, the long time in ECG detection of AF in ambulatory condition remains a high cost.
Therefore, there is a great need for developing new monitoring technologies that are easy to use. The paper introduced a signal detection method by using the built-in smart phone camera. The signal was recorded by placing a finger over the camera. The pulse wave was extracted by the PPG method which counted with changing of the color of image due to changing of fingertips blood volume [6, 7]. Pulsatile signal of about 3 minutes was collected for further analysis.
In this paper, the processed PPG signal was analyzed by PDF and phase space reconstruction. AF information was then detected by skewness coefficient. The results showed that the new method was practicable and could be applied to smartphones for users.
2. METHODS
2.1. Extracting PPG Information
Previous studies have shown that PPG Information can be found by the smart phone`s camera. The method relies on fingertips images captured from the built-in smart phone camera. The pixel values in red channel can be calculated from the images.
In the paper, YUV420SP model was selected for previewing video [8], and was changed to RGB color model for extracting and calculating inter-pulse period.
Some experiments verified the red channel of RGB color model could accurately reflect PPG signals [9]. Thus, the red channel information was isolated as the inter-pulse period. Meanwhile, the adjacent pulse beat time could be found by adjacent pulse wave peaks.
Two peaks of PPG signals were then calculated as heart rate. Correctness of this method [10] was verified by comparing the calculated heart rate to the one obtained from standard pulse measuring instrument.
2.2. Phase Space Reconstruction
In prior work, phase space reconstruction was introduced into the kinetic [11]. With the phase space reconstruction, chaotic time series can be reconstructed to nonlinear dynamical system [12].
It is common knowledge that pulse waves contain copious information of human body, including waveform, amplitude, and velocity. These information can reflect many characteristics of the human cardiovascular system [13-15]. Inter-pulse period is one of the considerable measures of the pulse wave. According to Takens’ embed principles, the inter-pulse period is applied to reconstruct phase space, while system dynamics remain unchanged. Assuming x(n),n=1,2,…N is the adjacent peaks time of the PPG signal, the m-dimensional vector can be constructed as
y(n)=(x(n),x(n+t),…x(n+(m-1)t)) (1)
In formula (1), m is embedded dimension, t is delay time. Phase space reconstruction y(n) of five-dimensional vector can be obtained by constructing x(n).
2.3. Probability Density Function (PDF)
Correlation function f(m,t,r) is constructed to calculate the probability for any two points whose distance in the phase space is less than r.
f(m,t,r) can be written as
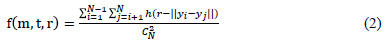
Symbol  is the Euclidean distance.Let the Unit step function be h:
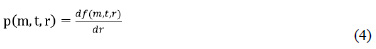
The PDF can be obtained by the following formula:
3. ANALYSIS
3.1. Data Collection
In the paper, pulse data were collected by smart phone camera from fingertip information. The pulse data detection was compared with the standard ECG instrument simultaneously to ensure the accuracy of the extracted inter-pulse. Fig. (1) shows the results of PPG waveform and ECG waveform.
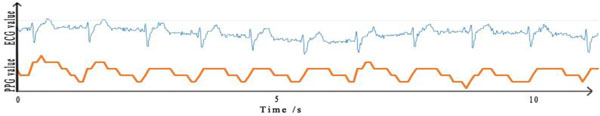
Compare ECG and PPG waveform.
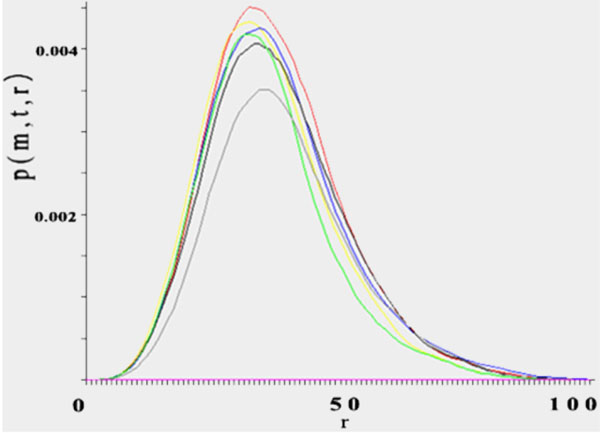
PDF in 5-dimensional.
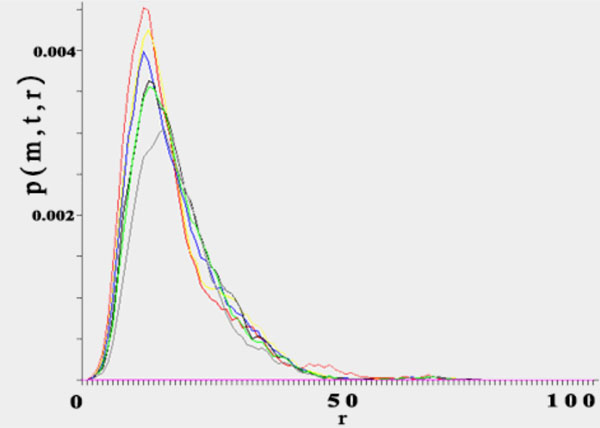
PDF curve of NSR after filtering.
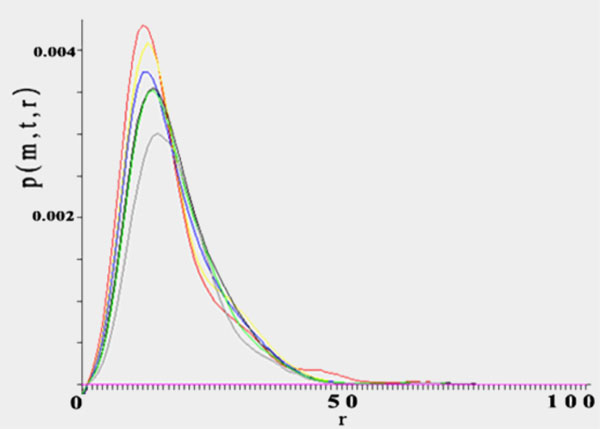
PDF curve of AF after filtering.
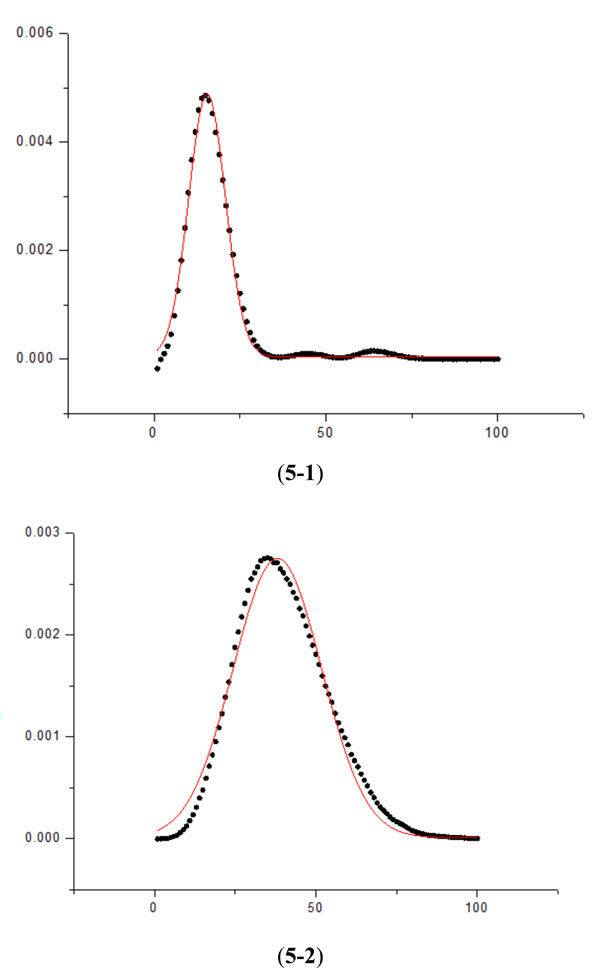
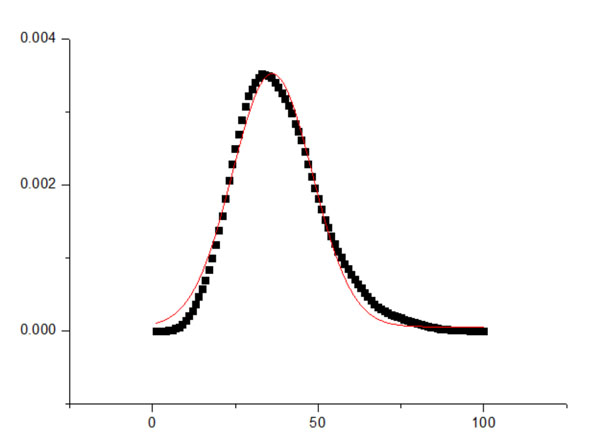
Curve after fitting.
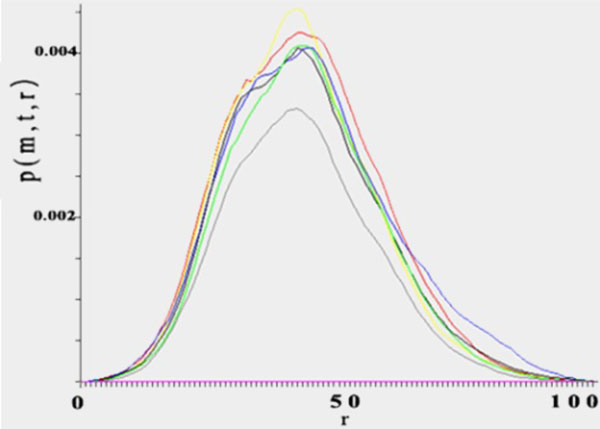
PDF curve after filtering for data from MIT-BIH Fibrillation Database.
PDF curve after fitting for data from MIT-BIH Fibrillation Database.
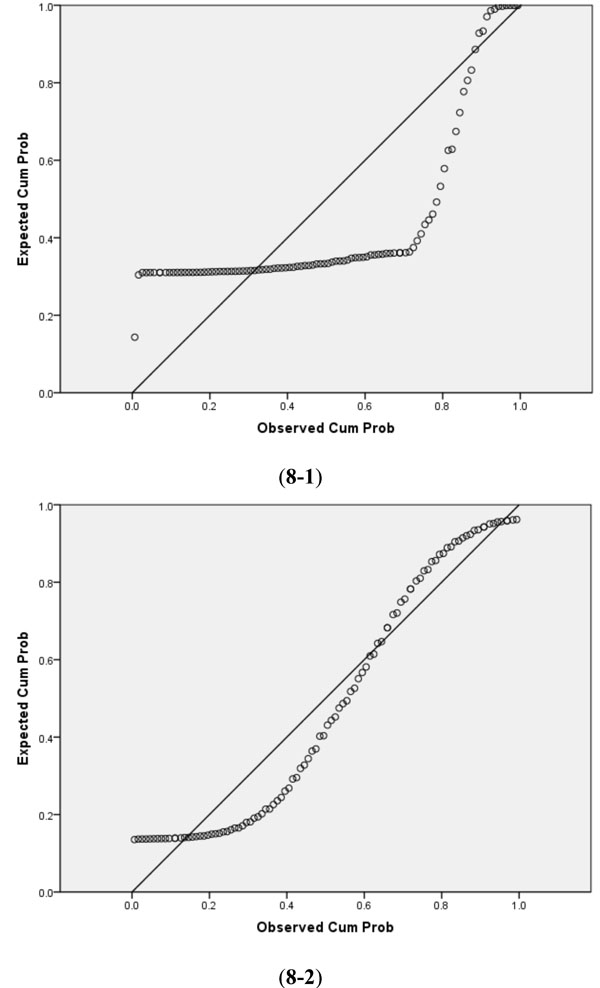
P-P plot of normal distribution.
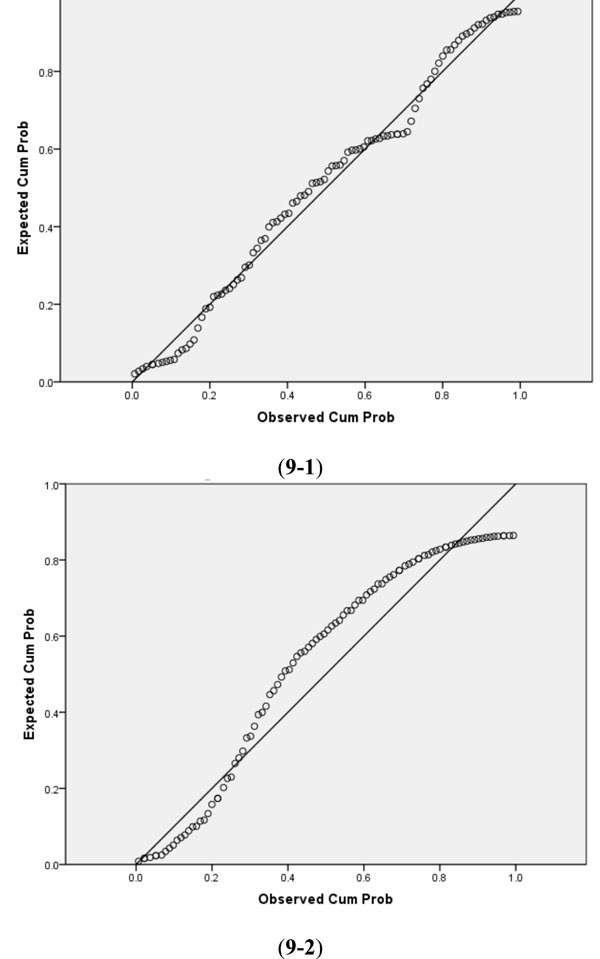
P-P plot of lognormal distribution.
ECG and PPG comparative results.
| No. | ECG-RR time(ms) | PPG inter-pulse time(ms) | Relative error |
|---|---|---|---|
| 1 | 762.4 | 824 | 0.0808 |
| 2 | 772.4 | 763 | 0.0122 |
| 3 | 787.5 | 757 | 0.0387 |
| 4 | 822.6 | 788 | 0.0421 |
| 5 | 807.5 | 820 | 0.0155 |
| 6 | 772.4 | 834 | 0.0798 |
| 7 | 737.3 | 774 | 0.0498 |
| 8 | 727.2 | 688 | 0.0539 |
| 9 | 742.3 | 746 | 0.0050 |
| 10 | 722.2 | 763 | 0.0565 |
Skewness of collected in experiment.
| No | Skewness of NSR in experiment | Skewness of AF in experiment |
|---|---|---|
| 1 | 2.332 | 0.753 |
| 2 | 2.101 | 0.880 |
| 3 | 2.087 | 0.426 |
| 4 | 2.332 | 0.638 |
| 5 | 2.297 | 0.831 |
| 6 | 1.831 | 0.874 |
| 7 | 2.749 | 0.836 |
| 8 | 2.074 | 0.927 |
| 9 | 2.813 | 0.858 |
| 10 | 1.743 | 0.650 |
| 11 | 2.043 | 0.589 |
Skewness of MIT-BIH.
| No | Skewness of NSR from MIT-BIH | Skewness of AF from MIT-BIH |
|---|---|---|
| 1 | 1.736 | 0.980 |
| 2 | 1.454 | 0.318 |
| 3 | 1.841 | 0.287 |
| 4 | 1.590 | 0.479 |
| 5 | 2.497 | 0.768 |
| 6 | 2.548 | 0.887 |
| 7 | 1.702 | 0.693 |
| 8 | 2.079 | 0.595 |
| 9 | 1.999 | 0.663 |
| 10 | 1.702 | 0.557 |
Table 1 shows one of the detecting information. The results of experiments proved that the accuracy of calculating inter-pulse time from collecting human pulse data by smart phones was more than 95%, and the average relative error was 0.0411.
Our study included 25 people of NSR in the University of Shanghai for Science and Technology, and 6 patients with persistent AF from community hospital.
It was found that the more human pulse data were collected, the easier it was to distinguish AF from NSR. Meanwhile, the more human pulse data were collected, the longer detecting time was needed. Considering these two factors, we collected 350 human pulse data in every experiment to ensure experiment accuracy while shortening the detection time.
3.2. PDF Distribution
We reconstructed different delay of the pulse data extracted in 5-dimensional based on the phase space reconstruction and PDF function, and then, we constructed the PDF by distance value of each data. Results are visually summarized in Fig. (2).
3.3. Filtering Result
In order to conveniently fit curve and ensure minimum loss of image information, the linear filter was used to make the curve more smooth as shown in Fig. (3).
It is obvious that PDF of NSR resembles lognormal distribution, while PDF of AF resembles normal distribution instead after filtering, as shown in Fig. (3) and Fig. (4).
In Fig. (4), the characteristic differences among different delay times were not very obvious in 5-dimension, and therefore, delay time t=1 was used for the next research.
With computer-aided technology [16], Gaussian curve fitting was used for the PDF curve with delay time t=1. As Fig. (5) shows, the fitting R-squared values are more than 0.95. The curve of NSR is shown as Fig. (5-1), and AF is shown as Fig. (5-2).
3.4. Comparison of Standard AF
To verify presented method ulteriorly, ECG signals taken from MITBIH database containing AF episodes were tested. The number of each AF segment data was selected as 350.
PDF curve was reconstructed from the AF segment data by phase space following the formula (2). The curve was then filtered by Gaussian fitting. Fig. (6) shows the filtering PDF curve.
Meanwhile, the curve with delay t=1 was fitted by Gaussian fitting. Fig. (7) was generated by plotting the time of delay t=1.
The new method was carried out exploiting the same number of date from MIT-BIH Fibrillation Database. Comparing Fig. (7) with PDF curve of AF in Fig. (5-2), it was obvious that they were all close to normal distribution.
3.5. P-P Plot
For evaluation of new method quality, the statistical regular pattern of PDF curve after fitting was analyzed by the P-P plot of NSR and AF normal distribution [17, 18].
Fig. (8-1) show the NSR P-P plots of normal distribution, and Fig. (8-2) show the AF P-P plots of normal distribution.
Fig. (9-1) show the NSR P-P plots of lognormal distribution, and Fig. (9-2) show the AF P-P plots of AF P-P plot.
It could be seen that results of NSR were more close to lognormal distribution and results of AF were more close to normal distribution.
Comparing with Zhang ChangLin, Fritz-Albert Popp’s study of human skin surface conductance measurement [19], we have obtained similar results. Their study found when a person was in a state of physiological disorders, skin surface conductance values were no longer close to lognormal distribution, but closer to normal distribution instead. This phenomenon was statistical self-similarity and was correspond with self-similar nested structure.
3.6. Skewness Analysis
As demonstrated in Fig. (8) and Fig. (9), PDF curves were close to normal distribution or lognormal distribution. Therefore, AF could be distinguished from NSR by the eigenvalues of normal distribution. The skewness of lognormal distribution was chosen to distinguish the curves [20, 21].
As shown in Tables 2 and 3, the skewness of data collected both from smart phones in experiment and MIT-BIH Fibrillation Database were calculated.
Results were visually presented in Tables 2 and 3. Skewness of AF data collected in experiment and MIT-BIH Fibrillation Database were all in range 0 to 1. Meanwhile, the skewness of NSR data were all out of range 0 to 1. Therefore, the skewness could be used to distinguish NSR and AF.
CONCLUSION
This paper described a new method for analysis of AF and NSR information.
We have collected color information from human fingerprints, so that we can extract pulse wave interval time from isolated red channel. We have reconstructed phase space of the data which is formed into PDF curve with the pulse wave interval time. Here, the PDF curve was processed by Gaussian fitting where the dimension=5 with delay t=1.
Moreover, the data of AF extracted from MIT-BIH Fibrillation Database has been chosen for verification. To conclude, obtained results showed that skewness between AF PDF curve and NSR PDF curve are significantly different.
Based on these preliminary observations, we believe the proposed technology has the potential to improve the prevention and monitoring of AF patients and it can be easily applied on a smartphone.
This study confirmed the PDF curve with the pulse wave interval time of a person in a physiological disorder state is no longer close to lognormal distribution, but closer to normal distribution instead.
Comparing to Zhang ChangLin and Friz-Albert Popp's study of human skin surface conductance measurement, our results also shows a statistical self-similarity phenomenon, and is correspond with self-similar nested structure.
We believe that the conclusion is suitable in other human study area.
CONFLICT OF INTEREST
The authors confirm that this article content has no conflict of interest.
ACKNOWLEDGEMENTS
We would like to thank the MIT-BIH Atrial Fibrillation database for the data used and the Biomedical Signal Processing Laboratory for the automatic R–R intervals detection algorithm. We also thank the anonymous reviewers for helpful advice.

