All published articles of this journal are available on ScienceDirect.

Variability in EIT Images of Lung Ventilation as a Function of Electrode Planes and Body Positions
Abstract
This study is aimed at investigating the variability in resistivity changes in the lung region as a function of air volume, electrode plane and body position. Six normal subjects (33.8 ± 4.7 years, range from 26 to 37 years) were studied using the Sheffield Electrical Impedance Tomography (EIT) portable system. Three transverse planes at the level of second intercostal space, the level of the xiphisternal joint, and midway between upper and lower locations were chosen for measurements. For each plane, sixteen electrodes were uniformly positioned around the thorax. Data were collected with the breath held at end expiration and after inspiring 0.5, 1.0, or 1.5 liters of air from end expiration, with the subject in both the supine and sitting position. The average resistivity change in five regions, two 8x8 pixel local regions in the right lung, entire right, entire left and total lung regions, were calculated. The results show the resistivity change averaged over electrode positions and subject positions was 7-9% per liter of air, with a slightly larger resistivity change of 10 % per liter air in the lower electrode plane. There was no significant difference (p>0.05) between supine and sitting. The two 8x8 regions show a larger inter individual variability (coefficient of variation, CV, is from 30% to 382%) compared to the entire left, entire right and total lung (CV is from 11% to 51%). The results for the global regions are more consistent. The large inter individual variability appears to be a problem for clinical applications of EIT, such as regional ventilation. The variability may be mitigated by choosing appropriate electrode plane, body position and region of interest for the analysis.
1. INTRODUCTION
Electrical Impedance Tomography (EIT) has been used in a number of medical applications, such as monitoring of lung and heart function, blood flow, and internal bleeding, studying pelvic fluid accumulation and the stomach emptying, screening for breast cancer, etc. [1]. Since the lungs are the largest organs in the thorax, the lung resistivity change can be more accurately measured by EIT images compared to other thoracic organs or tissues [2]. There is ample scientific support for the possibility of obtaining regional information on lung function, especially non-invasive bedside monitoring of the regional lung function [3-5].
The main components of the lungs include fluid, air and tissues. The increase in the air volume of the lungs results in an increase in lung resistivity [6]. This enables the assessment of lung ventilation using EIT. For most 2D EIT systems, a ring of electrodes is placed in a single plane around the thorax. Dynamic 2D cross-sectional images are reconstructed showing the changes. It is generally assumed that the measured resistivity change in EIT images is caused by the actual resistivity change of tissue or in some cases the volume change of a vessel. Reconstruction algorithms generally do not consider changes in thoracic size or organ position. The level of electrode plane, the selection of the region of interest (ROI) for resistivity analysis, and body position are rarely considered. These factors may result in large variability in the EIT images [7].
In this human study, lung resistivity changes as a function of lung volume using different electrode planes and body positions were investigated. Different ROIs over the lung regions in EIT images were chosen to quantitatively determine the influence of electrode planes and body positions on the estimations of the lung ventilation.
2. METHODS
Six male subjects aged 33.8 ± 4.7 years (mean ± standard deviation, age range from 26 to 37 years) were studied in the supine and sitting positions using the Sheffield EIT portable system DAS-01P. All the subjects gave their informed consent to participate in the study and the protocol was approved by the Institutional Review Board (Human Subjects Committee) at the University of Minnesota.
For each subject, three sets of 16 Ag-AgCl ECG electrodes (Conmed Corporation, USA) were equally spaced around the thorax at three planes. The upper ring of electrodes was placed at the level of the second intercostal space and the lower ring of electrodes at the level of the xiphisternal joint. The middle ring of electrodes was equally spaced between the upper and lower rings. The approximate separation of each electrode plane was 5.6 cm.
EIT Data were collected at four different lung volumes. The lung volume was changed by single step inhalation. From end of normal expiration, subjects inhaled 0.5, 1.0 or 1.5 liters of air and then held their breath. Each step was started from normal end expiration, which was assumed to be at the same functional residual capacity (FRC). The inhaled air volume was measured by laboratory gas test meter (Parkinson Cowan Ltd, USA). The subjects were allowed to rest between each volume level.
Dynamic images were reconstructed using the Sheffield back-projection algorithm [8]. The data evaluation was performed off-line utilizing a Matlab-based program developed in authors’ laboratory [9]. The end of expiration was chosen as the reference data frame for the data collected at other volumes used to create images. For image reconstruction at each air volume, 12 seconds of EIT measurements were averaged. The program automatically determines the regional borders from user selected threshold levels and then calculates the average resistivity changes.
Resistivity changes were calculated for two local regions in the right lung (8x8 pixels) [10, 11] and for the right, left and total lung image field. Fig. (1a) shows the regions of the left, right, and total lung where only the pixels with the resistivity changes greater than 3% were chosen. Fig. (1,b) shows two local regions of 8x8 pixels where all the pixels were included without considering the resistivity changes. Area 1 and area 2 in the right lung were selected based on the MR images and the locations are the same for three electrode planes. The ROIs were determined for all subjects for each electrode planes and body positions.
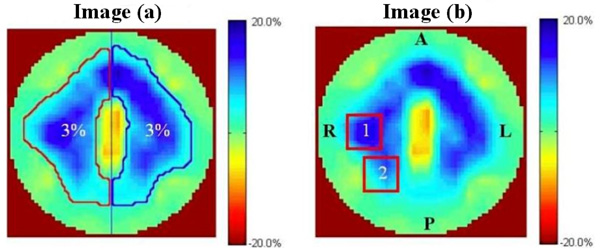
Image (a) shows the automatically selected right lung (outlined in red), left lung and total lung image with a threshold of 3%. Image (b) shows the two local regions in the right lung (8x8 pixels), labeled 1 and 2. The center of area 1 lies in the middle of the left half of image b. Area 2 is area 1 repositioned 45 degrees counter clockwise. The resistivity changes in these two regions are the mean of all the pixels. R: right, L: left, P: posterior, A: anterior.
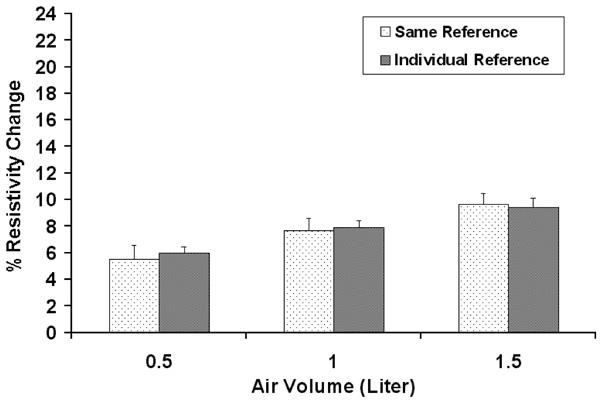
Comparison between the results with the same reference used for all measurement within one plane in one subject and those with individual references used for each of the three other volumes. The standard deviation is for the ten trials in one subject.
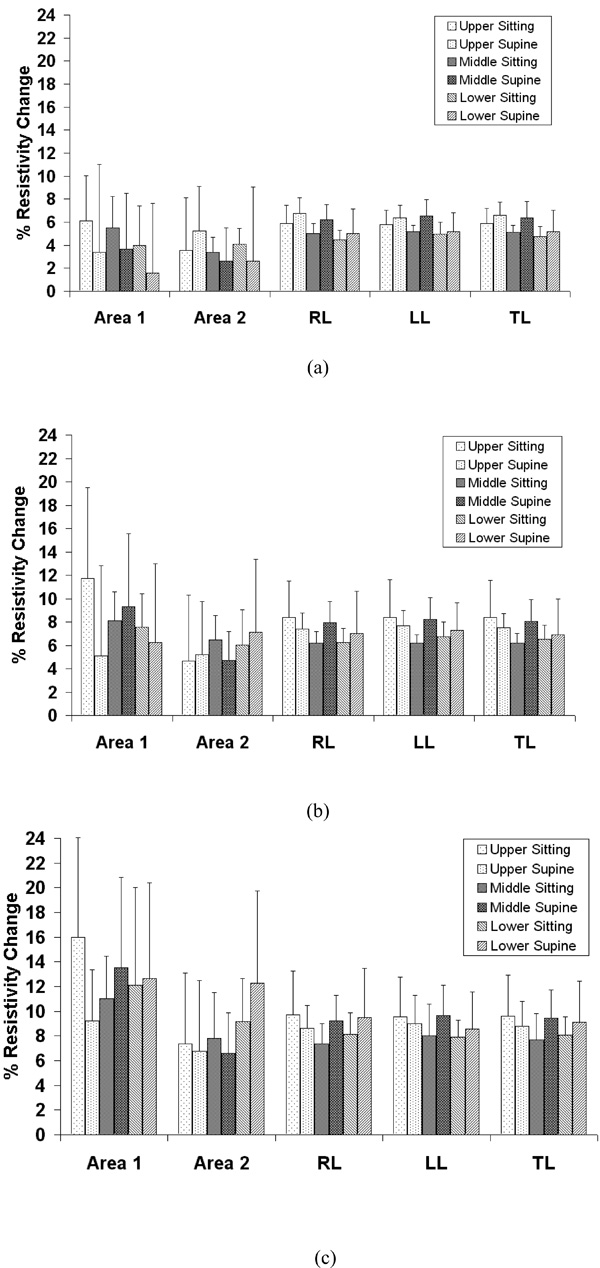
Average resistivity changes compared between sitting and supine position in the selected areas as shown in Fig. (1) for the upper, middle and lower electrode positions with 0.5 (a), 1.0 (b) and 1.5 liters (c) of air inspired. The standard deviation is for six subjects. RL: right lung, LL: left lung, TL: total lung.
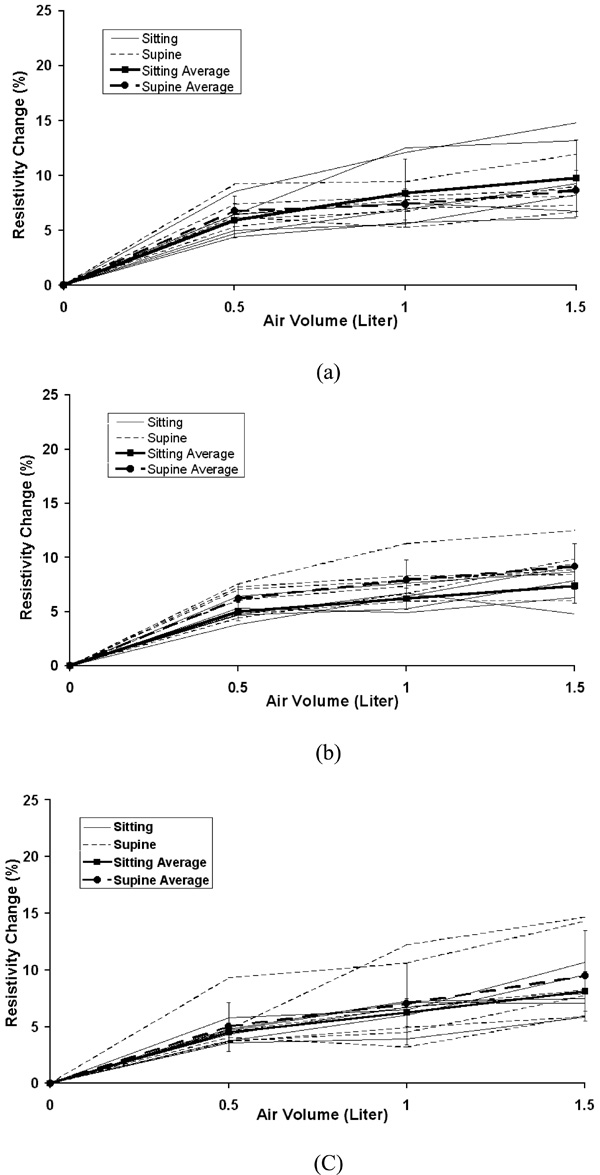
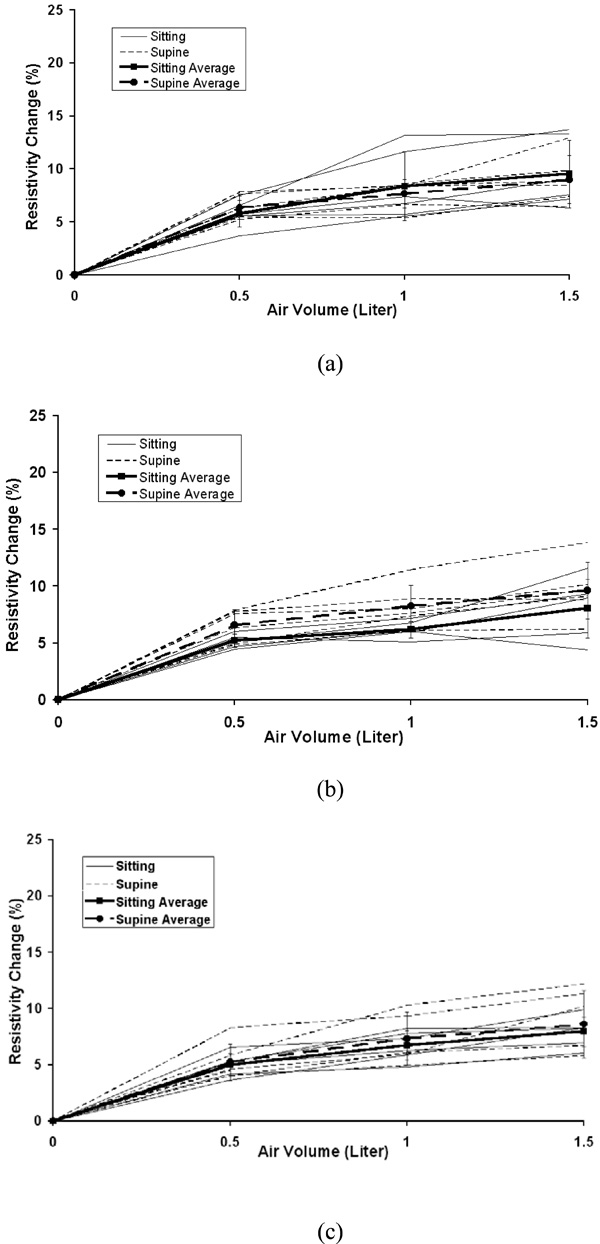
The individual and average resistivity changes in the right lung for the upper electrode position (a), the middle electrode position (b) and the lower electrode position (c) as a function of inspired air volumes of 0.5, 1.0 and 1.5 liter. The standard deviation is for six subjects. Zero in the x-axis represents end of expiration (FRC).
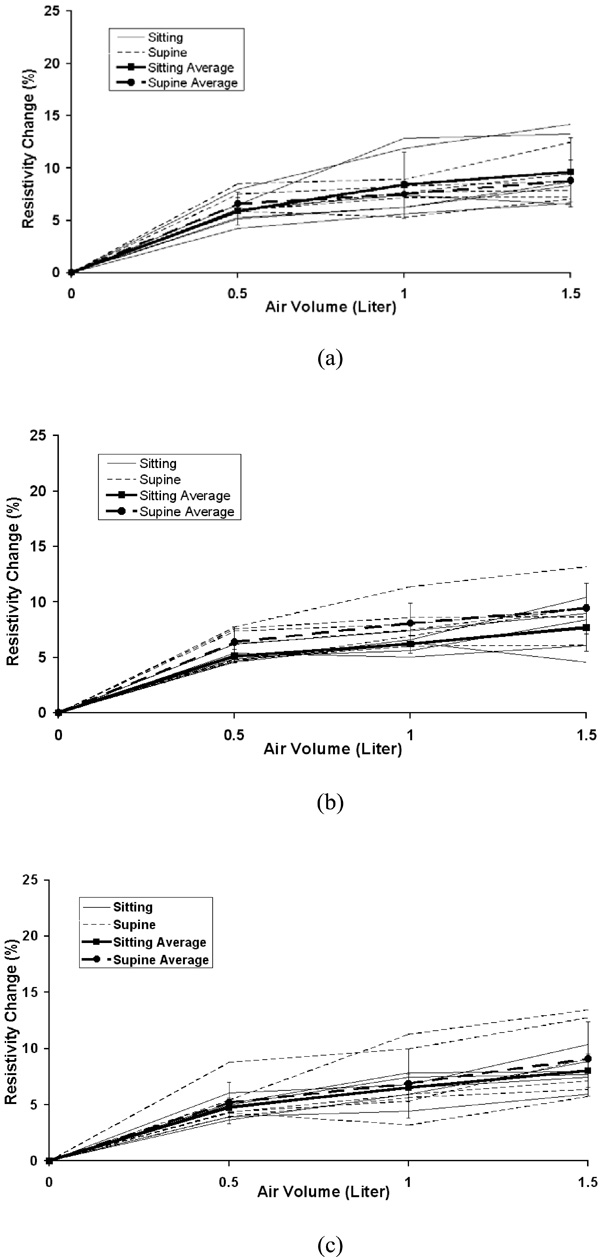
The individual and average resistivity changes in the left lung for the upper electrode position (a), the middle electrode position (b) and the lower electrode position (c) as a function of inspired air volumes of 0.5, 1.0 and 1.5 liter. The standard deviation is for six subjects. Zero in the x-axis represents end of expiration (FRC).
The individual and average resistivity changes in the total lung for the upper electrode position (a), the middle electrode position (b) and the lower electrode position (c) as a function of inspired air volumes of 0.5, 1.0 and 1.5 liter. The standard deviation is for six subjects. Zero in the x-axis represents end of expiration (FRC).
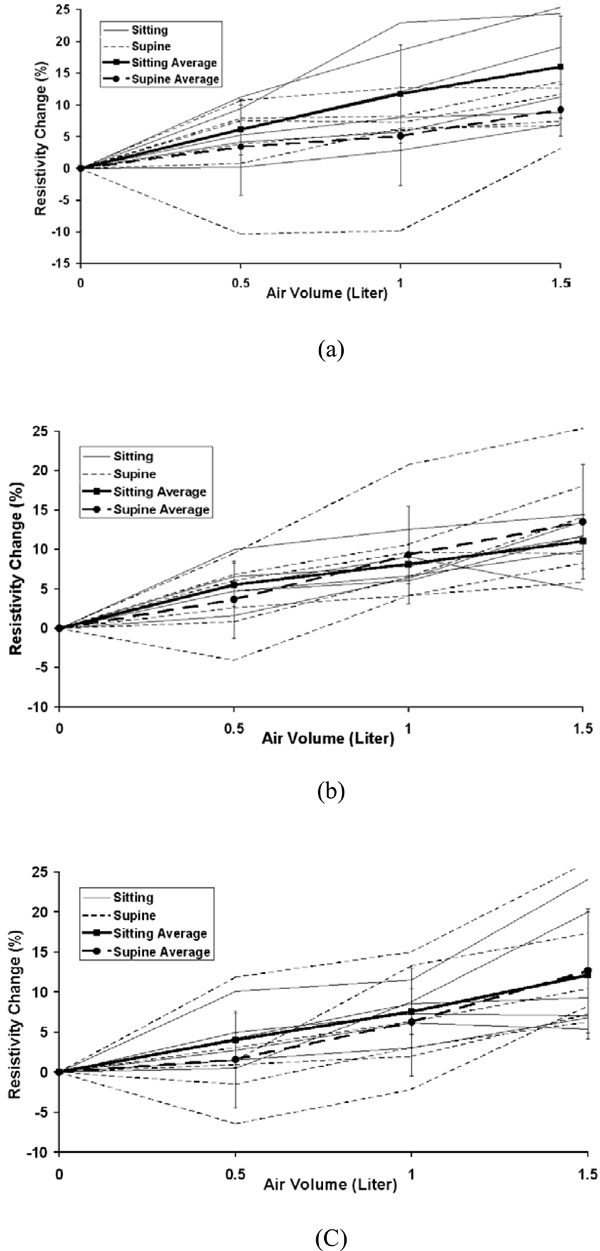
The individual and average resistivity changes in the area 1 for the upper electrode position (a), the middle electrode position (b) and the lower electrode position (c) as a function of inspired air volume of 0.5, 1.0 and 1.5 liter. The standard deviation is for six subjects. Zero in the x-axis represents end of expiration (FRC).
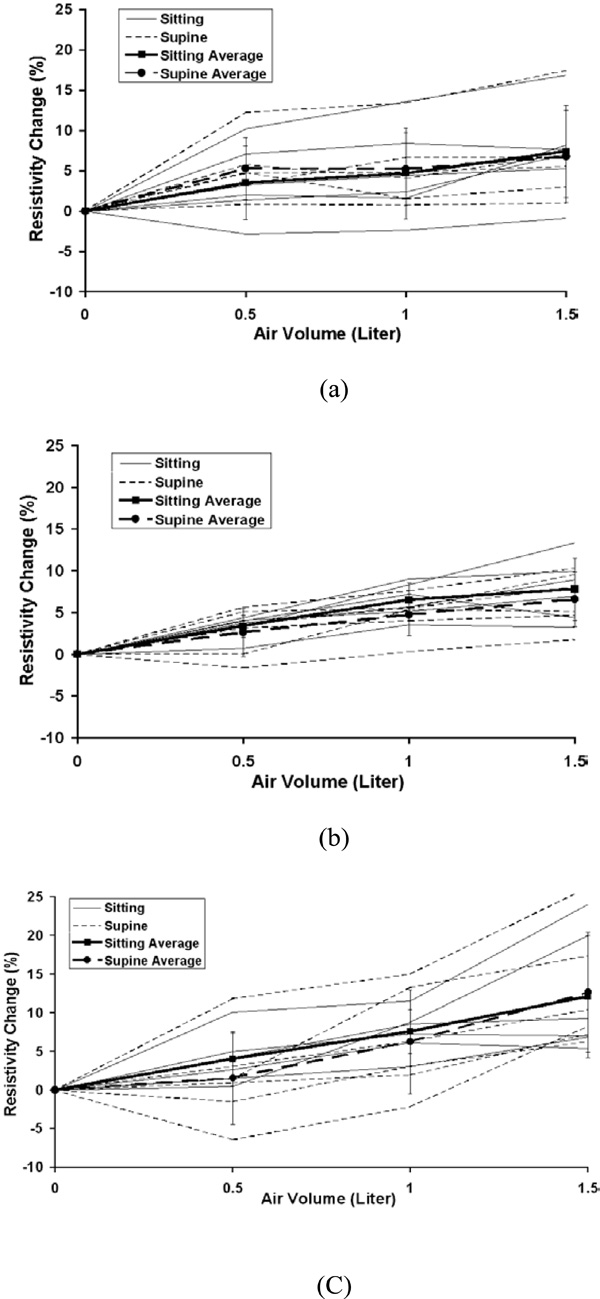
The individual and average resistivity changes in the area 2 for the upper electrode position (a), the middle electrode position (b) and the lower electrode position (c) as a function of inspired air volume of 0.5, 1.0 and 1.5 liter. The standard deviation is for six subjects. Zero in the x-axis represents end of expiration (FRC).
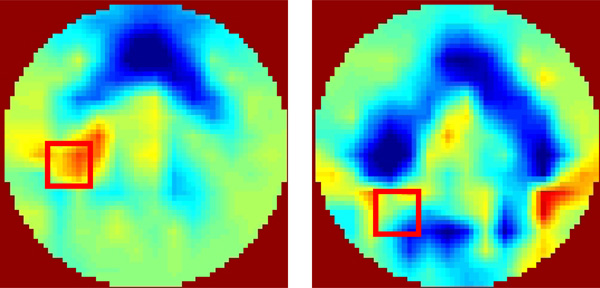
An example for the negative resistivity changes in the area 1 and 2. The EIT images were reconstructed using experimental measurements from one subject at different air volumes, 0.5 liter (left) and 1.0 liter (right). The subject was in the supine position and the upper electrode place was used.
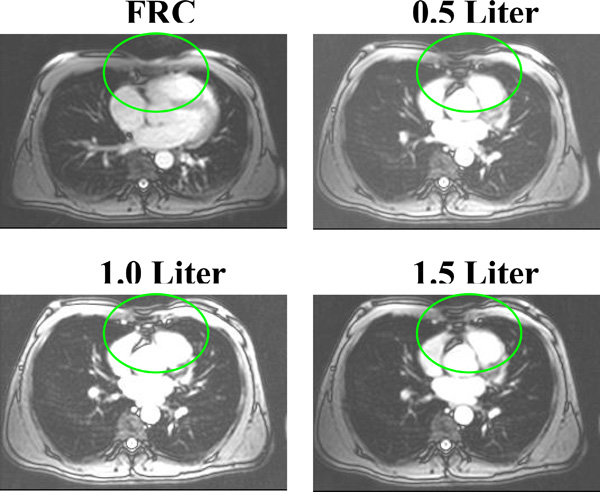
MR images showing the tissue/organ movements during lung ventilation.
In the three different electrode planes, the average resistivity changes related to the selected regions were calculated. All the results were reported as mean ± standard deviation. A t-test was used to determine the significance of the difference between supine and sitting position at five ROIs with different electrode levels and air volumes. Coefficients of variation (CV) were calculated to determine the variability.
The experiment was repeated 10 times in one subject without removing the electrodes over a time period of two hours to determine the reproducibility. Data were analyzed with two different reference frames. The first method used the same reference for all three other air volumes in the lung for each electrode plane. The second method used an individual reference obtained at the start of inspiration for each of the three volumes. As shown in Fig. (2), there was no significant difference (p>0.05). In the study, the same reference was used to reconstruct the EIT images.
3. RESULTS
The average percentage changes in resistivity comparing sitting and supine positions in the five chosen areas are shown in Fig. (3) for 0.5, 1.0 and 1.5 liter of air inspired at the upper, middle and lower electrode planes. The typical average resistivity change for the entire right, left and total lung regions is approximately 5% to 7% with 0.5 liter of inspiration, 7% to 9% with 1.0 liter of inspiration and 8% to 10% with 1.5 liter of inspiration. While for 8x8 pixel regions, the average resistivity changes show more variability, ranging from 2% to 6% with 0.5 liter of inspiration, 5% to 12% with 1.0 liter of inspiration and 7% to 16% with 1.5 liter of inspiration.
Fig. (4) to Fig. (8) show the individuals and average resistivity changes in the five selected areas for the upper electrode plane, the middle electrode plane and the lower electrode plane as a function of inspired air volume of 0.5, 1.0 and 1.5 liter. These figures are displayed in two body positions and also show larger inter-individual variability in selected regions. The CVs are from 17% to 51% for the right lung, 11% to 35% for the left lung, and 12% to 45% for the total lung region. Two 8x8 regions show even greater variability. The CVs are 30% to 382% for area 1 and 32% to 245% for area 2, respectively.
The averaged resistivity changes and standard deviations in the selected five regions were also calculated for the repeated experiments in one subject to determine the reproducibility. The results show the CVs are less than 10%.
4. DISCUSSION
The results show the average resistivity change across both electrode positions and subject positions is 7-9% per liter of air. The direct lung measurements by Witsoe and Kinnen (1967) [6] show the lung resistivity change estimated by scaling data from dogs is approximately 18% per liter of air. The average value in this paper is about half of the direct measurement.
The average resistivity changes in five selected regions using different electrode planes and body positions showed that the local 8x8 pixel regions were more variable compared to the global regions of the right, left or total lung, as seen in Figs. (4-8). The results suggest the global region not the local region may give more consistent results. In the supine position, the differences in resistivity change caused by the different levels of air volume may be offset by the increasing perfusion, resulting in fluid volume change. With changes in posture, the distribution of ventilation and the pulmonary perfusion alter simultaneously [12]. Compared to sitting, perfusion and ventilation for supine tend to be more evenly distributed from the apex to the base of the lung. In Fig. (3), the average resistivity changes for the supine position in the upper and lower electrode positions reflect a more even resistivity changes, compared to sitting position.
Large inter-individual variability (CVs from 10% to 382%) is observed with air volume changes. The local regional measurements in some individuals caused a decrease in resistivity with inspiration. Fig. (9) shows an example for the negative resistivity measurements in the area 1 and 2 in the right lung. When the subjects inhaled, the resitivities in these areas should increase. The negative values may be due to the changes of electrode position. A simulation study using a Finite Difference human thorax model shows that EIT images are very sensitive to the changes of electrode position [13]. Any electrode repositioning during experiments may result in similar artifacts as shown in Fig. (9). During experiment, any movement of the shoulder may move the electrode up or down with the skin movement, especially for the superior electrode plane. During breathing, the chest will expand in anterior-posterior direction more than that in lateral direction, which will cause unequally spaced electrode positions.
Earlier studies [14-16] show the linear relationship between average resistivity change and air volume. As shown in Figs. (4-6), the non-linear behavior is seen from the end of expiration to 0.5 liter. This non-linear relationship may be caused in part by chest expansion. With inspiration from end expiration to 0.5, 1.0, or 1.5 liters, the anterior-posterior depth of the thorax increases 3.5%, 4.8%, and 5.2% while the lateral width decreases 1.7%, 2.5% and 3.1%, respectively (Fig. 10). The biggest change of the thoracic size occurs from end expiration to 0.5 liter, compared to those changes from 0.5 to 1.0 liter and from 1.0 to 1.5 liters. Adler et al. (1996) [17] studies show the chest expansion may cause 20% error in the center of EIT images. The averaged resistivity changes in the lung region caused by chest expansion were between 0.65 and 18.31% (Zhang and Patterson 2005) [18]. The influences of the expansion in the local regions such as area 1 and 2, which are away from the center of EIT image, are relatively small. This may be why the relationship for area 1 and 2 is more linear.
In Fig. (9), the middle anterior region of the images shows an unexpected significant increase resistivity with air volume, which was also found in Eyuboglu et al. study (1995) [19]. Based on the anatomical structure, the mid-anterior region of EIT image is in the region of the heart and should appear as a small or no-resistivity-change region, since there is little air flowing into this region. There are two possible reasons to cause the increased resistivity. The first reason is with inhalation, the organs and tissues in the thorax will move down. The tissue or organs changes occurred in anterior middle region is shown in Fig. (10). The four MR images in the same plane show the low resistivity cardiac tissue area decrease while higher resistivity lung tissue area increases with increasing air volume. The second reason is the electrode position change due to chest expansion. A simulation study shows that when moving an electrode toward/away from an adjacent electrode placed at the anterior, it will result in resistivity changes in the middle anterior region of the EIT image [13]. These structural changes are not considered in reconstruction algorithms.
In general, the EIT system produces cross sectional images of the distribution of lung resistivity change. However, the images are generated not only by the change within tissue, but other factors such electrode positions change related to lung geometry, and the movement of the organs. These factors introduce the variability in EIT images of lung ventilation. The variability may be mitigated by choosing appropriate electrode plane, body position and ROIs and/or by adjusting stimulation and measurement patterns [10]. Errors due to hardware imperfections (e.g., electrode movements) may also be accounted by EIT image reconstruction algorithms [20-23].
CONFLICT OF INTEREST
The authors confirm that this article content has no conflict of interest.
ACKNOWLEDGEMENTS
Declared none.

