All published articles of this journal are available on ScienceDirect.
Study on Bayes Discriminant Analysis of EEG Data
Abstract
Objective:
In this paper, we have done Bayes Discriminant analysis to EEG data of experiment objects which are recorded impersonally come up with a relatively accurate method used in feature extraction and classification decisions.
Methods:
In accordance with the strength of α wave, the head electrodes are divided into four species. In use of part of 21 electrodes EEG data of 63 people, we have done Bayes Discriminant analysis to EEG data of six objects. Results in use of part of EEG data of 63 people, we have done Bayes Discriminant analysis, the electrode classification accuracy rates is 64.4%.
Conclusions:
Bayes Discriminant has higher prediction accuracy, EEG features (mainly α wave) extract more accurate. Bayes Discriminant would be better applied to the feature extraction and classification decisions of EEG data.
1. INTRODUCTION
The purpose of routine brain wave inspection is to evaluate whether the brain wave is normal or not and provide help to diagnose the brain disorders which is also known as brain wave interpretation [1]. The traditional brain wave interpretation is realized through reading the multi-channel EEG on the recording paper by experts, which is to understand and evaluate electroencephalogram (EEG) with the method of visual inspection. The essence of this method based on expertise is that experts utilize experience to wipe out the disturbance and artifact of signals, conduct feature extraction to the EEG according to the frequency, range, phase position and other information, and carry out the category description for the extracted features with the recognized experience to analyze and evaluate the EEG [2]. Up to now, this method is widely applied to the clinic. The visual inspection, to some extent, can catch the pathological waveform or even confirm the position of the brain focus. However, due to the strong non-stationary and nonlinear characteristics of EEG, with the addition of the great dependence of visual inspection on knowledge-level and experience of EEG analysis personnel, the new method must be explored to realize the breakthrough of EEG research [3]. Bayes Discriminant analysis has been introduced into the research of EEG, which will actively promote the extraction and classification of EEG data to assist the inspection and quantitative analysis of EEG and provide the effective analysis means for the EEG examination.
2. OBJECTS AND METHODS
2.1. Object of Study
We take 28 men and 35 women as the research objects, whose age is ranging from 20 to 60, and the average age is 36.7. All the subjects are enjoying good health without serious nerve system diseases and history of taking psychotropic drugs, and they are selected from the normal population.
2.2. Build the Selection of Mathematical Modelling EEG Data
The sampling frequency of experiment recording of EEG is 100Hz which is recording 21 electrode data according to the lead location in international 10-20 system: C3, CZ, C4, FP1, FPZ, FP2, F7, F8, FZ, F3, F4, O1, OZ, O2, P3, PZ, P4, T5, T6, T3, T4 [4]. A block (indicating a short time period) of EEG data is acquired at every turn, and the number of sampling points for each block is 512 with the recording time of 5.12s [5]. The electroencephalogram of normal people is mainly in α rhythm, the strengths of wave appear in the occiput, and then weakening gradually from back to front. Classify the 21 conducting electrodes into 4 categories in accordance with the intensity differences of the α rhythm in various parts of the head, which is, former head electrode, side head electrode, central electrode, occiput electrode. The specific classification situation is as α follows [6]:
- The first category: central electrode (C3, CZ, C4)
- The second category: former head electrode (FP1, FPZ, FP2, F7, F8, FZ, F3, F4)
- The third category: occiput electrode (O1, OZ, O2, P3, PZ, P4, T5, T6)
- The forth category: side head electrode (T3, T4)
2.3. The Computer Processing of EEG Data
The electroencephalogram dedicated toolbox EEG Toolbox is designed with the MATLAB programming language in order to facilitate analyzing the original data of the electroencephalogram. In EEG Toolbox, after the original data was introduced, it was saved in the matrix, and line represents the timing of experiment recording (that is sampling point) while column indicates the electrode. All the data of every subject were introduced before analysis and the electroencephalogram should be shown intuitively, and a block of EEG data should be displayed on each page .
Note 1): The horizontal ordinate is frequency (Unit: Hz), while the vertical coordinate is voltage (Unit:µV), and the electrode parts have been marked on the left side of the data.
The 4 population Bayes discriminance classifies the sample data into 4 categories based on the electrode classification method introduced above. Firstly, put the 21 electrode EEG data which will build the mathematical models into the four matrixes
 on the basis of classification. Put the current block of EEG data into the Matrix X, which is 512×21 matrix. The electrode classification results are predicted with Bayes discriminance and expressed by putting them into vector.
Bayes discriminant analysis has obtained certain knowledge about the experiment object before sampling, which is described by the prior probability distribution. Based on the sample, the prior knowledge is modified. Statistical inferences can be drawn according to the obtained average misjudgment loss [7]. Bayes discriminant analysis in this study is based on multi-channel EEG. The first is to establish discriminant mathematical models (discriminant functions) and conducting classification judgment on head electrode data by c rules. Bayes discriminant analysis can be illustrated by the following formula:

c(j | i) is misjudgement loss, pj is prior probability, fi(x) is density function. Each block establish respective discriminant functions. Put head electrode data into four discriminant functions, getting minimum average misjudgment loss and applying it to the corresponding block.
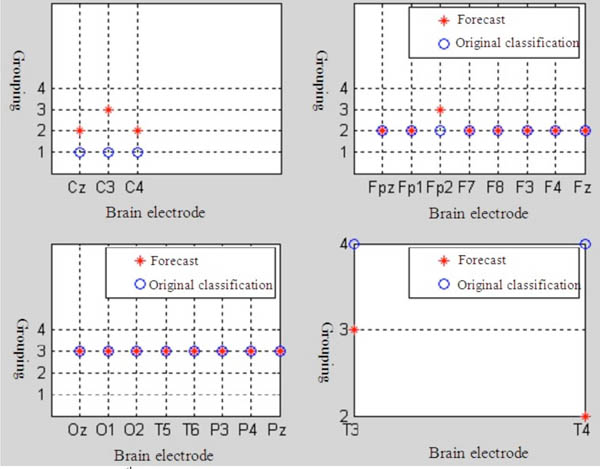
Through the established discriminant functions, prediction classification can be done on the head electrode data in each block. Prediction classification results, combined with actual classification, can be shown explicitly in the Figure (Bayes discriminant prediction results).
2.4. Bayes Discriminant Description
Bayes discriminant pseudo code:
Input: Present head electrode data.
Output: Bayes head electrode data classification prediction results head electrode data classification accuracy.
- Calculating block prior probability

- Assuming misjudgment into other losses

- Assuming the loss in the original classification is zero.

- Establishing block Bayes discriminant functions

- Assuming sample X as block minimizing

- Predicting head electrode data classification results, calculating head electrode data classification accuracy [8].
3. EEG DATA ANALYSIS RESULTS FROM BAYES DISCRIMINANCE
Classify the 21 conducting electrodes into four categories according to the intensity differences of α wave on various parts of the head, and forecast 21 electrodes classification conditions of six subjects in the current block with Bayes discriminance: C3, CZ, C4, FP1, FPZ, FP2, F7, F8, FZ, F3, F4, O1, OZ, O2, P3, PZ, P4, T5, T6, T3, T4. Draw the Bayes discriminance predicating result chart and 2D pie chart of Bayes discrimination displays the accuracy rate with Bayes discriminant procedure.
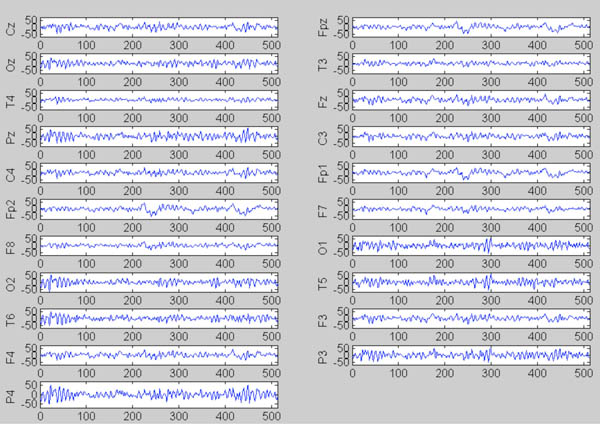
Bayes discriminant analysis procedure can forecast and classify the EEG data of all blocks for various subjects. Due to the space constraints, only the forecast results of the EEG data in six blocks for three subjects are given in detail, and the whole situation can be reflected by showing only classification results of two blocks for each subject, and the forecast classification results in other blocks are similar to these. Analyze the predicated results of one subject in detail. We number the 6 subjects for the sake of convenient description: 1, 2, 3, 4, 5, 6. First conduct the Bayes discriminant analysis for the 14th block of EEG data of Subject 3. The figure of EEG is shown in Fig. (1).
Note 1): The top left corner is the predicating results of the first–category electrode; the top right corner is the predicating results of the second–category electrode; the left bottom is the predicating results of the third–category electrode; and the bottom right corner is the predicating results of the forth–category electrode. 2): The horizontal ordinate is the names of various kinds of electrodes and the category is listed on the vertical coordinate. 3) red* represents the predicated classification situation, blue O indicates the actual category situation. * And O will coincide when the predicated classification is consistent with the actual classification. 4): first–category electrode(C3, CZ, C4), second–category electrode(FZ, F3, F4, FP1, FPZ, FP2, F7, F8), third–category (P3, PZ, P4, O1, OZ, O2, T5, T6), forth–category electrode (T3, T4).

EEG data of the 14th block of in subject 3.
Note 1): The horizontal ordinate is frequency (Unit: Hz), while the vertical coordinate is voltage (Unit:μV), and the electrode parts have been
marked on the left side of the data.
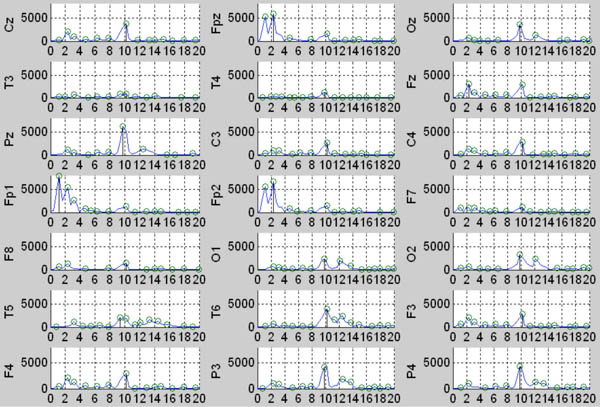
In present block, the first central area CZ is misclassified the third, the second electrodes F8 in front head into the fourth, the third T5 in rear head into the fourth, the fourth T3 in the side head into the first. From the predicted results, CZ is misclassified into rear head indicating CZ α wave is stronger than electrode wave in central area, F8 into side head indicating F8 α wave is stronger than electrode wave in front head, T5 into central area indicating T5 wave is stronger than electrode wave in rear head, T3 into central area indicating T5 wave is stronger than electrode wave in side head. The estimated spectral density for the current block (shown in Fig. 3) is retrieved by using psd function. The α wave of the first recipient is basically in agreement with natural law. CZ α wave is clearly stronger than the other two electrode waves in central area, similar to α wave in rear head. CZ misclassified into the third, α wave differs slightly when comparing F8 with electrode wave in side head, resulting in F8 misclassified into side head. T5 wave is weaker than electrode waves in rear head, resulting in T5 misclassified into central area. T3 α wave is weak, its superiority levels similar to electrodes in front head. That it is misclassified into the first may possibly be interrupted by frequency waves. The intensities of waves in electrodes showed spectral density estimates is basically in agreement with those in predicted results. α wave of the majority is strong, while waves in front head and side head are almost the same. Therefore, the predicted accuracy of rear head electrodes is high, and that of front and side heads i8s usually misjudged. The present block predicted accuracy rate of 80.9%. The results basically reflected the intensities of electrode α waves.
| Subject | 1 | 2 | 3 | 4 | 5 | 6 | Average Accuracy Rate |
|---|---|---|---|---|---|---|---|
| Accuracy Rate | 66.7% | 63.2% | 64.2% | 63.5% | 65.4% | 63.1% | 64.4% |
Carry out the Bayes discriminant analysis for the 6 subjects, and randomly extract 10 blocks of EEG data for every subject to predict classification. The Bayes predicating results is shown by Fig (2). The average accuracy rate is 64.4% (shown in Table 1). On the whole, the forecast results of Bayes discriminance are better; the extraction of the EEG characteristics (mainly α wave) is relatively accurate. The predicating results can reflect the intensity differences of wave α in various parts of the head. To some extent, the occurrence rate or amount of wave α, namely, the quantity of wave α recorded in the EEG within a certain period of time, has huge differences in individuals. The forecast results are influenced by such situations where wave α constantly appears in some people and sporadically in other people, or when other frequency waves appear. The indifference can also be caused by the amplitude modulation and right-and-left difference.

Bayes predicating results of the 14th block in Subject 3.

The PDF of the 14th block in Subject 3.
CONCLUSIONS
Because Euclidean is oversimplified, and the absolute and Chebyshevy can not completely express the characteristic differences of the multidimensional data in the high-dimensional space, therefore, we usually analyze the EEG data with Bayes discriminance in experiments. Classify 21 conducting electrode into four categories according to the intensity differences of the wave α in every part, build Bayes discriminance mathematical model with 21 brain electrode data, and conduct the Bayes discriminant analysis to the EEG data of 6 normal subjects (Fig. 3). The predicating classification accuracy rate is 64.4%. On the whole, the predicating results of Bayes discriminance is better, the extraction of EEG characteristics (mainly wave α) is more accurate, and the predicating results can reflect the intensity differences of wave α on the various parts of the head. The experiment indicates that Bayes discrimination can preferably extract the EEG characteristics of normal people and can be applied to the classification decision of EEG data.
The EEG of normal people presents α rhythm and wave α is the major EEG characteristic of normal people. The predicating classification results of different blocks are not completely equivalent, which reflects that the EEG is a non-stationary random signal and wave α is constantly changing. The amplitude modulation phenomenon, left-and-right difference and individual differences in subjects will exert an influence on predicating classification of EEG data and cause the indifference. We analyze the reasons for indifference of the electrodes as follows [9]:
- Bayes discriminant analysis has obtained certain knowledge about the experiment object before sampling, which is described by the prior probability distribution. Based on the sample, the prior knowledge is modified. Statistical inferences can be drawn according to the obtained average misjudgment loss. We calculate the prior probability in accordance with the principle of “allocation on percentage”. The number resulted from the prior probability ensured by the trained limited samples which was influenced by the mathematical models of head electrode data, which will affects classification results.
- To certify the discriminant loss: We assume discriminant i into j a fixed number as 1 and I into i as 0. Actually, discriminant loss can be different because of different electrodes into different classifications. Accurate functions can not be established for lack of knoledgment about discriminant loss.
- The individual difference of head electrode: Different recipient head electrode signals verify in waves, frequencies, wave forms, thus each head electrode signal of each block is also different. Like Mahalanobis distance discriminant and Fisher discriminant, Bayes discriminant prediction classification can not get rid of head electrode individual difference, which leads to discriminant of head electrode classification.
CURRENT & FUTURE DEVELOPMENTS
In this paper, we have done Bayes Discriminant analysis to EEG data of experiment objects which are recorded impersonally come up with a relatively accurate method used in feature extraction and classification decisions. Methods In accordance with the strength of α wave, the head electrodes are divided into four species. In use of part of 21 electrodes EEG data of 63 people, we have done Bayes Discriminant analysis to EEG data of six objects. Results In use of part of EEG data of 63 people, we have done Bayes Discriminant analysis, the electrode classification accuracy rates is 64.4%. Conclusions Bayes Discriminant has higher prediction accuracy, EEG features (mainly α wave) extract more accurate. Bayes Discriminant would be better applied to the feature extraction and classification decisions of EEG data.
CONFLICT OF INTEREST
The author confirms that this article content has no conflict of interest.
ACKNOWLEDGEMENTS
Declared none.


