All published articles of this journal are available on ScienceDirect.

3-D Volumetric Evaluation of Human Mandibular Growth
Abstract
Bone growth is a complex process that is controlled by a multitude of mechanisms that are not fully understood.Most of the current methods employed to measure the growth of bones focus on either studying cadaveric bones from different individuals of different ages, or successive two-dimensional (2D) radiographs. Both techniques have their known limitations. The purpose of this study was to explore a technique for quantifying the three dimensional (3D) growth of an adolescent human mandible over the period of one year utilizing cone beam computed tomography (CBCT) scans taken for regular orthodontic records. Three -dimensional virtual models were created from the CBCT data using mainstream medical imaging software. A comparison between computer-generated surface meshes of successive 3-D virtual models illustrates the magnitude of relative mandible growth. The results of this work are in agreement with previously reported data from human cadaveric studies and implantable marker studies. The presented method provides a new relatively simple basis (utilizing commercially available software) to visualize and evaluate individualized 3D (mandibular) growth in vivo.
INTRODUCTION
Bone growth is a complex process involving biochemical and physical stimuli, and is not yet fully understood. The process is further complicated considering that bone is a dynamic structure undergoing significant remodelling over the course of its life. Remodelling is the process of the deposition and resorption of the bone through specialized bone cells. The growth of bone is due to a faster rate of deposition over resorption, resulting in a gradual increase in size as time progresses [1]. The driving mechanisms of bone growth are a function of diet, physical stress, and a time dependant growth component [2]. The physical stress component has been exemplified in experiments showing that varied mastication stresses due to the consistency of foods “markedly affect the mandibular condylar cartilage growth and mandibular morphology” [3]. It is because of these complex time dependent functions regulating bone growth that an all-encompassing theory has yet to evolve. Furthermore, the evaluation of mandible growth, either experimentally or theoretically, is very complex due to the geometric shape and significant bone drifting of the mandible [4]. It is therefore necessary to investigate methods to accurately determine the geometric changes of bones as they grow. This will give much needed insight into growth for paediatric surgeons conducting craniofacial surgery [5], orthodontists requiring detailed growth information, and the validation of theoretical growth models [2].
A significant hurdle to overcome in the investigation of growth is the separation of growth and bone drift. Bone drift can be classified as either primary or secondary displacements. Primary displacements describe the relative movement of a bone due to its normal growth. On the other hand, secondary displacement is the movement of a bone caused by enlargement of neighbouring bones and/or their soft tissues. The mandible is subjected to significant primary displacements due to its growth displacing the relative position of the symphysis (most anterior part of the mandible). Secondary displacement is very significant and is primarily caused by the growth of the maxillary and temporal bones [4]. By comparing the overall shape changes of the mandible removed from the anatomical context we can circumvent the complexities of secondary displacements.
Historically the growth of the mandible is presented in two possible forms: a longitudinal patient data set using implantable markers in strategic positions extracted using radiography [6-9] to measure cephalometrics, and secondly, using poly-patient cadaveric specimens to create average growth projections [4, 10]. The idea of using 3-D "anatomic truth" using medical imaging modalities started in the 80s with 3D landmark extraction, and was furthered by the combination of standard cephalometric radiographs and photographic data to produce a "3D matrix" [11]. At this point, the inadequacies of conventional cephalometrics analysis (CCA) in determining accurate and interpretable results were being elucidated in literature due to inherent complexities of 3-D land marking and quantification [12]. An interesting development to the mapping of mandible growth using morphometrics, as opposed to CCA using distances and angles, involves the ordinal arrangement of homologous boundary points –often developed with an Elliptical Fourier transform to map growth point by point [13-15].
The use of modern 3-D imaging techniques to evaluate mandible growth is not new, as demonstrated by Togashi et al. who used a helical CT scanner on a dry skull to determine needed resolutions to achieve a <5% error on various 3-D cephalometrics [16]. This concept was pushed further by Cevidanes et al. who used high resolution MRI scans to determine resultant direction of growth and qualitative 3-D growth visualizations positioned with skeletal landmarks [17, 18]. The advantages of using CBCT, as opposed to costly (and lengthy, considering the required resolution) MRI scans, is obvious. Stratemann et al. demonstrates the possibility of using CBCT to measure 3-D growth using surfaces aligned with landmarks [19]. The aforementioned history illuminates the trend of demanding high technological imaging methods to perform cephalometrics to gain a better and more accurate understanding of mandible growth.
Medical software packages (MATERIALISE MIMICS version 13, Leuven Belgium) allow the creation of 3D virtual models in the form of triangular mesh called an STL (stereolithograph) from threshold segmented images. The STL format is a popular format due to ease of readability and physical meaning of the codes used to create STLs [20]. The creation of 3-D virtual models has been shown to be a powerful clinical technique; whether used for comparing 3-D anatomic surfaces [19], creating 3-D representations for surgical problems [21-23], or streamlining the fitting and creation of medical implants [24]. The Corresponding STL files from successive years are compared using software techniques utilized for rapid prototyping object verification similar to Russett et al. [25]. This method allows for the production of a 3-D deviation map between two virtual models.
The 3D comparison of mandibles has been performed in various contexts in literature. For example, it has been used tocomparedeviations in mandibles to a defined normal [26], while other studies used longitudinal scans to create a linear growth model [5, 27]. The advantage of using the following method is that we are able to visualize the direction and magnitude of bone growth in 3D by a simple subtraction of two surfaces - consequently providing clinicians and developmental biologists with a minimally laborious procedure that illustrates bone growth from regular dental data. The produced 3D growth maps have been argued to offer a level of information un-obtainable from 2D measurements or qualitative descriptions [26]. We hypothesize that the growth data obtained from surface-to-surface subtraction from CBCT scanning will be in agreement with previously reported cadaveric studies presented in facial growth handbooks. The aim of this study was to evaluate 3D mandibular growth for one individual based on CBCT data obtained for regular orthodontic treatment as a proof of principle for future clinical and developmental biology use.
MATERIALS AND METHODS
Computerized Tomography Scans
The study consisted of two consecutive CBCT (I-CAT system) scans of an adolescent male patient between 2008 and 2009 (the patient was aged 8-10). The scans used had been taken for use as regular orthodontic records and his parents consented to use his CBCT scans to study mandibular growth. Three dimensional visual models were created from CBCT images from each year using the software package MATERIALISE MIMICS (Version 14, Plymouth, U.S.A). No attempt at alignment or registration was completed due to post alignment techniques that were already implemented on these scans.
Preliminary 3-D Geometries
The CBCT images used are 12-bit (4096 grey values possible per pixel) pixel maps that illustrate the X-ray attenuation coefficient of the tissue [28]. Each mandible CBCT data set used in this study consisted of 440 slices spaced 0.3mm apart, with an in plane pixel size of 0.3mm – yielding a voxel (3-D “pixel” made by stretching a pixels over its associated parallel slice thickness) with a volume of 0.027mm. These measurements are well within tolerance values discussed by Togashi et al. [16]. The CBCT data sets were then imported into MIMICS for preliminary 3D geometry creation. The program MIMICS initially scales the images to the Hounsfield scale, which sets the attenuation of water to zero. Using the Hounsfield scale the minimum pixel value is -1024, representing the attenuation of air [28]. The estimated pixel values using Hounsfield units (HU) that represent trabecular and cortical bone are 150-250 HU and 251-2100 HU respectively. Threshold segmenting and connected-components algorithm was conducted similar to Meehan et al. [23]. To ensure scientific conformity, the same pixel threshold values of 226 HU to 2042 HU were used when threshold segmenting the data sets. This was possible on our scans due to similar attenuation characteristics throughout; however, if required, regional thresholds can be joined as demonstrated by Stratemann et al. [19]. Segmentation creates a highlighted region of interest called a mask (Fig. 1). The initial estimated mask volume of the 2008 scan is 34.7 cm3 while the estimated mask volume of the 2009 mask is 34.8 cm3. The mean values of the 2008 and 2009 masks were both 838 HU; while the respective standard deviations of the mean HU values were 459 HU and 435 HU. The two CBCT scans contained image artifacts surrounding a lower lingual arch (a dental appliance attached to the mandibular teeth). Artifacts of this nature are due to the photoelectric effect and the high relative atomic number of the appliance. This affects the apparent attenuation of the surrounding tissue, because most of the beam is removed by the photoelectric effect in the lower lingual arch. This creates missing information when the CBCT data is back projected causing gross anomalies. Thus in accordance with Bibb et al., the affected regions were removed to ascertain a better 3D representation [21].
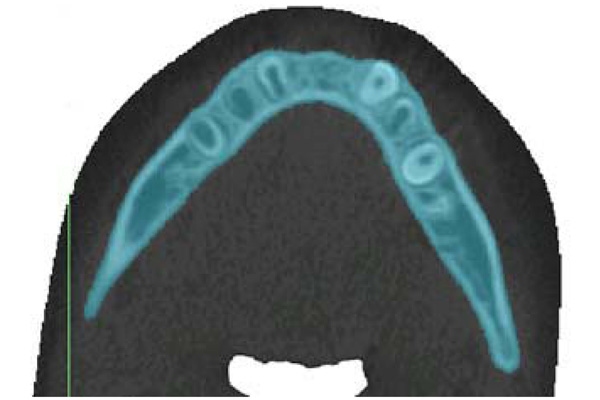
Sample of threshold segmentation highlighting the region of interest, using Materialise: MIMICS. This slice is the inferior portion of mandibular body (transverse plane).
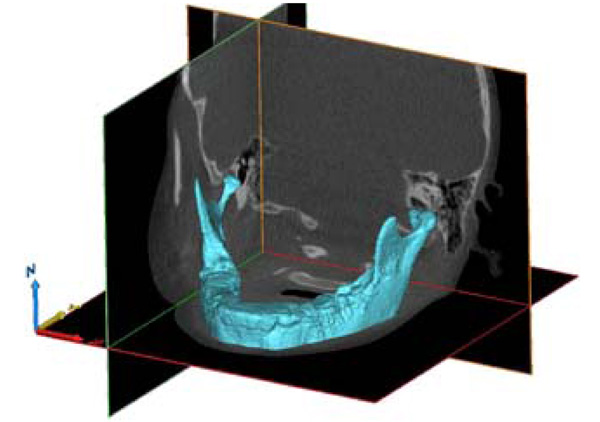
3-D model of the mandible, using Grey Value Interpolation, with all Photoelectric artifacts removed.
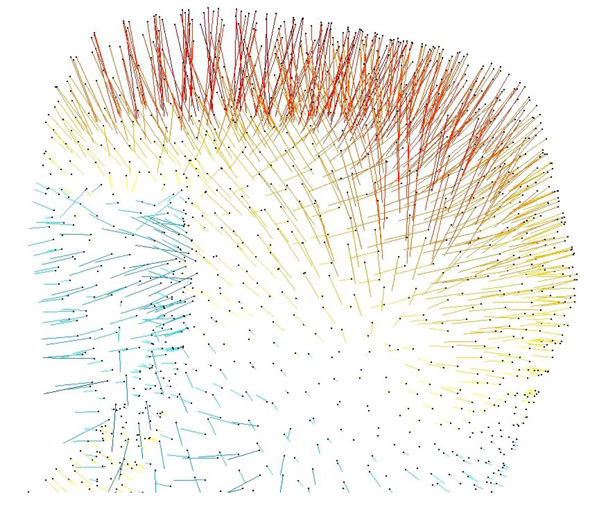
3-D vector map, on the right condyle, illustrating deviations of the surface meshes from the 2008 to 2009 models. Red-yellow indicates a positive change between nodes on the surface mesh, blue-green indicates a negative change.
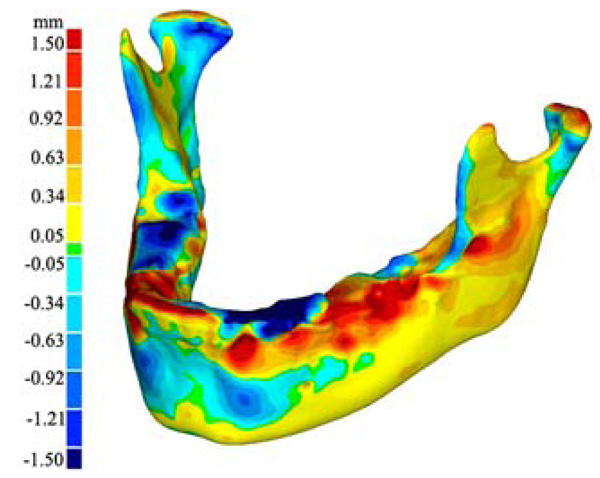
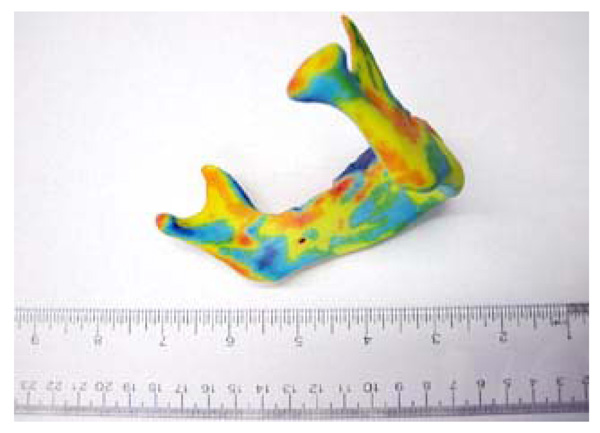
Virtual model of the 3-D growth map. The colour map (legend to the left) indicates the magnitude of change (in mm) of the 3-D surface from the 2008 model to the 2009 model.
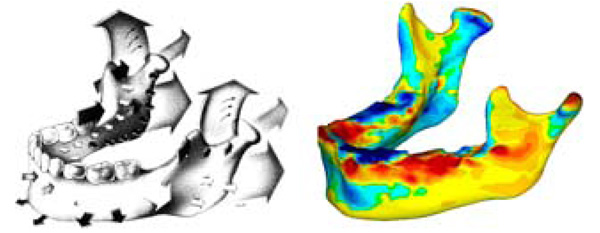
Study growth map (right) shown to be in conformity to similar maps found in literature [4] (Left). The arrows contained in the literature sample indicate relative growth direction and magnitude using the relative size and direction of the arrows. The colour map of the growth map image is the same as in figures 4 and 5. As seen, our growth visualization shows inward growth near the symphysis (upper chin) with outward growth along bottom of chin, body and ramus. Additionally, in both visualizations, the proximal side of the ramus show resorption whilst the distal side shows deposition. An interesting detail poorly captured in literature is the resorption anterior to the condyle, making the process more pronounced.
Reprinted with permission from D. Enlow, R. Moyers, and W. Merow, Handbook of Facial Growth., W.B. Saunders Company, 1982. Copyright Elsevier.
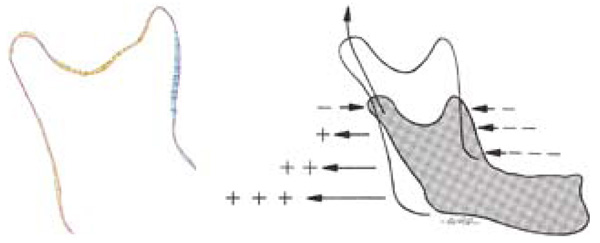
Sagittal views of the ramus, the study model on the left and the literature [4] sample on the right for comparison. Bluegreen on the study model represents resorption, and yellow-red represents deposition, using the same numerical scale for the relative growth as Fig. (4 and 5).
Reprinted with permission from D. Enlow, R. Moyers, and W. Merow, Handbook of Facial Growth., W.B. Saunders Company, 1982. Copyright Elsevier.
MIMICS was then used to calculate a 3-D object, from the default menu, for the two associated masks using pre-defined high quality settings that preserve the integrity of the virtual models (see Fig. 2). A grey value interpolation scheme was used to account for partial volume effects in the voxels. This produces a surface that is generally more accurate versus a contour interpolation method. The contour method draws contours on the boundaries slice by slice, interpolating linearly between each slice, hence ignoring partial volume effects between the contours. The 3-D virtual models were then smoothed using a voxel based technique with an existing MIMICS algorithm to preserve calculated volumes. Preservation of 3-D volumes were verified by comparing before and after volumes. Implementation of the same algorithm on each of the scans ensured minimal subjectivity. In contrast to other literature on mandible segmentation [23,26], there was no manual segmentation implemented – as manual segmentation is time consuming and prone to errors. MIMICS is then used to export STL files of the two 3-D models.
3-D Geometry Analysis
The two STL files were imported into GEOMAGICS STUDIO/QUALIFY (Version 11, Research Triangle Park, U.S.A), a 3-D suite that was built for optimizing and comparing 3-D objects to a reference object. Within the STUDIO suite, the STL file was optimized by removing noise in the form of protruding vertices and localized holes (using the built in mesh-doctor feature). Typically, anomalies are formed due to a combination of noise in the CBCT image and the interpolation algorithm used to create the triangulated mesh. At this step any excessive deformations in the area of the teeth affected by the X-ray artifacts were removed manually. This was deemed acceptable as the teeth region would not be used for data analysis. Then, the mesh was rewrapped with new triangles using a built in algorithm, this ensured the triangles on both visual models were equal in size – important for comparing the models. The rewrapping tool in STUDIO calculates new vertices of each facet, in efforts to produce equivalent triangle sizes, based on the local curvature and Voronoi diagram indices.
After wrapping with similar triangles, the virtual models were imported into GEOMAGICS QUALIFY. In comparing the two mandible models, the 2008 model was set as the reference and the 2009 model was used as the comparison. The two virtual models were aligned using a built in algorithm for best fit. The algorithm sets the 2008 object as a fixed model, and works in two stages by floating the 2009 object. First stage fitting uses a small number of points (300) from similar locations on each object to simulate gross growth. The second stage uses a larger sample of points (1500) to make fine adjustments to best-fit the models, analogous to a least squares best fit algorithm. The reported average error from the alignment was inflated to 0.452mm due to anomalies in the teeth region. It was determined that increasing the sample size of the best-fit algorithm does not significantly improve the fit of the two objects (0.01mm improvement in error for every extra 1000 points). This post alignment method eliminates the need for CBCT alignment during scanning. Other methods include using a list of landmarks [7, 19, 29], or bypassing the alignment step altogether by quantifying a series of measurements to compare between virtual models [3].
The artifacts that affected the region of the teeth produce a small effect on the alignment of the two virtual models. However, the effect is limited due to the relatively small surface area covered by the teeth region (less than 4%). Following the alignment, the two objects were compared by an illustration of the 3-D deviation of the two virtual models, creating a growth model. A 3-D deviation map (Fig. 3) was computed, using built in features of QUALIFY, by measuring the orthogonal distance from the vertices of the reference object (2008 virtual model) to the float object (2009 virtual model). To ensure a realistic computational time, the maximum result point count was limited to 2 million data points. Table 1 illustrates the output parameters from the 3-D comparison. It should be noted that the maximum deviation of 4.34mm was inflated due to the teeth region, but is reported here for completeness. The 3-D comparison colour growth model is exported as a VRML file (Virtual Reality Modeling Language), as this format allows the embedment of colour within the 3-D mesh.
Output of 3-D Model Comparison Parameters from Geomagics: Qualify
| Max Deviation | 4.34 mm |
|---|---|
| Average Deviation | 0.418 mm |
| Standard Deviation | 0.64 mm |
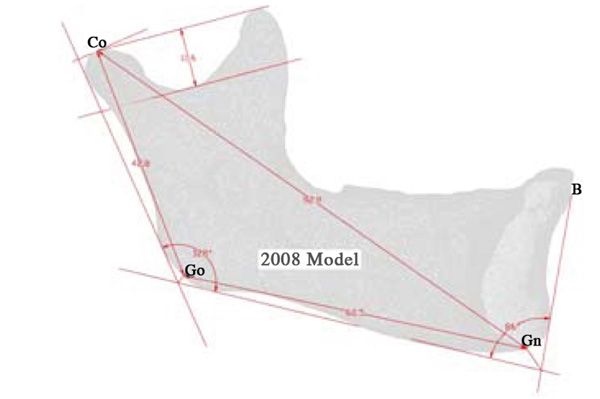
Landmarks and their Descriptors, Used to Evaluate the Growth of the Mandible [29]
| Landmark | Abbreviation | Description |
|---|---|---|
| Condylion | Co | Superior tangent on the mandibular condyle determined from a perpendicular from the ramal plane |
| Gonion | Go | Point determined by the bisecting of the mandible and ramus planes |
| Ganthion | Gn | Point determined by bisecting the angle between the mandible plane and the symphysis plane |
| Point B | B | The point most posterior to a line joining the anterior-superior point on the mandible |
Results of Various Measurements on the Mandible, Incorporating Landmarks from Table 2, Comparing Models Generated From 2009 and 2008 CBCT Data Sets
| Measurement | 2008 (mm) | 2009 (mm) | Change (mm) | Rate (%/year) |
|---|---|---|---|---|
| Gonial Angle (Co-Go-Gn) | 128 | 128 | 0 | |
| Depth of Mandibular Notch | 10.6 | 10.9 | 0.3 | 2.8 |
| Corpus Length (Go-Gn) | 62.5 | 62.8 | 0.3 | 0.5 |
| Overall Length (Co-Gn) | 92.9 | 93.5 | 0.6 | 0.6 |
| Ramus Height (Co-Go) | 42.8 | 43.3 | 0.5 | 1.2 |
Comparison
Several 2D parameters are used to describe the growth of the mandible by defining landmarks using planes and bisected angles [29]. These landmarks have been used in order to compare to literature, as well as to display some of the data possible with this kind of analysis. Table 2 presents the landmarks and succinct instructions on how to find them.
3-D Printing
The growth study is followed up with the creation of a 3-D physical model, a novel and unique way to visualize the growth of the mandible. A growth map from the study was printed on a colour 3-D printer utilizing a rapid prototyping technique similar to Russett et al. [25], allowing a “graspable” physical model representing the growth of the mandible over a year. This was accomplished using the VRML file, which allows a 3-D printer to print the surface mesh with associated colours. The production of a physical model has great benefits for the use of explaining and conveying information.
The 3-D printing system used is a Spectrum Z™510 colour 3-D printing system manufactured by Z corportation (Burlington, U.S.A). The printer works in the same way most 3-D printers operate, in which a printer head selectively hardens thin layers of plaster duster with a sugar-water binding agent. The innovation of colour 3-D printing comes in the binding agent, where four separate print heads contain four binding agents: clear, cyan, magenta and yellow. Selective use of binding agents to harden regions of plaster allows the printing of 24 bit full colour models. Each layer of the model hardened by the binding agents is 0.1mm thick, with a maximum resolution of 600 x 540 dpi (www.zcrop.com).
Results
The results of our pilot study include a three dimensional virtual model of the 3-D deviation of the jaw between 2008 and 2009 (Fig. 4). In addition to the virtual model, a 3-D physical model was printed (Fig. 5). The physical model illustrates the same growth map as the virtual model and allows for easy viewing and in depth analysis. Additionally seen in Fig. (5), is our visualized growth model compared with Cevidanes et al. virtual model [18].
Fig. (6) shows a comparison of our growth map with predicted growth from literature [4]. Literature data is taken from cadaveric specimens of different ages at death thus showing an average relative geometry change [4]. Recorded growth from literature has shown by a series of arrows displaying the relative shape movement of the mandible as it grows, the size of the arrows representing the magnitude of growth over time. In our in vitro growth study, the growth is illustrated by a quantitative colour map. Fig. (7) shows a comparison of the 2008-2009 cross sectional growth from the study, compared with literature cross sectional growth data. From Fig. (7), we can see general conformity with the models and of the literature values [4, 10].
Maximum recorded growth (ignoring the areas affected by the artifacts) between the 2008 and 2009 virtual models is 1.67 mm on the condyle, while the maximum resorption is 1.0 mm adjacent to the symphysis (most anterior part of the mandible). The overall width of the mandible, measured from the medial side of the condyle, increased by 0.49mm - an increase of 2.8% over the year. Table 3 is data obtained by comparing the indices defined by aforementioned landmarks [29]. In addition to the data presented in Table 3, there is another angle formed between the corpus and the symphysis plane that remained constant at approximately 85 degrees. Fig. (8) illustrates various 2D parameters superimposed on a sagittal view of the 2008 mandible model, showing the landmarks used to extract the data [29].
DISCUSSION
The purpose of this study was to evaluate an effective way to model 3D individual growth of a mandible. This was performed by the surface comparison of two virtual models created from readily available software. Our two models were created from imaging data spaced one year apart (2008-2009) taken on a CBCT machine used for routine orthodontic records. The 3-D models of mandibular growth created from CBCT scans are in agreement with previous reports on mandibular growth, see Fig. (6) [4, 10] and Fig. (5) [18]. Our method created a visualization, which has the same regions of growth as predicted from literature, with the advantage of an incorporated colour map, which provides additional information.
Bones Drift
The growth discussed in our study is the 3-D orthogonal difference obtained from two CBCT scans aligned using a best-fit algorithm, and thus the growth map does not take into account the drift effects from secondary displacements. Therefore, our model represents the overall shape change of the mandible, and is not a representation of how the mandible grows in its anatomical position. This is evident in examining the condyle region of our printed mandible, in which you can see significant relative growth. The actual growth pattern is expected to be as such: the ramus grows lengthwise forcing the downward growth of the body of the mandible. When comparing to the literature, this is an important distinction, as the common source of relative growth information of the mandible is based on averaged cadaver studies. These cadaver studies are conducted with multiple specimens of different individuals, illustrating the shape change of the mandible removed from anatomical context – thus making it easy to compare with our study. The studies also included vector information (Fig. 6), which can be easily obtained by a longitudinal study that tracks the displacements of chosen landmarks. However, this vector growth information represents the relative displacements of points and faces the issue of choosing homologous points in 3D space, which is something our proposed method aims to circumvent. Furthermore, our study compares the entire surface of the mandible, not the relative movement of landmarks, and thus can make use of an easily implemented best fit alignment algorithm. According to Stratemann et al., the transition from landmarks to our method, utilizing superimposition of entire surface-rendered 3D images, will enable objective comparisons [26].
Mandible Growth
Overall mandibular growth is relatively small compared to literature [15], but this is likely due to the decelerated growth in our studied jaw after the first growth spurt (age 9-10). Our study showed that the condyles grew outwards laterally (2.8%) over the course of the year. The outward growth of the condyles is expected due to the addition of material to the symphysis allowing the mandible to open progressively in a 'V' shape. It is thought that the outward condylar growth is due to pressure induced by the lateral growth of the maxilla [4].
The increased depth of the mandibular notch can be argued to be due to the gradual increase of forces on each side of the notch by the growing temporaral and lateral pterygoid muscles [4]. The coronoid process is pulled upwards as a result of the forces of the temporalis muscle, causing a general elongation of the process. The condyle is loaded through the TMJ joint, and as such its growth is thought to be a response to this significant induced stress. The general understanding is that the forces of mastication have a large impact on the shape of the mandible, and are thoroughly discussed in the literature [3, 4, 10].
The gonial angle (mandible angle) remained constant at 128 degrees throughout the course of this study (1 year). The expected result is that the gonial angle will decrease as time progresses [4, 10], at the average rate of less than a degree a year [29]. It is likely that our study did not span over a long enough time to track a change in mandibular angle of that magnitude. A gonial angle of 128 degrees reflects an average angle, as a typical gonial angle varies from 140 degrees at birth to 120 degrees at maturity [10].
The corpus length increased by 0.3mm, a change of 0.5%, while the ramus height increased by 0.5mm, a change of 1.1% over the course of the study (1 year). No known values at this age have been found for these measurements, although a reported trend is that these values tend to increase [4, 29]. The overall length defined earlier increased by 0.6mm over the year. This is expected as it is the hypotenuse of the corpus length and ramus height, both of which increased in dimension.
The importance of using graspable objects instead of virtual reality objects on a computer screen is summarized in literature [20, 30, 31]. The embedment of colour on our 3-D model illustrating the growth between the two models is, to our best knowledge, the first time an accurate physical representation of mandible growth has been accomplished. A physical model is ideal for determining general growth, while the virtual model allows numerous measurements and accessible visualization.
CONCLUSION
A model of the growth of a mandible was created by producing 3-D files from two CBCT scans taken one year apart. The growth model created showcases the growth over the course of one year by comparing the 3-D deviation of two separate models created from the CBCT data from corresponding years. Recorded growth from literature (based on commonly used statistical averages of cadaveric specimens) illustrated the same trends as our growth model. The produced 3-D visualization provides a numerical growth map, which provides a level of understanding beyond 2-D measurements or qualitative descriptions. Furthermore, our model, and similar 3D growth models [18, 19], represent individual in vitro growth, versus the poly mandible growth determined from cadaveric specimens at different ages. Additionally, our model has the advantage of being readily obtained through commercially available software and avoiding issues with selecting a collection of 3-D landmarks.
The advantage of having numerical growth data with a convenient way to showcase the results has important clinical and academic applications. Clinically, making accurate growth predictions using CBCT dental scans can provide more in-depth information, contribute to the early detection of problems, or formulate a treatment plan and potential outcomes. Furthermore, numerical details can be recorded annually on a patient-by-patient basis, tracked, and compared with statistical normals, leading to an in-depth analysis of a patient’s growth. The statistical normal for growth can be determined by the same method using many patients over many years, creating a normal yearly growth trend. Academically, accurate growth measurements lead to insights in validating growth models.
ACKNOWLEDGEMENTS
Permission to reprint figures obtained from Elsevier for the follow work:
D. Enlow, R. Moyers, and W. Merow, Handbook of Facial Growth., W.B. Saunders Company, 1982.

