All published articles of this journal are available on ScienceDirect.

Blood Pressure Estimation from Wavelet Scalogram of PPG signals using Convolutional Neural Networks
Abstract
Introduction
In this work, calibration-free blood pressure estimation using wavelet scalograms of PPG signals using Convolutional Neural Network (CNN) has been proposed. The PPG signal, easily obtained from a subject, serves as a reliable indicator for predicting blood pressure (BP).
Methods
The proposed methodology involves employing Continuous Wavelet Transform (CWT) scalograms of the PPG signal as inputs for the CNN. Two distinct architectures for BP estimation are explored: one employing regression with a fully connected neural network and another utilizing CNN with Support Vector Regression (SVR).
Results
The results demonstrate superior BP estimation with the CNN-SVR architecture. With the CNN-SVR model, the Systolic Blood Pressure (SBP) and Diastolic Blood Pressure (DBP) are estimated with a Root Mean Square Error (RMSE) of 6.7 mmHg and 8.9 mmHg, respectively.
Conclusion
The proposed CNN-SVR model gives 52% better estimation error performance in SBP estimation compared to a machine learning model reported in a previous work.
1. INTRODUCTION
Blood pressure is the force exerted on the walls of arteries due to the blood flow. It is measured in terms of systolic blood pressure and diastolic blood pressure. Systolic and diastolic blood pressure are the highest and lowest blood pressure values in a cardiac cycle. The normal BP value for an adult is 120/80mmHg. Hyper- tension, defined as SBP ≥ 140 mmHg or DBP ≥ 90 mmHg, poses a significant health risk [1]. Globally, hypertension is a major contributor to cardiovascular diseases (CVDs), responsible for 32% of deaths [2]. According to recent data, the death rate from cardiovascular disease associated with hypertension has been rising, notably in individuals between the ages of 35 and 64. Rising rates have been observed in over 75% of counties, with Black and male populations being the most affected [3]. Additionally, a thorough analysis showed that the burden of cardiovascular diseases associated with hypertension has significantly increased among young adults worldwide, with middle-income countries bearing the brunt of the burden and men dying at a higher rate than women [4]. In India, hypertension accounted for over 2.48 million deaths in 2015 [5]. Chronic hypertension conditions directly contribute to 21% of Peripheral Vascular Disease and 24% of Acute Myocardial Infarctions [5]. Given that hyper- tension often exhibits no early symptoms, regular, continuous blood pressure monitoring facilitates early detection and allows for timely medical interventions or lifestyle changes, effectively preventing subsequent CVDs. Numerous physiological factors, such as the health of the brain, kidneys, cardiovascular system, and death rates, are significantly impacted by hypertension. Hypertension is linked to brain organ damage, which raises the risk of dementia and causes cognitive deficiencies [6, 7, 8]. In people without a history of kidney disease or cardio- vascular events, newly diagnosed hypertension dramatically raises the risk of these events, particularly if the diagnosis is made before the age of 55, which also affects mortality rates [9]. One of the main risk factors for heart disease, stroke, heart failure, renal failure, and unfavourable pregnancy outcomes is hypertension, which adds significantly to the worldwide disease burden [10]. Reducing these risks and enhancing health outcomes need effective management of hypertension with lifestyle modifications and antihypertensive drugs [7, 8, 10].
The gold standard for blood pressure (BP) measurement involves the use of a sphygmomanometer, employing an auscultation method. In this technique, a cuff is securely wrapped around the upper arm, and a stethoscope is gently placed over the brachial artery. The cuff is then rapidly inflated to a pressure 30 mmHg above the systolic blood pressure (SBP). Subsequently, the cuff pressure gradually deflated. As the cuff pressure aligns with the SBP, subtle Korotkoff sounds become audible through the stethoscope, resulting from turbulence in the blood flow as the artery is partially occluded. The Korotkoff sounds cease once the cuff pressure falls below the diastolic blood pressure (DBP) [11]. The method of BP measurement requires a trained professional and cannot be used for continuous monitoring. Moreover, as this method is cuff-based, this method is unconvertable if the blood pressure has to be measured multiple times.
Modern blood pressure machines, widely used in clinical and household settings, utilize oscillometric methods. This approach shares similarities with the sphyg- momanometer, except that it does not rely on auscultation. Instead, it gauges pressure oscillations in the cuff during turbulent blood flow as the cuff pressure gradually decreases [12]. While both techniques involve the use of a cuff, they are not ideal for continuous blood pressure monitoring.
Cuff-based technologies for continuous blood pressure monitoring have limitations, including physical pain, inconvenience caused by cuff pressure, and a limited capacity to record blood pressure variations between intermittent readings [7]. Furthermore, to overcome these limitations, cuffless blood pressure measurement systems have been developed, employing different techniques such as pulse wave analysis and pulse transit time to provide continuous and non-invasive monitoring [9, 13]. These cuffless devices can measure blood pressure continuously without the inconvenience of the cuff pressure, which is a critical feature for the early detection of cardiovascular illnesses [9]. The disadvantage of these techniques, which use ECG and PPG signals, is that they require calibration, which must be repeated after a certain period to maintain the estimation accuracy. However, research is being done to find new ways to improve the accuracy and reliability of cuffless devices, especially using machine learning and deep learning techniques [8]. The accuracy of cuffless BP estimate models is still a major concern. A study [10] highlights the continuous attempts to build precise and dependable cuffless BP monitoring systems for a variety of patient groups, using customized models based on features from BP sensor data, which can greatly enhance accuracy compared to generalized models. The generalized models trained using large datasets enable the calibration-free BP estimation. In this work, a generalized BP prediction model is proposed using CNN and CNN-SVR architecture, for which the wavelet scalograms (Time-Frequency domain) of a PPG signal are used as inputs. Unlike other Machine Learning (ML) models, where the features from the signal have to be extracted manually to give input to the ML model, in the proposed model, the CNN layers extract the features from the processed PPG signal, which are used by the subsequent fully connected layers to predict the BP values.
The paper is organized as follows. Section 2 presents the works reported in the literature that are related to BP estimation. Section 3 deals with the methods used in this work for the BP prediction. Section 4 discusses the results of the proposed CNN, CNN-SVR model, and compares it with existing works. Furthermore, section 5 gives the conclusion of this work.
2. RELATED WORK
The early research in cuffless blood pressure estimation focuses on techniques with subject-specific calibration. These techniques often extract one or more features from the physiological signals and establish a linear or non-linear relationship between the features and BP parameters. In [14], a feature, Pulse Transit Time(PTT), which is an indirect measure of the pulse velocity, has been derived from ECG and PPG signals. An inverse linear model relating the PTT and BP parameters has been established and is fitted with a subject-specific calibration. With the PTT-based model, the estimation error was computed as Mean Error (ME) ± Standard Deviation (SD), which has been reported as 0.6 ± 9.8 mmHg and 0.9 ± 5.6 mmHg for systolic blood pressure (SBP) and diastolic blood pressure (DBP), respectively. Similarly, in a study [15], along with the PTT, another feature derived from the PPG signal, Pulse Intensity Ratio (PIR), is used for BP prediction. It has been established that the PIR is inversely proportional to the DBP and Pulse Pressure (PP) is computed using the PTT. With the subject-specific calibration, the PTT+PIR-based model yielded ME ± SD values of -0.37 ± 5.21 mmHg and -0.08 ± 4.06 mmHg for SBP and DBP, respectively.
Although there are drawbacks, pulse transit time (PTT) has been thoroughly investigated for its potential in non-invasive blood pressure estimation. Research has revealed differences in the agreement and correlation between arterial tension measures from cuff-based ambulatory blood pressure monitoring and PTT [16]. Concerns have also been raised concerning the accuracy of PTT measurements in calculating blood pressure due to the inclusion of the pre-ejection period (PEP), particularly when population-based models are used for estimation [17]. Although PTT has been suggested as a continuous, non-invasive technique for tracking blood pressure beat-to-beat, its shortcomings in precisely measuring blood pressure have been brought to light, particularly in situations where blood pressure ranges are not constant [18].
The feasibility of these cuff-less techniques is impacted by the limits of calibration-based blood pressure (BP) estimation, which include the requirement for frequent and subject-specific calibration [19]. Conventional techniques, such as the one point-to-point (oPTP) calibration, are less sensitive and can produce inaccurate estimates [20]. Calibration-free BP estimate techniques developed using machine learning algorithms improve the BP estimation performance even in ambulatory conditions [21].
There are many studies that have reported the use of Artificial Intelligence for blood pressure prediction. In a study [22], along with the PTT features, PPG features are also included in various regression models to predict blood pressure. It is reported that the Support Vector Regression (SVR) model has given better prediction with Mean Absolute Error (MAE)± Standard Deviation (SD) as 7.52±9.54 mmHg and 6.34±8.45 mmHg for SBP and SBP, respectively.
In a study [23], ECG and PPG signals are used to extract the time domain features like Pulse Arrival Time (PAT), Heart Rate (HR), Augmentation Index, and whole-based features. The extracted features are used as inputs to the regression models for predicting the SBP and DBP. The Calibration-free estimation errors (MAE) achieved are 11.17±10.09 and 5.35±6.14 mmHg for SBP and DBP, respectively. Among the different regression models, Ada, Boost, and Random Forest models perform better in terms of estimation errors.
A study [24] explored diverse machine-learning techniques for blood pressure prediction using time-domain features extracted from ECG and PPG signals, employing the Physionet [25] MIMIC-II database [26]. Initially, 43 features derived from ECG, PPG, and a combination of both signals are used to develop the ML Models. The ratio between the minimum and maximum amplitude of the PPG signal (Photoplethysmogram Intensity Ratio (PIR)), maximum amplitude of the PPG signal (Ih), minimum amplitude of the PPG signal (Il), AC amplitude of the PPG signal (Meu0), Systolic time(St), and Diastolic time(Dt), are the few features extracted from PPG signal. Similarly, time-domain features extracted from ECG include various components such as the PR interval, QRS complex, heart rate, amplitude of P, Q, R, S, T waves, QR interval, RR interval, TQ interval, QT interval, corrected QT interval based on heart rate, Systolic diastolic interval (SDI), and SDI adjusted for heart rate. The features, PTT, Pulse Arrival Time (PAT) are derived from PPG and ECG signals combined. The estimation performance of various ML techniques was evaluated with and without feature set reduction. The Random Forest regression method was identified as providing more accurate estimations, with a Root Mean Square Error (RMSE) of 13.83 mmHg and 6.8 mmHg for SBP and DBP, respectively. The authors show that feature set reduction using Genetic Algorithm (GA) has improved the estimation results. This work showed that it is not the number of features but the selective set of features that improve the model estimation performance.
The results reported in this paper have been taken for the comparative analysis as it uses the extensive hand-engineered features from ECG and PPG signals for BP prediction. Recently, in a study [27], a hybrid CNN-SVR model has been proposed for the BP estimation using the ECG and PPG signal. The mean Estimation error reported in this work is 1.23 ± 2.45mmHg and 3.08 ± 5.67mmHg for SBP and DBP, respectively. These results are well within the AAMI standard for BP measurement. In our work, we have also investigated the BP prediction using the CNN-SVR model. However, our investigation is to make the CNN-SVR model, which only takes the PPG signal for the BP prediction, as many wearable devices only support the PPG measurement.
The blood pressure prediction models in few studies [22-24] relied on manually engineered features, introducing a dependency on the expertise of the feature extractor. The performance of machine learning models using these features is intricately tied to the proficiency of the individual crafting them. Convolutional Neural Network (CNN)-based feature extraction has demons- trated comparable performance to state-of-the-art hand-engineered features in EEG analysis [28, 29]. A study [30] reported the transfer learning approach for the ECG signal classification. In this study, 2D wavelet scalograms of ECG signals have been used to train pre-trained networks to detect whether the ECG indicates Normal Sinus Rhythm (NSR), Centre coronary Heart Failure (CHF), or Arrhythmia (ARR). Embracing automatic feature extraction for time series signals, particularly those conveying time-frequency information such as spectro- grams or scalograms, has been shown to enhance the performance of feature extraction and, consequently, the overall estimation. This approach mitigates the reliance on manual feature engineering, offering a more automated and potentially more robust solution for blood pressure prediction.
3. METHODS
3.1. Blood Pressure Estimation Using Wavelet Transform of PPG Signal and CNN Regression
This study focuses on estimating blood pressure parameters, specifically systolic blood pressure (SBP) and diastolic blood pressure (DBP), through the application of CNN regression. Furthermore, the photoplethysmography (PPG) signal serves as input for the CNN regression model employed in blood pressure estimation. The time domain PPG signal transforms into a Time-Frequency domain image through the application of Continuous Wavelet Transform (CWT).
In this work, only the PPG signal is taken for the blood pressure estimation as the deep learning model proposed here is intended to be used in the wearable device using a microcontroller like MAX78000, the Neural Network accelerator with an inexpensive PPG sensor. The neural network accelerator of MAX78000 supports 442k 8-bit weights, a programmable input image size of up to 1024 x 1024 pixels, and a network depth of 64 layers.
This section is structured as follows: Firstly, the dataset and its preprocessing steps are detailed. Subsequently, the architecture of the deep Convolutional Neural Network (CNN) employed for blood pressure (BP) prediction is explicated. The section concludes with a comparative analysis of BP estimation using machine learning techniques that leverage hand-engineered features with CNN-based feature extraction. Fig. (1) illustrates the two types of photoplethysmography (PPG) sensors and the typical PPG signal, featuring distinct points such as the systolic point, diastolic point, and a dicrotic notch.
3.2. Dataset
The dataset utilized in this study is taken from the UCI Machine Learning Repository, specifically curated for the PPG signal, akin to the arterial cuffless blood pressure (BP) measurement. This dataset incorporates preprocessed electrocardiogram (ECG), photoplethy- smogram (PPG), and intra-arterial blood pressure (IABP) waveforms extracted from the MIMIC-II database [26]. The preprocessing methodology is extensively detailed in reference [22].
The dataset encompasses PPG signals obtained from a finger plethysmogram and IABP waveforms sampled at 125Hz frequency. In total, there are 12,000 instances of PPG and IABP signals, with a subsection chosen for this study. Each recording is segmented into 24-second intervals, and systolic blood pressure (SBP) and diastolic blood pressure (DBP) are computed as the mean values of the maximum and minimum IABP values within each cardiac cycle, respectively.
Fig. (2) illustrates the distribution of systolic and diastolic BP target values in the training dataset. For model training, 80% of the total 27,102 PPG segments, along with their corresponding SBP and DBP values, are employed.
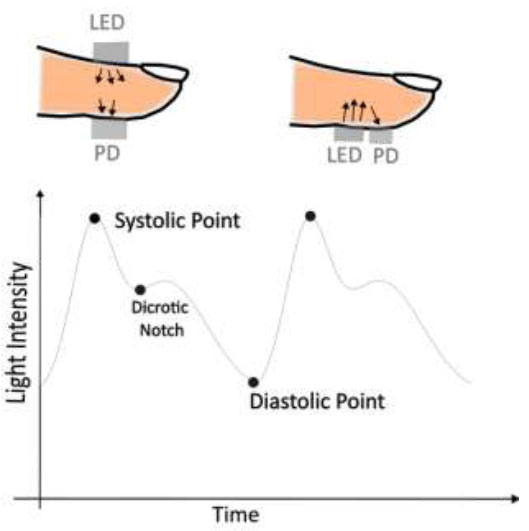
Transmissive and reflective type PPG sensor and PPG signal.
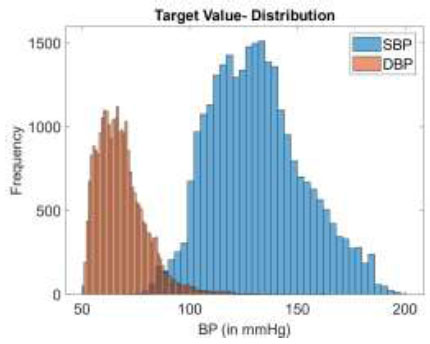
BP target value distribution in the data.
3.3. Data Preparation
The PPG signal, akin to the arterial blood pressure signal, exhibits distinct systolic and diastolic points. While the time domain signal captures the morphological features, it lacks frequency information. Fourier transform, on the other hand, offers frequency information but does not provide detailed time domain features. This limitation is addressed by the Continuous Wavelet Transform (CWT), represented by the following expression.
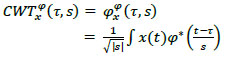 |
(1) |
Where ϕ* is the mother wavelet. In this study, the Analytical Morse wavelet is used as the mother wavelet. Analytical wavelets are preferred to analyse the oscillatory behaviour of signals or the time evolution of frequency transients [31]. The Analytical Morse wavelet, particularly the Generalized Morse Wavelets (GMWs), provides enhanced interpretability in contrast to alternative wavelets, such as Morlet or Gabor wavelets, which possess only an approximate analytic nature [32]. The GMWs demonstrate specific advantages in signal classification applications dealing with nonstationary oscillatory signals. Generalized Morse Wavelet (GMW) is used in multiple biomedical signal processing applications to process ECG, EEG, EMG, and PPG signals [33].
The Continuous Wavelet Transform (CWT) enables a thorough examination of time-frequency properties, rendering it well-suited for detecting short-lived occurrences and subtle changes in data. The capacity of CWT to offer insightful interpretations of signal attributes across different realms establishes it as a prominent option for constructing scalograms in a wide array of disciplines. The preference for CWT in scalogram creation arises from its efficacy in a variety of contexts, such as forecasting epilepsy seizures [34], monitoring cardiac health [35], and addressing other signal-processing problems [36, 37].
Fig. (3a) shows the PPG signal from the dataset and its corresponding wavelet coefficient image (Fig. 3b).
3.4. Convolutional Neural Networks
CNNs are widely used for feature extraction from image inputs as they have convolutional filters for extracting distinct features. Typically, in CNN, the features extracted from convolutional layers are fed to the fully connected layers for classification or regression tasks. In the biomedical domain, the usage of CNNs is studied in diverse areas such as blood pressure risk assessment [38] and echocardiogram analysis [39].
Convolutional layers employ filters to perform convolutional operations on the input images, extracting essential features. Pooling layers are utilized for downsampling and dimensionality reduction of features. The integration of batch normalization aids in mitigating internal covariate shifts, thereby expediting training processes [40].
The activation layer introduces non-linear trans- formations to the feature maps, enabling the network to learn intricate, non-linear relationships between input signals and desired outputs. This characteristic makes CNNs particularly effective in capturing complex patterns and relationships in biomedical data.
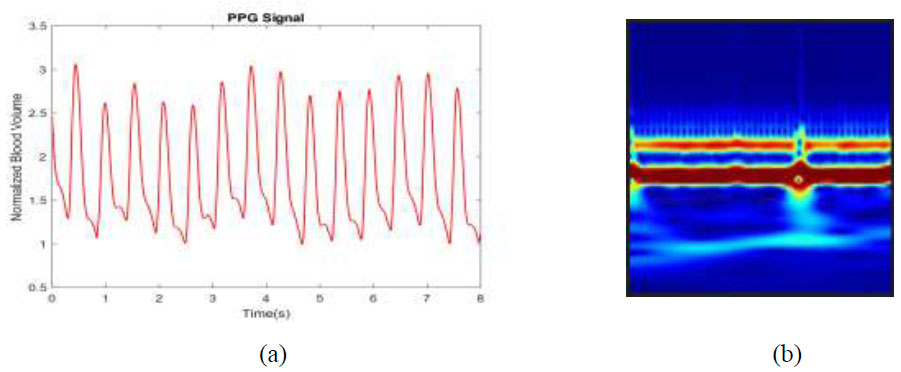
(a) PPG signal, (b) Corresponding wavelet coefficient image.
Fig. (4) shows the block diagram of the process of BP estimation from the PPG scalogram using CNN. The PPG signal undergoes segmentation into 24-second records, with segments shorter than this duration being discarded. Subsequently, the continuous wavelet transform is computed for these PPG segments, and the resulting coefficients are represented as a two-dimensional RGB image. Simultaneously, the arterial blood pressure (ABP) waveform is also segmented into 24-second waveforms.

BP estimation with CNN and PPG scalogram – process.
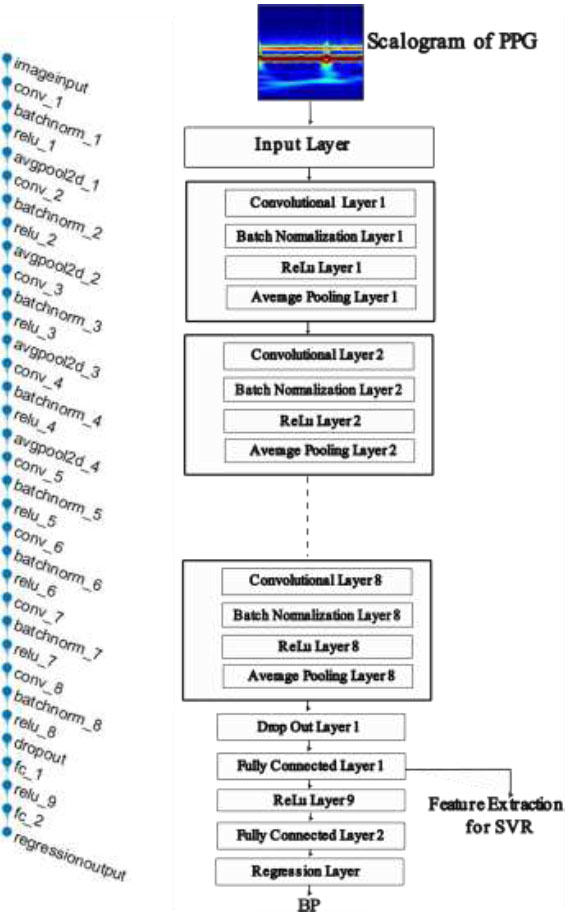
Layers of neural network architecture.
The peak and valley points in a cardiac cycle of ABP signal are measured as the SBP and DBP for that cardiac cycle, respectively. The SBP and DBP for the blood pressure waveform segment were calculated as the mean of the individually computed SBP and DBP for each cardiac cycle, respectively. These calculated SBP and DBP values are used as the target values of the neural network for the corresponding PPG segments. Fig. (5) shows the CNN model architecture, which consists of eight convolution layers and two fully connected layers.
The proposed method poses a challenge in its implementation in wearable devices due to its computational complexity. Though hardware accelerators are available for Neural Network inference, finding the wavelet scalogram of the streaming input signal increases the computational burden for a controller in wearable devices.
4. RESULTS AND DISCUSSION
The performance in terms of estimation error for the proposed CNN regression model and CNN-SVR hybrid model are compared with the performance of other BP estimation studies using machine learning algorithms. Unlike Neural Networks, machine learning techniques require features to be extracted from the raw signal or data and fed to the algorithm for possible classification or regression problems. A BP estimation study reported in a study [24] uses hand-engineered features derived from ECG and PPG signals. The reason for considering this work for comparative analysis is that we would like to compare the performance of the neural network-based automated feature extraction and the hand-engineered feature extraction. The work reported in a study [24] uses the extensive 43 features extracted from ECG and PPG signals. Moreover, the work reported in a study [12] used the same UCI dataset as used in this work. The authors of a study [24] have studied BP estimation performance with all features and with the subset of features selected using Genetic Algorithms (GA). Python implementations of the machine learning model and the features extracted for this study are readily given in a repository [41], which is used for the comparative analysis. In a study [24], the machine learning algorithms Linear Regression (LR), Support Vector Regression (SVR), and Random Forest algorithms are used for the BP estimation, among which the Random Forest algorithm is reported as the ML algorithm, giving better estimation performance.
For the training of the CNN architecture shown in Fig. (5), 80% of the total 27,102 PPG scalograms are used along with their target SBP and DBP values. The rest 20% is used for validation.
Table 1 shows the estimation performance of the machine learning algorithms, which gets the features derived from PPG and ECG signals as in [24], and the estimation performance of CNN regression and CNN-SVR hybrid model. Note that the entries in rows 1 to 3 of Table 1 are computed using the algorithm given in the studies [24, 41]. From the estimation errors given in Table 1, it is observed that the CNN-SVR hybrid model performs better than other AI algorithms. Table 2 compares the estimation results of CNN-SVR with the results of other works. In a study [42], beat-to-beat blood pressure estimations for seven subjects doing breath-hold maneuvers, using Autoregressive Moving Average (ARMA) models, have been reported. The estimation error (RMSE) of the ARMA model has been reported as less than 7. In a study [42], PPG and BP waveforms are recorded from seven subjects, which are used for the development of the ARMA model. However, for successive five breath-holding intervals, five different models have been developed for each subject, and these models are used to estimate the SBP, DBP, and MBP. This work did not show the performance of the ARMA model in estimating the BP of subjects in the resting state with simple subject-specific calibration.
| S.No. | Algorithm | SBP (in mmHg) | DBP (in mmHg) |
|---|---|---|---|
| RMSE | RMSE | ||
| 1. | Linear Regression* | 19.64 | 13.99 |
| 2. | SVR* | 19.81 | 14.12 |
| 3. | RF* | 18.08 | 13.41 |
| 4. | CNN Regression | 15.289 | 9.6821 |
| 5. | CNN SVR | 6.699 | 8.9728 |
| Study/Refs. | Participants |
Gold Standard |
Signal type (number of features) |
Error (mmHg) |
|---|---|---|---|---|
| Alex et al. [42] | 7(3:M, 4:F) | Volume Clamp | PPG(2) | RMSE < 7 |
| Zadi et al. [43] | 15(18:M, 7:F) | Volume Clamp | PPG(2) | RMSE < 8 |
| Chandrasekhar et al. [44] | 35 | ABP | PPG(4) | MES = 9 MED = 8 |
| Liu et al. [45] | - | ABP | PPG | SBP: 8.54±10.9(SVR) DBP: 4.34±5.8 (SVR) |
| Geerthy T et al. [24] | - | ABP | PPG & ECG(22/17)* | RMSE SBP: 13.83; DBP: 6.0 |
| This work | - | ABP | PPG |
RMSE SBP: 6.7; DBP: 8.97 |
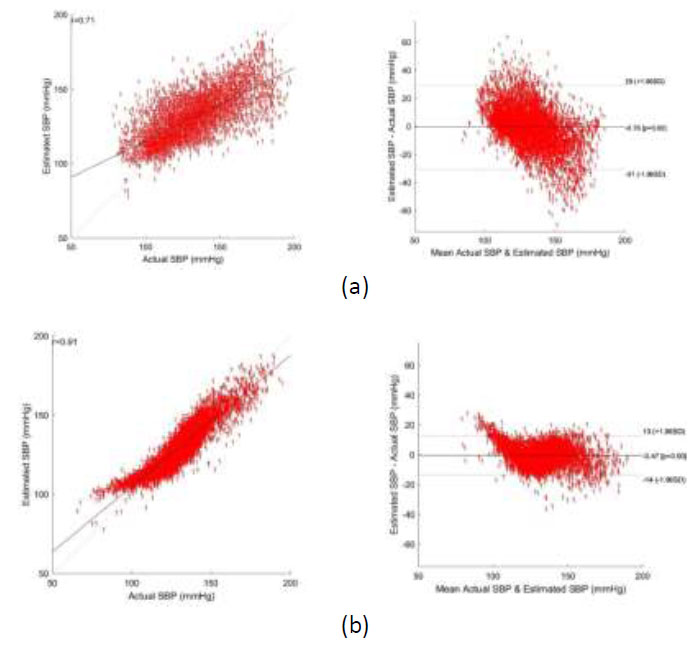
Bland altman plot of SBP - (a) using CNN regression, and (b) using CNN-SVR regression.
In a study [43], the same authors reported blood pressure estimation for 15 subjects, achieving an estimation error of less than 8 mmHg during the breath-hold maneuver. The method uses subject-specific calibration, which typically needs to be repeated after a certain time. In a study [44], the oscillometric finger-pressing method has been used to estimate the BP using a smartphone. When the user presses his/her finger against the smartphone, the external pressure is applied to the artery in the finger. When the pressure is gradually increased, at a certain point, the pressure oscillations grow in magnitude till the mean blood pressure and then start damping down, similar to the oscillations that occur in the cuff-based oscillometric method. The algorithms are developed in smartphones to obtain the SBP and DBP values. The smartphone app visually guides the user to increase finger pressure. The advantage is that it is a simple cuffless oscillometric finger press method for BP estimation. However, the device is not tested as per AAMI protocols, and the method cannot be used to measure the nighttime BP, which is clinically important. In a study [44], features extracted from the photoplethysmogram (PPG) signal and arterial pressure oscillations were utilized to predict blood pressure for 35 subjects, with invasive arterial blood pressure (ABP) measurements as the reference. The reported mean errors for systolic blood pressure (SBP) and diastolic blood pressure (DBP) in that study were 9 and 8, respectively.
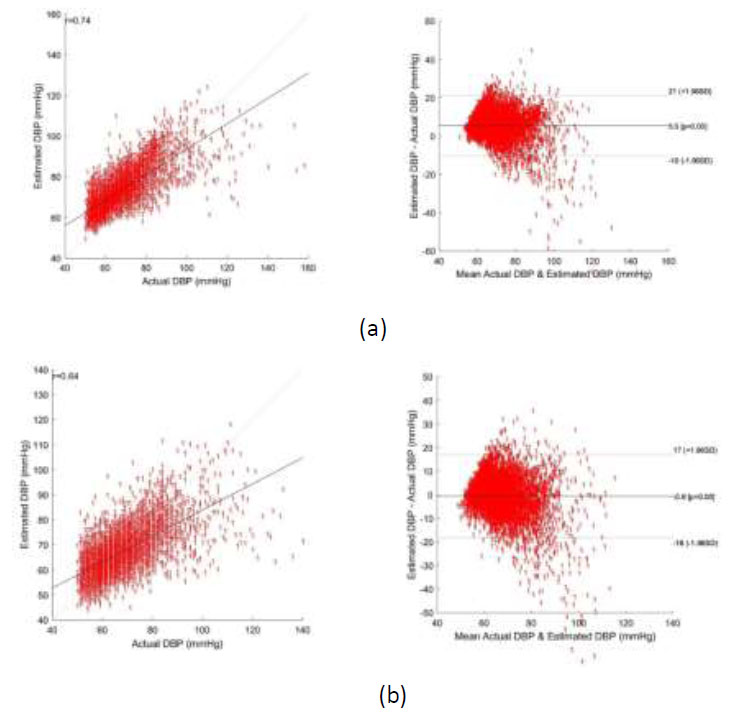
Bland altman plot of DBP - (a) using CNN regression, and (b) using CNN-SVR regression.
In another study [45], 35 PPG and the second derivative of PPG (SDPPG) features were employed in the Support Vector Regression (SVR) model for blood pressure estimation. This work also uses the hand-engineered features of PPG and SDPPG for the BP prediction.
Deviation (RMSD) reported is 10.9 mmHg for SBP and 5.8 mmHg for DBP. In our work, utilizing CNN-SVR for SBP estimation, the RMSE is 6.7 mmHg, lower than the error reported in a study [45]. Nevertheless, the proposed CNN-SVR estimation demonstrates the advantage of feature extraction using CNN directly from the raw signal, contributing to its efficacy in blood pressure estimation. The work performed in a study [24] uses the same dataset as our work and uses both ECG and PPG signals for feature extraction, and a Genetic Algorithm (GA) is used for feature reduction. GA is used to reduce the total 43 features into 22 and 17 features that are used for SBP and DBP prediction, respectively. This work is taken for the comparative analysis with our work as it uses extensive hand-engineered features derived from ECG and PPG signals. It should be noted that our work uses only the PPG signal for the BP prediction.
Bland-Altman plots depicting the agreement between the predicted and reference systolic blood pressure (SBP) and diastolic blood pressure (DBP) values using CNN Regression and CNN-SVR are shown in Figs. (6a,b and 7a,b). From these figures, the Mean Error with Standard Deviation is observed as -0.47 ± 6.87 mmHg for SBP and -0.6 ± 8.88 mmHg for DBP estimation utilizing the CNN-SVR regression model. Notably, the correlation coefficients stand at 0.91 for SBP and 0.74 for DBP in the CNN-SVR model, indicating a strong association between predicted and actual blood pressure values.
Though the model’s estimation error performance at the higher range of SBP and the lower range of DBP does not change significantly, the RMSE of the proposed CNN-SVR model at the lower range of SBP (65 mmHg -90mmHg) and the higher range of DBP (100 mmHg – 140mmHg) is observed as 18.19 mmHg and 30.59 mmHg. This clearly indicates that the estimation error of the model at a range other than the range specified above is lesser and at the range specified above will be higher.
CONCLUSION
This study reports the calibration-free cuffless blood pressure estimation from a single-site PPG signal using a CNN regression model and a CNN-SVR hybrid model. It compares the estimation performance of the proposed models with the machine learning models proposed in a study [24], which uses the hand-engineered feature set from ECG and PPG signals. The proposed CNN-SVR model outperforms the ML model in SBP estimation, although it uses only the PPG signal for BP estimation. Among the two models proposed, the CNN-SVR model provides better estimation performance with an RMSE of 6.7mmHg for SBP and 8.97mmHg for DBP. To the best of the author’s knowledge, this is the first study reporting the performance of CNN, and CNN-SVR model using a single site PPG signal. In the future, these CNN regression models can be synthesized as a model implementable in low-power microcontrollers with energy-efficient neural network accelerators such as MAX78000 [46]. Such implementations enable AI-based BP estimation in a battery-operated wearable device to become a reality.
AUTHOR’S CONTRIBUTION
The author confirms sole responsibility for the following: study conception and design, data collection, analysis and interpretation of results, and manuscript preparation.

