All published articles of this journal are available on ScienceDirect.

Lung Cancer Prediction and Classification Using Decision Tree and VGG16 Convolutional Neural Networks
Authors Info & Affiliations
Abstract
Introduction
A malignant abnormal growth that starts in the tissues of the lungs is called Lung Cancer. It ranks among the most common and lethal cancers globally. Lung Cancer is particularly dangerous because of its aggressive nature and how quickly it can extend to other areas of the body. We propose a two-step verification architecture to check the presence of Lung Cancer. The model proposed by this paper first assesses the patient based on a few questions about the patient's symptoms and medical background. Then, the algorithm determines whether the patient has a low, medium, or high risk of developing lung cancer by diagnosing the response using the “Decision Tree” classification at an accuracy of 99.67%. If the patient has a medium or high risk, we further validate the finding by examining the patient's CT scan image using the “VGG16” CNN model at an accuracy of 92.53%.
Background
One of the key areas of research on Lung Cancer prediction is to identify patients based on symptoms and medical history. Its subjective nature makes it challenging to apply in real-world scenarios. Another research area in this field involves forecasting the presence of cancer cells using CT scan imagery, providing high accuracy. However, it requires physician intervention and is not appropriate for early-stage prediction.
Objective
This research aims to forecast the severity of Lung Cancer by analyzing the patient with a few questions regarding the symptoms and past medical conditions. If the patient has a medium or a high risk, we further examine their CT scan, validate the result and also predict the type of Lung Cancer.
Methodology
This paper uses the “Decision Tree” algorithm and the Customised “VGG16” model of CNN for the implementation. The “Decision Tree” algorithm is used to analyze the answers given by the patient to distinguish the severity of Lung Cancer. We further use Convolution Neural Networks with a Customised “VGG16” model to examine the patient's CT scan image, validate the result and categorize the type of Lung Cancer.
Results
The “Decision Tree” approach for forecasting the severity of lung cancer yields an accuracy of 99.67%. The accuracy of the customized “VGG16” CNN model to indicate the type of Lung Cancer suffered by the patient is 92.53%
Conclusion
This research indicates that our technique provides greater accuracy than the prior approaches for this problem and has extensive use in the prognosis of Lung Cancer.
1. INTRODUCTION
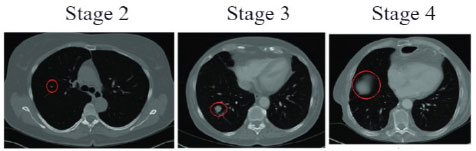
Lung cancer is a malignant abnormal growth that originates in the tissues of the lungs. It is one of the most prevalent and lethal kinds of cancer worldwide [1]. The primary danger of lung cancer lies in its aggressive nature and potential to disseminate rapidly to other parts of the body. Early detection of lung cancer is a major hurdle due to its relatively asymptomatic nature in the initial stages. By the time symptoms become evident, the disease would have reached an advanced stage. The growth of tumour size in the lungs is represented in Fig. (1), obtained from [2]. Therefore, accurately detecting lung cancer in its early stages is vital for administering the right treatment and potentially curing the patient. The prevalence of lung cancer cases has steadily increased in recent years. This trend is due to the complex interplay between various factors, encompassing individual behaviours and societal influences [3].
The prevalence of tobacco use remains the principal risk element for lung cancer. Additionally, environmental factors such as exposure to pollutants, airborne carcinogens, and occupational hazards have caused an upsurge in lung cancer cases. The above aspects, combined with genetic vulnerability, cause fatal problems. Furthermore, evolving lifestyle patterns, including changes in dietary habits and physical activity levels may indirectly impact lung cancer rates. Sedentary lifestyles and poor dietary choices can compromise immune function and contribute to chronic inflammation, fostering an environment facilitative to carcinogenesis. Our solution analyses the patient based on a few questions regarding the symptoms and the medical history. By diagnosing the answers, the model can predict whether the patient has a low, medium or high risk of lung cancer [4]. If the analysis indicates that the patient has medium or high risk, we further verify the result by examining the CT scan of the patient [5]. Therefore, our approach removes the need for a doctor factor at the initial stages and provides better accuracy compared to other solutions due to the two-step verification process. The chief application of this model is to help patients predict lung cancer and assist doctors with precise medical attention to the particular type of cancer.
There have been 180 articles published on this topic in the IEEE Xplore Digital Library in the past five years. In the PubMed - National Centre for Biotechnology Information Database, there are 60 articles published in the last five years. Although the topic has been thoroughly explored, we have found a research gap that is critical for the deployment of such models in real-world applications. X. Wang [6] proposes a method that accurately classifies “Whole Slide histopathology Images” (WSIs) of lung cancer. It outperforms previous methods with an accuracy of 97.3% on the dataset constructed in collaboration with “Sun Yat-sen University Cancer Centre” and an Area Under the ROC Curve of 85.6% on the public dataset from “The Cancer Genome Atlas.” The model proposed by W. Ausawalaithong’s proposal [7] underwent training using a dataset containing lung nodules, which was done before its training on the dataset. This yields an accuracy of 74.43%, a specificity of 74.96%, and a sensitivity of 74.68%. Notably, the model also generates a heatmap that can pinpoint the location of the lung nodule. Additionally, they effectively address the constraint posed by the scarcity of data in the dataset.
The work by A. S. Nath [8] employed about 25 attributes related to lung cancer factors and used classification algorithms such as “Naive Bayes,” “Bayesian network,” and “J48” to predict lung cancer. The performance analysis showed that the “Naive Bayes” algorithm took the least time to build the model. They also suggested that further enhancements and expansions can be made to the lung cancer prediction system by integrating other data mining techniques such as “time series,” “clustering,” and “association rules.” P. Das’s work [9] includes various segmentation methods including “Hopfield Neural Network,” “Fuzzy C-Mean” clustering algorithm, and “K-Nearest Neighbours” (KNN), to segment and classify lung cancer from the images. The accuracy of lung cancer detection using these techniques ranges from 89.5% to 99.5%. In the model proposed by the article, preprocessing, segmentation, feature extraction, and classification techniques were combined to create an automated lung cancer detection and prediction system. The paper explores the utilization of several machine learning algorithms and methods within the field of lung cancer research, aiming to enhance the accuracy of both prediction and classification tasks.
The best study on this topic is by P. Chaturvedi [10], which mentions the use of different imaging techniques such as CT scans, X-rays, and MRI scans, as well as the analysis of biomarkers and unusual symptoms in patients. The importance of different attributes in the dataset was analyzed, and machine learning techniques like “Support Vector Machines” (SVM), “Convolutional Neural Networks” (CNN), Enhancement of image, and processing of the image are mentioned as methods to boost the accuracy and help in the detection and classification process. This paper represents the most closely related work to the solution we are preparing to propose within the scope of this particular subject.
One of the key research areas in the prognosis of lung cancer revolves around diagnosing the patient with the help of a few questions about the signs of carcinogens in the lungs. The problem with this approach is that the accuracy of such prediction cannot be translated to real-world situations because the diagnosis is almost entirely based on the response from the patient. These responses may not always be affirmative as the answers are subjective from person to person. Another research area in this topic is predicting the existence of carcinogens through CT scan images. Although this approach gives accurate results, it involves the need for a doctor during the diagnosis to prescribe a CT scan. This method cannot be used for early-stage prediction as the patient is never advised to take a CT scan without serious symptoms. To tackle this problem, our team, Udit Krishna and Barath Lakshman, students of SRM Institute of Science and Technology, with a deep knowledge of various Machine Learning and Artificial Intelligence technologies and having dealt with several projects similar to the current situation, have come up with a solution under the guidance of Dr. Ayyadurai and Mrs. Archana, who have a rich publication experience and have mentored several students in their research.
This study aims to detect lung cancer accurately and help patients detect lung cancer at early stages. First, we ask the patient a set of questions regarding the symptoms such as cough, wheezing, yellow fingers, fatigue, etc. along with questions related to the medical history of the patient. Using the Decision Tree Algorithm, we then analyze the answers the patient has provided and categorize whether they have a low, medium or high risk. If the patient has a medium or a high risk, we collect the CT scan image. We process this image and then analyze it using a Customised VGG16 Convolutional Neural Network. Using this analysis, we further confirm the type of lung cancer, thereby assisting the patients at early stages and increasing the chances of a successful treatment. By achieving greater diagnostic accuracy than existing approaches, this two-step verification architecture offers a promising avenue for enhancing lung cancer treatment and potentially leading to better outcomes for patients.
| Column Name | Description | Values |
|---|---|---|
| Age | The age of the patient. | 14 - 73 (Numeric) |
| Gender | The gender of the patient. | M - 1 F - 2 (Categorical) |
| Air Pollution | The extent of the patient's exposure to air pollution. | 1 - 3 1 - Lowest 3 - Highest (Categorical) |
| Alcohol Use | The extent of the patient's usage of alcohol | |
| Dust Allergy | The extent of the patient's alertness to dust. | |
| Occupational Hazards | The extent of the patient's exposure to air pollution. | |
| Genetic Risk | The extent of the patient's genetic susceptibility. | |
| Chronic Lung Disease | The degree of chronic lung disease experienced by the patient. | |
| Balanced Diet | The extent of a balanced diet followed by the patient. | |
| Obesity | The degree of obesity of the patient. | |
| Smoking | The extent of the patient's smoking habits. | 1 - 3 1 - Lowest 3 - Highest (Categorical) |
| Passive Smoker | The degree of second-hand smoke exposure experienced by the patient. | |
| Chest Pain | The degree of chest pain experienced by the patient. | |
| Coughing Blood | The degree of blood while coughing is experienced by the patient. | |
| Fatigue | The degree of fatigue experienced by the patient | |
| Weight Loss | The extent of the patient’s recent weight loss. | |
| Shortness of Breath | The degree of shortness of breath experienced by the patient. | |
| Wheezing | The degree of wheezing experienced by the patient. | |
| Swallowing Difficulty | The degree of swallowing difficulty experienced by the patient. | |
| Clubbing of Finger Nails | The degree of clubbing of the fingernails experienced by the patient. | |
| Target Column | Severity of Cancer | |
| Description | The level of severity of carcinogen found in the patient. (Categorical) | |
| Values | Low, Medium, High | |
2. MATERIALS AND METHODS
The two datasets required for the implementation of the proposed model were obtained from Kaggle. The dataset required for forecasting the severity of lung cancer using several characteristics and symptoms is provided by The Devastator, Lung Cancer Prediction, Version 2. Retrieved August 2023 from https://www. kaggle.com/datasets/thedevastator/cancer-patients-and-air-pollution-a-new-link. This dataset contains 1000 unique entries about the conditions of numerous patients and their diagnosed risk of cancer. This data feeds into the training process of a decision tree model to foresight the severity of the carcinogen found in the patient's body according to the following parameters (Table 1).
The software required is Python for Data Manipulation and Coding, Scikit Learn for the implementation of the “Decision Tree Classifier,” and Jupyter Notebook for the integrative Python document. The “Decision Tree Classification” is a supervised machine learning technique that builds a tree-like structure to make decisions based on input features. In this tree structure, every inner node signifies a characteristic, each branch signifies a decision made at that node, and the terminal node signifies the class label. Decision Trees are easy to realize, and illustrate and quickly translate to a set of principles for production. However, this approach tends to overfit when the tree is deep. As the number of training samples grows, the decision tree algorithm may need to explore a larger number of potential splits, leading to increased computational complexity [11]. This model built on the training set yields an accuracy score of 99.67% on the test set.
| - | Adenocarcinoma | Large Cell Carcinoma | Squamous Cell Carcinoma | Normal |
|---|---|---|---|---|
| Train | 195 | 115 | 155 | 148 |
| Valid | 23 | 21 | 15 | 13 |
| Test | 120 | 51 | 90 | 54 |

Chest CT-Scan images Dataset. Mohamed Hany, Version 1 Retrieved August 2023, https://www.kaggle.com/datasets/mohamedhanyyy/ chest-ctscan-images?datasetId=839140. ODbL v1.0.


VGG-16 neural network architecture. J. Cano, “Accelerating Deep Neural Networks on Low Power Heterogeneous Architectures,” presented at the Eleventh International Workshop on Programmability and Architectures for Heterogeneous Multicores (MULTIPROG-2018), Jan. 2018. Available: https://eprints.gla.ac.uk/183819/
The dataset required for the prediction of the nature of lung cancer using the CT-Scan image is provided by Mohamed Hany, Chest CT-Scan images Dataset, Version 1 Retrieved August 2023 from https://www.kaggle.com/ datasets/mohamedhanyyy/chest-ctscan-images?datasetId= 839140. This dataset is used to train a customized “VGG16 Convolutional Neural Network” model to predict the three types of cancer found in the lungs, namely: “Adenocarcinoma”, “Large Cell Carcinoma”, “Squamous Cell Carcinoma” or the Normal Lung image. The categories of images contained in this dataset are listedin Table 2. An example of a CT-Scan image from each type of Lung Cancer is illustrated in Fig. (2). The software required is Python for Data Manipulation and Coding, TensorFlow for the implementation of Deep Learning and training the Convolutional Neural Network, and Jupyter Notebook for the integrative Python document.
“Convolutional Neural Networks” are used to reduce the number of parameters in Artificial Neural Networks (ANN). This enables us to solve complicated tasks which were not possible earlier. Low-level, simpler features are detected in the first few layers, and high-level, complex features are detected in the layers after that. Each layer in the network builds upon the previous layer's output, refining the information and ultimately generating the desired outcome [12-14]. Fig. (3) elucidates the formula for the convolution of a 2-D image ‘H’ with a 2-D filter (kernel) ‘F’ to produce an output G[i, j] where ‘i’ and ‘j’ are the indices representing the rows and columns of the output matrix G, ‘u’ and ‘v’ are the indices that represent the rows and columns of the image H, and ‘k’ represents the half-width of the filter F.
These convolutional neural networks are used in the “VGG16” architecture, which was developed by the “Visual Geometry Group” at the University of Oxford. VGG16 stands as a landmark in deep learning history, designed from the ground up for image classification. A sample VGG16 model is shown in Fig. (4), obtained from [12]. The Customised VGG16 model, which we designed specifically for this task, delivers a 92.53% accuracy in the validation set while training and an accuracy of 90.79% while testing.
In the base VGG16 Neural Network Architecture, we perform Batch Normalization [13] to normalize the output of the base VGG16 layers. This can help in avoiding overfitting of the model. Then, we add the pooling layer to pull out the most significant features of the convoluted matrix, reducing the memory needed for training the network [14]. The working of the Max-Pooling layer is illustrated in Fig. (5), obtained from [14]. Now, we flatten the matrix to reshape it into a column. Furthermore, we alternatively add Dense and Dropout to reduce the output to 4 classes, which is the tally of output classes in our dataset. The Dense layer is used to perform matrix-vector multiplication, reducing the number of outputs in the successive layers and improving the performance of the classification model [15]. Dropouts involve randomly deactivating a portion of the neurons within the network. When these neurons are deactivated, their connections, both incoming and outgoing, are also shut off. This is done to enhance the learning of the model [16]. This customized VGG16 model, shown in Fig. (6), is used to perform the Image Classification for the type of Lung Cancer present in the CT scan image.
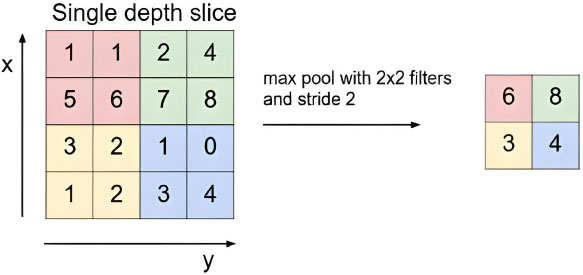
The max-pooling with 2x2 filter and stride 2 lead to down-sampling of each 2x2 blocks is mapped to 1 block (pixel). S. Albawi, T. A. Mohammed, and S. Al-Zawi, “Understanding of a convolutional neural network.” https://doi.org/10.1109/ICEngTechnol.2017.8308186.

Before feeding the training images into the model, several preprocessing techniques are carried out. The images are resized to 224,224 pixels and 3 colour channels and then converted to 32-bit floating-point numbers, a common format for deep-learning models. After this step, the VGG16-specific preprocessing function is applied to the images. The function swaps the first and third channels to convert RGB to BGR. This is because VGG16 was trained on images in BGR (Blue-Green-Red) channel order, while most image libraries use RGB. Moreover, the mean pixel values, which are calculated from the ImageNet dataset used for VGG16 training, are subtracted for each channel which centers the pixel values around zero, improving model convergence during training [17]. Additionally, several data augmentation techniques are applied during this preprocessing stage. The images are randomly rotated within a range of 10 degrees during training and randomly shifted vertically by up to 20% of the image’s height. The images are skewed diagonally by up to 20% and then randomly zoomed in or out of images by up to 20%. Data augmentation artificially expands the training dataset by creating modified versions of existing images [18]. These techniques help in the prevention of overfitting of the model. By exposing the model to more varied examples, it learns to generalize better to unseen data and not memorize specific image patterns. The model becomes more robust to variations in image orientation, position, scale, and other transformations, leading to better real-world performance.
While instantiating the VGG16 model, pre-trained weights from ImageNet are loaded alongside to provide a strong starting point for the image classification task. Additionally, the top fully connected layers are excluded to make way for transfer learning and feature extraction. Each layer of the VGG16 model is frozen, which prevents their weights from being updated while training [19]. The primary purpose is often for transfer learning. By freezing pre-trained layers, the feature extraction capabilities are leveraged while adding a new classifier on top of the specific task. This saves time and resources compared to training a CNN from scratch. The model can also be used as a fixed feature extractor. By freezing layers, the meaningful features from images are extracted without modifying the pre-trained knowledge. The model is trained using an Adam optimizer with a learning rate of 0.001. It is one of the widely used optimizers [20] in deep learning problems, which controls how much the model’s weights are updated during each training step. The model is compiled using the categorical cross-entropy loss function, which is used for categorical classification problems (multiple classes) and the evaluation metric – accuracy is tracked to evaluate model performance during the training of the model.
3. RESULTS AND DISCUSSION
The “Decision Tree” approach for the prognosis of the severity of Lung Cancer yields a 99.67% accuracy on the test set data. Fig. (7) displays the Confusion Matrix for the results mentioned. A “Confusion matrix” is a fundamental tool in the evaluation of classification models and summarises how well a classification algorithm performs by generating a visual representation of the model's performance based on the comparison between real and predicted labels [21]. Fig. (8) describes the Decision Tree [22] obtained from the training operation performed on the training set.
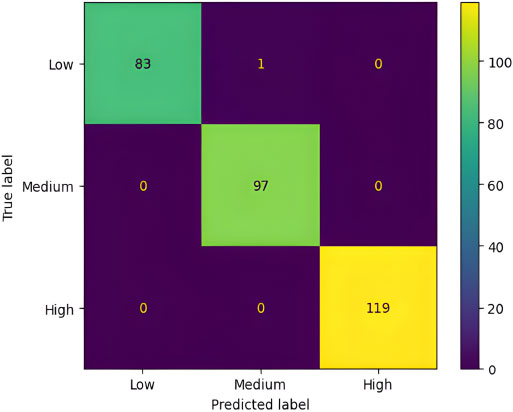

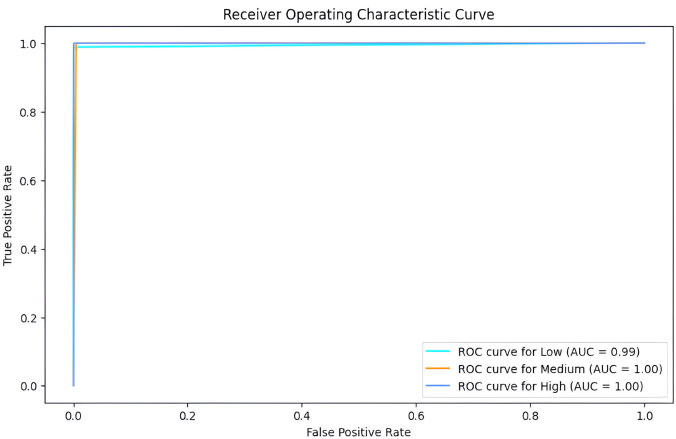
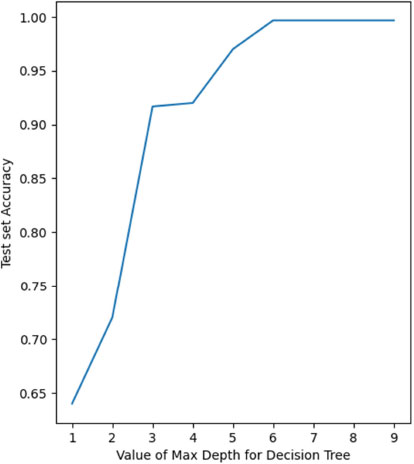
Fig. (9) represents the Receiver Operating Characteristics (ROC) [23] curve for the classification. ROC summarizes the trade-off between true positives and false positives for a classification model. In simpler terms, it shows how well the trained model can distinguish between the different classes in the data, considering both correct and incorrect predictions. It is particularly useful for choosing the classification threshold and understanding the model’s strengths and weaknesses. The ROC curve for the “Low” class is over 99% and 100% for the “Medium” and “High” classes. The ROC Area Under Curve (AUC) [24] is a single-value metric derived from the ROC curve that summarizes the overall performance of the classification model. The ROC AUC for our decision tree model is about 99.72%. Fig. (10) depicts the test set accuracy value for the decision trees constructed using different values of maximum depth – from 1 to 10, as part of Hyper-parameter tuning. Since the value is maximum from 6 and above (at 99.6%), we choose 6 instead of the higher values to avoid overfitting.
While applying k-fold cross-validation [25] for the decision tree obtained with maximum depth 6 on the test set, we get satisfactory results. This shows that the model is not overfitting since there is very little deviation between the acquired accuracy values. The accuracies for all 5 folds are represented in Fig. (11).
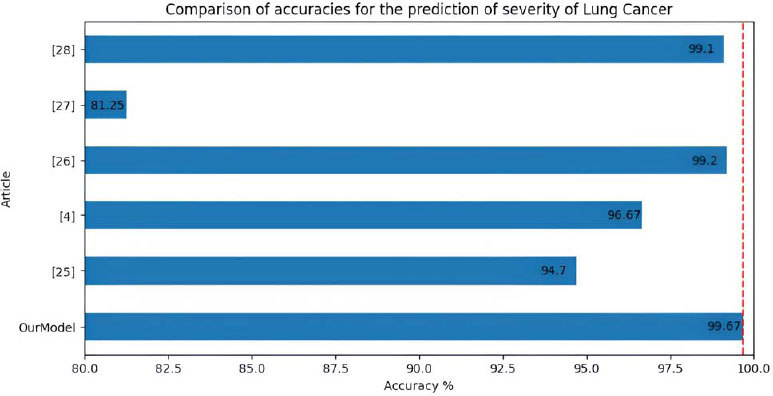
Compared to the work by Vaibhav Narawade [26], we have achieved more than 6% higher accuracy. We have accomplished 99.67% accuracy on the same dataset compared to their 94.7% accuracy using the Decision Tree Approach. S. S. A.-N. Ibrahim M. Nasser [4] used Artificial Neural Networks to solve the problem and achieved 96.67% accuracy, which is 3% less than the accuracy obtained from our method. P. R. Radhika [27] has used four different approaches to tackle the problem. The “Logistic Regression” algorithm generates 66.7%, the “Decision Tree” - 90%, “Naive Bayes” - 87.87% and the “Support Vector Machine” (SVM) produces 99.2% accuracy, about 0.4% less than the accuracy acquired by the method proposed by us. R. Patra [28] uses a “Support Vector Machine” algorithm with a “Radial Basis” function to classify the severity of Lung Cancer and yields 81.25% accuracy, which is more than 18% less accuracy compared to our suggested method. The work by E. Dritsas and M. Trigka [29] uses several algorithms to foretell the existence of carcinogens in the lungs. The highest accuracy achieved by them using Random Forest Classification was 99.1% accuracy, almost 0.5% less than our proposed model. Fig. (12) shows the comparison between the accuracies in the prediction of severity of lung cancer between all the mentioned models.

The “VGG16” approach to predicting the type of Lung Cancer using “Convolutional Neural Networks” yields an accuracy of 92.53%. In the test data, the model delivered an accuracy of 90.79%. The different types of cancer are classified using the shape of the tumour in the CT scan automatically by the model (features for the classification). Table 3 demonstratesthe classification report for the Lung cancer type classification on the test set.
| - | Precision | Recall | F1-Score | Support |
|---|---|---|---|---|
| Adenocarcinoma | 0.97 | 0.81 | 0.88 | 120 |
| Large Cell Carcinoma | 0.77 | 1.00 | 0.87 | 51 |
| Normal | 1.00 | 0.98 | 0.99 | 54 |
| Squamous Cell Carcinoma | 0.89 | 0.94 | 0.91 | 90 |
| Accuracy | 0.91 | 315 | ||
| Macro Average | 0.91 | 0.93 | 0.91 | 315 |
| Weighted Average | 0.92 | 0.91 | 0.91 | 315 |
In the Classification Report [30], Precision focuses solely on the model's positive predictions, assessing the percentage of those predictions that are truly positive. Recall, on the other hand, assesses how effectively the model identifies actual positive instances. This metric quantifies the model's effectiveness in identifying actual positive cases, taking into account both correctly and incorrectly classified instances. The F1-Score, a harmonic mean of Precision and Recall, provides a balanced measure of model performance. Lastly, Support indicates the count of actual instances belonging to a specific class within the dataset. The specific threshold [31] has been chosen to maximize the possible precision and recall in the “Normal” class to ensure the greatest number of correct predictions. If the classifier does not predict the possibility of the normal class, then there is a higher possibility that the patient may have a certain type of lung cancer. Fig (13) illustrates the accuracy and loss values for epochs 1-50 while training. At the end of epoch 50, the training accuracy is at 92.53% with a loss of 0.2391.
One of the popular research articles on the prognosis of the existence of Lung Cancer using CT scan images by D. Mhaske [32] only prognoses the presence of carcinogens with an accuracy of 97%, and it does not elaborate on the type of cancer. Although our accuracy is lower, we can predict the type of Lung Cancer at reasonable accuracy for deployment in the real-world scenario. The work by A. Teramoto [33] is comparable to our scenario as it accounts for predicting three types of Lung Cancer. It poses an accuracy of 71.1%, which is about 21% less than the accuracy we presented, 92.53%. S. H. Hyun [34] uses several approaches to predict the kind of Lung Cancer. The “Logistic Regression” technique yields the highest accuracy of 85.9%. We have achieved more than 6% higher accuracy with our proposed model than the one in his work. S. Pang [35] suggests the “VGG16T” model with boosting to predict the three types of Lung Cancer. The accuracy of their model is 86.58%, almost 4% less than the accuracy of our proposed model. M. Kirienko [36] used a custom CNN model to diagnose the type of cancer cell present in the lungs using the CT scan. During training, their accuracy is 86.8%. But while testing, their accuracy drops to 69.1%. Our proposed model does not have significant variation during training and testing and, therefore, can be more reliable in real-world applications. Fig. (14) shows the comparison between the accuracies in the prediction of the type of lung cancer between all the mentioned models.


CONCLUSION
In conclusion, our research has demonstrated the effectiveness of the “Decision Tree” algorithm in accurately foreseeing the severity of Lung Cancer at 99.67% accuracy and the usefulness of the customized “VGG16” CNN in diagnosing the type of carcinogen present in the lungs at an accuracy of 92.53%. These results hold significant clinical importance, as early detection is pivotal in improving patient outcomes and reducing the mortality associated with Lung Cancer. The proposed architecture acts as a two-step verification for the presence of cancer. In the first step, a question-based analysis is carried out to classify the severity of lung cancer. If the model predicts medium or high risk, it recommends a CT scan. After analyzing the CT scan image, the model finalizes the presence of cancer cells. Additionally, the model classifies the type of lung cancer present to aid in any future medical treatment if required. This two-step process ensures a more accurate diagnosis compared to other proposed methods in use at present.
While our study has shed light on important aspects of lung cancer prediction, it is essential to acknowledge its limitations, such as enhancing the precision of the CNN model using newer and more efficient models like ResNet and InceptionNet. Also, we could use a larger dataset with more attributes and values to cover all aspects of decision-making while predicting the severity of Lung Cancer. We could also employ a larger training set while training the customized VGG16 CNN model to lessen overfitting and generalize the model. Future research should aim to address these limitations and further refine prediction models. By taking these steps, we can make progress towards the objective of decreasing the worldwide impact of lung cancer and enhancing the well-being of individuals impacted by it. As we look ahead, the journey toward more accurate and accessible lung cancer prediction continues, with our research contributing a meaningful step forward.
LIST OF ABBREVIATIONS
| VGG16 | = Visual Geometry Group 16 |
| CNN | = Convolutional Neural Networks |
| CT Scan | = Computed Tomography Scan |
ETHICS APPROVAL AND CONSENT TO PARTICIPATE
Not applicable.
HUMAN AND ANIMAL RIGHTS
Not applicable.
CONSENT FOR PUBLICATION
Not applicable.
AVAILABILITY OF DATA AND MATERIALS
The data supporting the findings of the article is available in the "Lung Cancer Prediction" at "https://www.kaggle.com/datasets/thedevastator/cancer-patients-and-air-pollution-a-new-link" and "Chest CT-Scan images Dataset" at "https://www.kaggle.com/datasets/ mohamedhanyyy/chest-ctscan-images?datasetId=839140".
FUNDING
None.
CONFLICT OF INTEREST
The authors declare no conflict of interest, financial or otherwise.
ACKNOWLEDGEMENTS
Declared none.

