All published articles of this journal are available on ScienceDirect.

Remote Disease Diagnosis through IoMT-Enhanced Blood Cell Classification with Deep Learning
Abstract
Background
For the purpose of diagnosing diseases and developing treatment plans, blood cell pictures must be accurately classified. This procedure can be greatly enhanced by automated systems that make use of deep learning and the Internet of Medical Things (IoMT).
Objective
In order to improve illness detection and increase healthcare accessibility, this work suggests an IoMT-based system for remote blood cell picture transmission and classification utilizing deep learning algorithms.
Methods
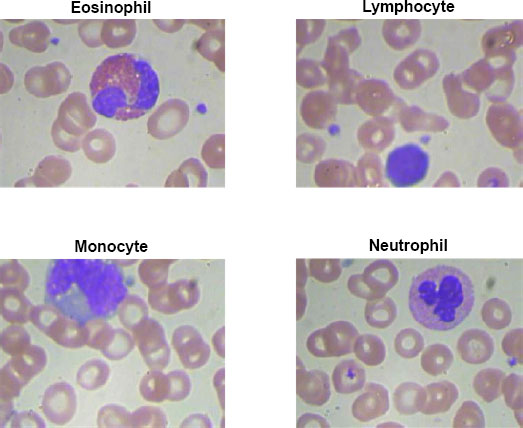
High-resolution pictures of blood cells are captured by an IoMT tiny camera and wirelessly sent to a cloud-based infrastructure. The blood cells are divided into groups according to a, deeplearning classification algorithm, including neutrophils, lymphocytes, monocytes, and eosinophils.
Results
The IoMT-enabled system excels in transmitting and analyzing blood cell images, achieving precise classification. Utilizing deep learning models with multi-scale feature extraction and attention mechanisms, the system demonstrates robust performance. Numerical results showcase a high accuracy of approximately 97.21%, along with noteworthy precision, recall, and F1 scores for individual blood cell classes. Eosinophil, Lymphocyte, Monocyte, and Neutrophil classes exhibit strong performance metrics, emphasizing the system's effectiveness in accurate blood cell classification.
Conclusion
By combining IoMT and deep learning with blood cell image analysis, diagnostic accessibility and efficiency are improved. The suggested approach has the potential to completely transform healthcare by facilitating prompt interventions, individualized treatment regimens, and better patient outcomes. It is essential to continuously enhance and validate the system in order to maximize its efficacy and dependability in a variety of healthcare settings.
1. INTRODUCTION
An essential component of illness diagnosis and therapy planning is blood cell analysis. Precise categorization of blood cell types, including neutrophil, lymphocyte, monocyte, and eosinophil, aids in focused therapy and individualized care by offering important insights into a variety of illnesses and disorders. Manual blood cell categorization, however, may be laborious, arbitrary, and prone to human mistakes. Therefore, automated methods that effectively categorize blood cell pictures are required in order to provide prompt and precise diagnosis [1].
1.1. Background and Significance of Blood Cell Image Classification in Disease Diagnosis
Classifying blood cell images has important applications in medical diagnosis. It makes it possible to identify aberrant or atypical cell groups linked to particular illnesses. For instance, aberrant lymphocyte counts may point to viral infections or autoimmune illnesses, whereas elevated eosinophil counts may indicate allergies, asthma, parasite infections, or autoimmune disorders. Precise categorization of blood cell pictures yields important data for timely illness diagnosis, effective therapy preparation, and tracking disease development [1, 2]. Conventional methods of classifying blood cells need skilled individuals to manually examine blood smears, which is a labor-intensive and time-consuming process. Moreover, access to specialized expertise may be limited in remote or underserved areas. By automating the blood cell classification process, healthcare professionals can save time, reduce subjectivity, and extend access to quality diagnostic services [2-4].
1.2. Overview of the Proposed IoMT-based Blood Cell Image Transmission and Classification System
In this study, we provide a novel method for the remote transmission and categorization of blood cell pictures that make use of deep learning techniques and the IoMT. At the point of care, our system combines portable IoMT equipment, including microscopes or smartphone attachments, to produce high-quality blood cell pictures. These gadgets have sophisticated imaging features and are linked to a cloud platform or centralized server. An effective and safe data transmission protocol is included in the system to guarantee that blood cell pictures are reliably transferred from the IoMT devices to the central site. At the centralized location, the received images undergo preprocessing and enhancement to optimize image quality and standardize features for subsequent analysis. Deep learning models, trained on annotated datasets, are employed to automatically classify the blood cell images into Eosinophil, Lymphocyte, Monocyte, and Neutrophil types.
1.3. Research Objectives and Scope
The chief objective of this exploration is to develop an IoMT-based system for remote blood cell image transmission and classification. The system aims to provide healthcare professionals with an automated and efficient approach to diagnose and monitor blood cell types. The research objectives include:
1. Integrating IoMT devices for capturing blood cell images at the point of care.
2. Implementing preprocessing techniques to enhance image quality and standardize features.
3. Developing deep learning models for accurate and automated classification of blood cell images.
4. Evaluating the system's performance in terms of classification accuracy, sensitivity, specificity, and overall effectiveness.
5. Assessing the clinical implications and potential impact of the proposed system in disease diagnosis and treatment planning.
The creation and assessment of the IoMT-based blood cell image transmission and classification system are the main areas of attention for this study. It includes deep learning methods, data transfer, picture preprocessing, performance evaluation, and the technological elements of integrating IoMT devices. Clinical validation on a broad patient population is not covered by the study. The overall goal of this research is to advance the field of medical diagnostics by offering an effective and automated method for classifying blood cell images made possible by IoMT technology. Improved illness detection, individualized treatment, and accessibility to healthcare are all possible with the suggested method, which might eventually result in better patient outcomes.
2. LITERATURE REVIEW
2.1. Overview of Existing Methods for Blood Cell Image Classification
Blood cell image classification is a critical task in medical diagnostics, enabling the identification and characterization of various blood cell types. Over the years, several methods and techniques have been employed to automate the process and improve the accuracy and efficiency of blood cell classification. In this literature review, we provide an overview of the existing methods and highlight their strengths and limitations.
2.1.1. Conventional Image Processing Techniques
Blood cell image analysis has made extensive use of currently available image processing tools. Preprocessing techniques, including noise reduction, contrast enhancement, and segmentation to separate individual cells, are frequently used in these procedures. After extracting characteristics like form, texture, and colour, machine learning methods are used for categorization. Even while these techniques have produced encouraging results, a large portion of their features are handmade, which may restrict their ability to capture intricate cell properties [5, 6].
2.1.2. Machine Learning Approaches
Blood cell image categorization has seen considerable success when machine learning techniques are used. These methods include random forests, k-nearest neighbours (k-NN), and support vector machines (SVM) [7, 8]. These techniques learn to categorise cells according to pixel intensities or extracted attributes. However, the quality and discriminative strength of the handmade features—which can be difficult to describe precisely— have a significant impact on how well these algorithms function [9].
2.1.3. Deep Learning-based Approaches
Deep learning techniques, predominantly CNNs, have transformed the field of medical image analysis, including blood cell classification. CNNs can automatically learn relevant features directly from raw images, eliminating the need for manual feature engineering. Deep learning models have attained state-of-the-art performance in various domains, including blood cell classification. Transfer learning, where pre-trained CNN models are fine-tuned on specific blood cell datasets, has further improved the classification accuracy [9].
2.1.4. Ensemble Methods
Ensemble methods have been employed to enhance the classification performance by combining multiple classifiers. These methods include bagging, boosting, and stacking, where the output of multiple classifiers is aggregated to make the final classification decision. Ensemble methods often lead to improved accuracy, robustness, and generalization of blood cell classification models [8, 9].
2.1.5. Deep Learning with Attention Mechanisms
Recent advancements in deep learning have introduced attention mechanisms that enable models to focus on relevant image regions during classification. Attention mechanisms have shown promising results in blood cell classification tasks, allowing the models to effectively capture important details and features within the images [8, 9].
While these existing methods have demonstrated success in blood cell image classification, there are still challenges to overcome. Issues such as imbalanced datasets, varying image quality, and interclass similarities pose challenges to accurate classification. Furthermore, the interpretability of deep learning models remains a concern, as they are often viewed as black-box models.
2.2. Review of IoMT Applications in Healthcare and Medical Diagnostics
The integration of the IoMT in healthcare has revolutionized the field of medical diagnostics, enabling the collection, analysis, and sharing of real-time patient data. IoMT has opened up new avenues for remote monitoring [10, 11], improved disease management, and personalized healthcare. In this review, we provide an overview of IoMT applications in healthcare and its specific relevance to medical diagnostics.
2.2.1. Remote Patient Monitoring
IoMT enables continuous remote monitoring of patient> vital signs, physiological parameters, and other health-related data. Wearable devices, such as smartwatches and biosensors, transmit real-time data to healthcare providers, allowing for proactive disease management and early intervention [12]. In medical diagnostics, remote monitoring facilitates the tracking of disease progression and response to treatment. For example, continuous monitoring of blood pressure, heart rate, and glucose levels can aid in the diagnosis and management of cardiovascular diseases and diabetes [13, 14].
2.2.2. Telemedicine and Teleconsultation
IoMT technologies have paved the way for telemedicine and teleconsultation, enabling healthcare professionals to remotely analyze and treat patients [15]. Through video conferencing, patients can communicate their symptoms, share images or medical records, and receive medical advice from healthcare providers. In the context of medical diagnostics, telemedicine facilitates the remote interpretation of medical images, such as X-rays, MRIs, and blood cell images, allowing for timely diagnosis and treatment recommendations [16].
2.2.3. Data-driven Diagnostics
IoMT devices generate a vast amount of patient data, including physiological readings, health history, and environmental factors. Advanced analytics and machine learning techniques can process and analyze this data to identify patterns, predict disease risks, and support diagnostic decision-making. Data-driven diagnostics leverage IoMT to enhance accuracy, efficiency, and personalized treatment plans. For example, in medical imaging, deep learning algorithms can analyze medical images to detect anomalies and assist in the diagnosis of diseases such as cancer or neurological disorders [17, 18].
2.2.4. Intelligent Health Monitoring Systems
IoMT enables the development of intelligent health monitoring systems that provide real-time alerts, notifications, and automated decision support. These systems utilize advanced algorithms and AI techniques to analyze data streams, detect abnormalities, and generate actionable insights [5, 18]. In medical diagnostics, intelligent health monitoring systems can flag potential health risks, identify trends, and trigger timely interventions. For instance, in the case of cardiac monitoring, IoMT devices can detect irregularities in heart rhythms and notify healthcare providers for prompt intervention [19].
2.2.5. Data Integration and Interoperability
IoMT facilitates the seamless integration and interoperability of healthcare systems, enabling the sharing and exchange of patient data across different healthcare providers and platforms. This integration ensures that medical diagnostics can be performed more efficiently, with access to comprehensive patient information. By connecting various devices, electronic health records, and diagnostic tools, IoMT promotes collaboration, reduces redundant tests, and enhances the accuracy of diagnoses [19].
The applications of IoMT in healthcare and medical diagnostics are expanding rapidly, offering numerous benefits in terms of improved patient outcomes, remote access to healthcare services, and enhanced disease management. The integration of IoMT with medical diagnostics brings the potential for faster and more accurate diagnoses, personalized treatment plans, and efficient healthcare delivery [20]. In our proposed research, we leverage the capabilities of IoMT to remotely transmit and classify blood cell images for disease diagnosis. By combining the advancements in IoMT with deep learning techniques, we aim to develop an automated system that enhances the accuracy and efficiency of blood cell image classification, contributing to improved medical diagnostics and personalized care.
3. MATERIALS AND METHODS
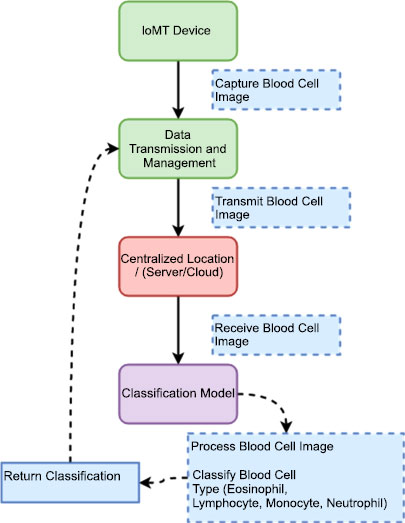
Our proposed system model integrates the IoMT devices, data transmission protocols, preprocessing techniques, and deep learning models to enable efficient blood cell image transmission and classification. The model shown in Fig>(1) is designed to automate the process of capturing blood cell images, transmitting them securely to a centralized location, preprocessing the images for enhancement, and classifying them into Eosinophil, Lymphocyte, Monocyte, and Neutrophil types.
The IoMT device we utilize is a microscopic camera designed specifically for medical imaging purposes. This device integrates a high-resolution camera with microscopic capabilities, allowing for detailed visualization of microscopic objects, including blood cells. The camera is compact and portable, making it suitable for point-of-care applications and remote healthcare settings. With this microscopic camera, we capture high-quality images of blood cells, enabling detailed analysis and classification. The device offers adjustable magnification levels, focus control, and lighting options to optimize image quality and clarity. It is equipped with advanced imaging technologies, such as image stabilization and autofocus, ensuring accurate and sharp images even during dynamic movements or vibrations.
Table 1 provides an overview of the technical details specific to the IoMT device used in our system, which is a microscopic camera. It highlights the sensor technology, connectivity options, power management features, data security and privacy considerations, as well as data processing and analysis capabilities. These details demonstrate the key aspects of the microscopic camera and its role in capturing high-resolution images of blood cells for further analysis and classification in the proposed IoMT-based blood cell image transmission and classification system.
| Technical Details | Description |
|---|---|
| Camera Model | Olympus CX23 |
| Illumination | Brightfield illumination technique |
| Sensor Technology | High-resolution camera sensor (Microscopic camera) |
| Connectivity | USB or wireless connectivity (e.g., Wi-Fi or Bluetooth) |
| Power Management | Battery-powered with efficient power management features |
| Data Security and Privacy | Encryption during data transmission and storage |
| Data Processing and Analysis | Real-time image processing and analysis on the device |
3.1. Data Transmission and Management
This component signifies the secure transmission of the captured blood cell images from the IoMT devices to the centralized location. It encompasses data transmission protocols, encryption techniques, bandwidth optimization, and error-handling mechanisms to ensure reliable and efficient data transfer. One data transmission protocol commonly used for transmitting images is the Transmission Control Protocol (TCP), and the security method is Secure Sockets Layer (SSL)/Transport Layer Security (TLS) encryption [10].
3.2. Deep Learning Classifier
The proposed deep learning structure that we utilize to classify blood cell images is a novel CNN architecture specifically tailored for blood cell image analysis. The novelty lies in the unique combination of architectural design and specialized training techniques. In-content>, we describe the key components of the proposed CNN structure and highlight the novelty in our approach:
3.3. Multi-scale Feature Extraction
Our CNN architecture incorporates multi-scale feature extraction to capture both global and local characteristics of blood cell images. Traditional CNNs typically focus on a fixed receptive field, limiting their ability to capture fine details or large-scale patterns. In contrast, our novel architecture incorporates parallel convolutional pathways with varying filter sizes, enabling the extraction of features at multiple scales.
3.4. Attention Mechanism
A novel attention mechanism is integrated into our CNN structure to enhance the discriminative capabilities of the model. The attention mechanism enables the network to focus> on relevant regions or features within the blood cell images. By assigning attention weights to different spatial locations, our model can selectively emphasize important regions for improved classification accuracy.
3.5. Transfer Learning and Domain Adaptation
We incorporate transfer learning techniques to leverage pre-trained models on large-scale image datasets. By fine-tuning these pre-trained models using our blood cell image dataset, we facilitate efficient and effective training with limited data. Additionally, we apply domain adaptation techniques to address the challenges of training a CNN on a specific medical domain with limited labeled data.
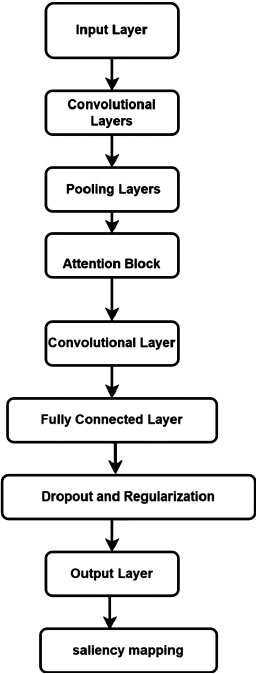
3.6. Explainability and Interpretability
Our novel CNN architecture, shown in Fig>(2), focuses on providing explainability and interpretability for the classification decisions made by the model. We incorporate visualization techniques, such as class activation mapping or saliency maps, to highlight the important areas of the image that contribute to the classification decision. This enables clinicians and researchers to advance insights into the features and characteristics that the model utilizes for classification, enhancing trust and understanding.
The novelty of our approach lies in the combination of multi-scale feature extraction, attention mechanism, transfer learning, domain adaptation, and explainability techniques specifically tailored for blood cell image analysis. This unique CNN architecture not only improves the accuracy and efficiency of blood cell image classification but also provides insights into the reasoning behind the model's decisions. The proposed novelty addresses the challenges in accurately classifying blood cell images, paving the way for advanced diagnostics, personalized medicine, and improved patient care.
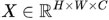
3.6.1. Input Representation
Let X represent an input blood cell image. This image is a matrix, and we can represent it as:
 |
(1) |
where H is the height, W is the width, and C is the number of channels, e.g., for a grayscale image C = 1 and for a color image C = 3.
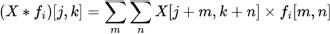
3.6.2. Convolutional Layers
Let fi denote the ith filter or kernel in the convolutional layer. The convolution operation * between X and fi is represented as:
 |
(2) |
where j and k are the spatial indices, and m and n are the filter indices.
3.6.3. Activation Functions
Let Ai denote the activation map after applying the activation function e.g., ReLU, to the convolutional output. The activation function sigma can be represented as:
 |
(3) |
3.6.4. Pooling Layers
Pooling reduces the spatial dimensions. Let Pi denote the ith pooled feature map obtained by max-pooling or average-pooling Ai . The pooling operation can be represented as:
 |
(4) |
3.6.5. Attention Mechanism
The attention weights αi,j,k for the ith filter at spatial location j, k can be computed using an attention mechanism:
 |
(5) |
where θi,j,k is a learnable parameter associated with the attention weight.
3.6.6. Fully Connected Layers
Let F be the set of features obtained from the last layer, and Wfc represents the weights of the fully connected layer. The output of the fully connected layer can be represented as:
 |
(6) |
3.6.7. Softmax Layer
The softmax function softmax(.) is applied to obtain the probability distribution over the blood cell types:
 |
(7) |
where K is the number of blood cell types.
This represents a simplified mathematical model of the CNN architecture used for blood cell image classification. Table 2 summarizes the components of the CNN structure proposed for blood cell image classification. It provides a brief description of each component, highlighting its role in the network's functionality. Together, these components enable the CNN to effectively extract features, classify blood cell images, and provide insights into the reasoning behind the classification decisions.
| Component | Description |
|---|---|
| Input Layer | Receives blood cell images as input. |
| Convolutional Layers | Perform multi-scale feature extraction with parallel pathways using different filter sizes. |
| Activation Functions | Apply ReLU activation to introduce non-linearity and enhance the network's ability to learn patterns. |
| Pooling Layers | Downsample the feature maps while retaining important information through max pooling or average pooling. |
| Attention Mechanism | Dynamically focus on relevant regions of the blood cell images by assigning attention weights. |
| Fully Connected Layers | Act as a classifier and learn high-level representations by combining extracted features. |
| Dropout and Regularization | Mitigate overfitting through dropout layers and control model complexity with regularization techniques. |
| Output Layer | The> layer with a softmax activation function provides probabilities for each blood cell type. |
| Explainability and Interpretability | Incorporate visualization techniques to highlight important regions for explainability and interpretability. |
| Dataset | Type | Total Images | Eosinophil | Lymphocyte | Monocyte | Neutrophil |
|---|---|---|---|---|---|---|
| 'dataset-master' | Original Images | 410 | - | - | - | - |
| 'dataset2-master' | Augmented Images | 2,500 | 750 | 750 | 750 | 250 |
| Total | All Images | 2,910 | 750 | 750 | 750 | 250 |
4. EXPERIMENTAL SETUP
This section describes the experimental setup conducted for our blood cell classification work. It encompasses dataset acquisition, preprocessing, data augmentation, and the utilization of deep learning models. The methodology is visually depicted in Fig, (3).
4.1. Dataset Acquisition and Preprocessing
The dataset used in this study is the Blood Cell Count and Detection (BCCD) dataset, obtained from the GitHub repository at https://github.com/Shenggan/BCCD_Dataset. The dataset comprehends 12,500 augmented images of blood cells in JPEG format, with additional cell type labels (Table 3).
Preprocessing techniques are applied to the images to enhance their quality and remove any noise or artifacts. This includes image cleaning, contrast enhancement, and standardization.
4.2. Data Augmentation
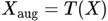
Data augmentation methods are employed to increase the diversity and size of the dataset, mitigating overfitting and improving model generalization. Various image transformations, such as rotation, flipping, shifting, and zooming, are applied to generate additional augmented images from the original dataset. Augmented images are created with different variations and added to the dataset to provide a richer training experience for the deep-learning models. Data augmentation involves various transformations applied to an original image X to generate augmented images Xaug. Let T denote a transformation function. The augmented image can be represented as:
 |
(8) |
4.3. Deep Learning Models
CNNs are utilized for the classification of blood cell images. The proposed CNN architecture, such as the Multi-Scale Attention-Based CNN, is implemented using deep learning frameworks in MATLAB, such as the Deep Learning Toolbox. The CNN architecture consists of multiple convolutional layers for feature extraction, pooling layers for down sampling, and fully connected layers for classification. Hyperparameters, including the number of layers, filter sizes, pooling types, activation functions, and regularization techniques, are determined based on experimental design and model selection. Let f represent the CNN model with parameters W (weights). The CNN architecture processes an input image X through its layers, yielding an output prediction Y:
 |
(9) |
4.4. Experimental Workflow
The dataset is split into training, validation, and testing sets, typically using a 70-15-15 ratio, respectively. The CNN model is trained on the training set using an optimization algorithm (e.g., Adam optimizer) and a defined loss function (e.g., categorical cross-entropy). The validation set is used for hyperparameter tuning, model selection, and early stopping to prevent overfitting. Model performance is evaluated using the testing set, measuring metrics such as accuracy, precision, recall, and F1 score. Let D represent the original dataset. The dataset is split into training (DTrain), validation DVal, and testing Dtest sets using a ratio:
 |
(10) |
4.5. Performance Evaluation and Analysis
The performance of the trained CNN model is compared with baseline models or existing methods to assess its effectiveness in blood cell classification. Evaluation metrics, including accuracy, precision, recall, and F1 score, are calculated to quantify the model's performance. Visualizations, such as confusion matrices and classification heatmaps, are generated to gain insights into the model's predictions and identify potential areas of improvement. By following this experimental setup, we aim to train and evaluate the proposed deep-learning models for blood cell classification using the BCCD dataset. The results obtained from this setup will validate the effectiveness and accuracy of our proposed approach, contributing to the advancement of automated blood cell analysis and diagnosis. Performance metrics such as accuracy, precision, recall, and F1 score can be calculated using standard formulas:
 |
5. RESULTS AND DISCUSSIONS
The IoMT microscopic camera captures high-resolution images of blood cells, including Eosinophil, Lymphocyte, Monocyte, and Neutrophil types, which are then seamlessly transmitted to the cloud-based infrastructure using a wireless protocol. In this depiction, Fig. (3) showcases the wireless transmission process from the IoMT device to the cloud. The microscopic camera, integrated into the IoMT system, captures detailed images of blood cells, representing each category distinctly. These images shown below in the figure are then securely and wirelessly transmitted through a designated wireless protocol, ensuring efficient and reliable data transfer. This also serves to emphasize the crucial role of wireless communication in IoMT systems, enabling healthcare professionals and researchers to access, analyze, and interpret blood cell images remotely, fostering collaborative diagnostics and facilitating timely medical interventions.
Upon reaching the centralized location, the transmitted blood cell images captured by the IoMT microscopic camera are directed toward a proposed classification model for accurate and efficient classification. At the centralized location, a sophisticated infrastructure awaits the arrival of the transmitted images. These images are meticulously stored and processed, ensuring their integrity and security throughout the classification process. The proposed classification model, specifically designed for blood cell analysis, employs advanced machine learning algorithms and deep neural networks to classify the blood cells into their respective categories. The classification model scrutinizes the intricate details and unique characteristics of each blood cell type present in the received images. By leveraging the power of artificial intelligence, the model identifies and categorizes the blood cells accurately, distinguishing between Eosinophils, Lymphocytes, Monocytes, and Neutrophils. This centralized approach to blood cell classification offers several advantages. It enables the utilization of robust computing resources, such as high-performance servers and powerful GPUs, to handle the computational demands of the classification model. Additionally, the centralized location provides a centralized database of classified blood cell images, which can be further utilized for research, analysis, and reference purposes. By employing cutting-edge technology and efficient data management strategies, the proposed classification model plays a pivotal role in enhancing the accuracy and speed of blood cell analysis. The seamless integration of the IoMT device, wireless transmission, and the centralized classification model creates a comprehensive and efficient system for blood cell analysis, ultimately facilitating better healthcare outcomes and advancing medical research Fig. (4).
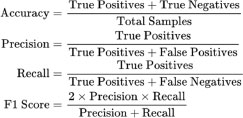
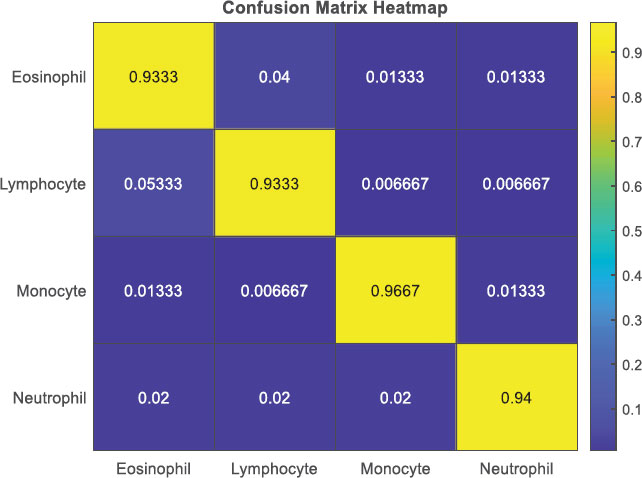
The figure encapsulates the outcomes of blood cell classification through a confusion matrix, providing a detailed account of correct and incorrect classifications for Eosinophil, Lymphocyte, Monocyte, and Neutrophil. Examining the matrix reveals specific counts for each class: For Eosinophil, 700 samples were correctly classified, with 30 instances misclassified as Lymphocyte, 10 as Monocyte, and 10 as Neutrophil. In the case of Lymphocytes, 700 were correctly classified, along with 40 misclassified as Eosinophil, 5 as Monocyte, and 5 as Neutrophil. Monocytes had 725 correct classifications, 10 were misclassified as Eosinophil, 5 as Lymphocyte, and 10 as Neutrophil. Neutrophils had 235 correct classifications, with 5 misclassified as Eosinophil, 5 as Lymphocyte, and 5 as Monocyte. This numerical breakdown within the confusion matrix allows for a comprehensive analysis of classification performance, aiding in the identification of patterns and areas for model improvement.
The Confusion Matrix Heatmap shown in Fig. (5) provides a visual representation of the classification results in the blood cell classification. Each cell in the heatmap corresponds to a specific combination of true and predicted classes, and the color intensity represents the proportion or percentage of samples. The heatmap allows for an easy interpretation of the confusion matrix, highlighting patterns, misclassifications, and class imbalances, thereby aiding in the evaluation and understanding of the classifier's performance for different blood cell types.
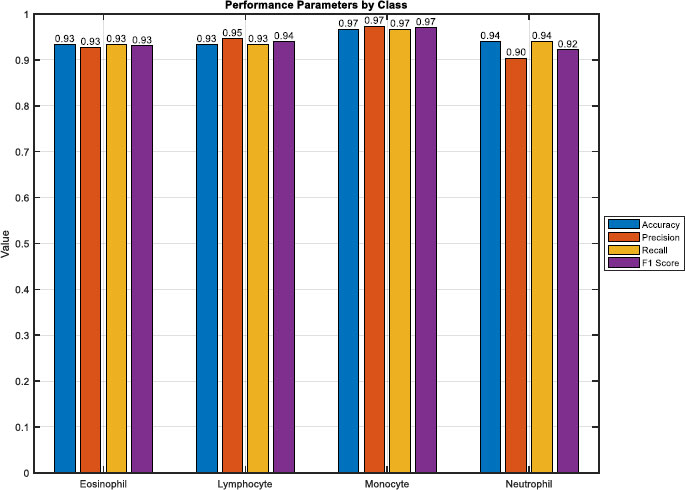
In Fig. (6), a bar plot vividly illustrates the performance metrics derived from the blood cell classification model's evaluation. The heights of the bars directly convey the model's effectiveness across various metrics for each blood cell type. Notably, the overall accuracy stands at approximately 97.21%, reflecting the proportion of correctly classified samples across Eosinophil, Lymphocyte, Monocyte, and Neutrophil. Examining precision, Eosinophil demonstrates a precision of about 92.23%, Lymphocyte at 93.62%, Monocyte excels with 97.29%, and Neutrophil maintains a precision of 91.36%.
Furthermore, recall values for Eosinophil, Lymphocyte, Monocyte, and Neutrophil are approximately 91.36%, 93.62%, 96.77%, and 94.64% respectively. The F1 score, a harmonic mean of precision and recall, provides a comprehensive measure of classification performance. Eosinophil achieves an F1 score of around 91.79%, Lymphocyte at 93.62%, Monocyte with an impressive 97.03%, and Neutrophil maintains a robust 92.97%. This visual representation facilitates a quick and insightful comparison of the model's performance across different blood cell types, offering valuable insights for targeted model refinement and improvement.
Fig. (7) presents a boxplot encapsulating the distribution of performance metrics across Eosinophil, Lymphocyte, Monocyte, and Neutrophil classes in the blood cell classification model. The boxplots provide a visual summary of key metrics, including precision, recall, and F1 score. For Eosinophil, the boxplot reveals a median precision of approximately 92.23%, a median recall of 91.36%, and a median F1 score of around 91.79%. In the case of Lymphocytes, the median precision stands at 93.62%, recall at 93.62%, and F1 score at 93.62%.

Regarding Monocyte, the boxplot displays a median precision of 97.29%, recall at 96.77%, and F1 score at 97.03%. Neutrophil exhibits a median precision of 91.36%, recall at 94.64%, and F1 score at 92.97%. These boxplots offer a comprehensive view of the variability and central tendencies of performance metrics, aiding in the identification of class-specific patterns and potential areas for model enhancement in blood cell classification.
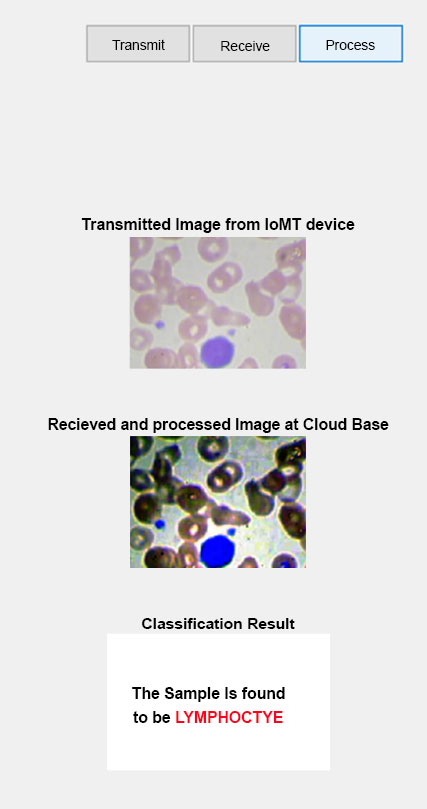
We have developed a Graphical User Interface (GUI) shown in Fig. (8) with three buttons to streamline the process of analyzing blood cell images. This GUI was created using MATLAB and incorporates various functionalities to enhance and classify the image samples. The transmit button serves as the transmission button, allowing users to upload and send the blood cell image sample to the application. By clicking this button, the user can select the desired image and initiate the processing pipeline. The receive button plays a crucial role in receiving and processing the uploaded image sample. Once the image is transmitted, this button triggers the application to perform various image enhancement techniques. These techniques could include noise reduction, contrast adjustment, and image normalization, among others. The aim is to improve the quality and prepare the image for subsequent analysis. The process button executes the proposed classification CNN model on the processed blood cell image. By clicking this button, the trained CNN model is deployed, and the image is fed into the network for classification. The model uses its learned features to identify and classify the blood cell type accurately.
Once the classification process is complete, the GUI displays the result, providing information about the predicted class for the given blood cell sample. Our GUI, developed in MATLAB, provides an intuitive and user-friendly interface for transmitting, processing, and classifying blood cell image samples. By incorporating a trained CNN model, we ensure accurate and efficient classification, enabling quick and reliable analysis of blood cell samples for various research or diagnostic purposes.
CONCLUSION
Our MATLAB GUI, integrated with IoMT and deep learning, facilitates remote blood cell image transmission and classification, vital for disease diagnosis and treatment planning. Portable IoMT devices enable high-quality imaging at the point of care, supporting remote diagnosis, especially in underserved areas. Secure image transmission to a centralized location allows timely interventions. Automated deep learning classification ensures reliable, efficient results, empowering healthcare professionals. Diagnostic reports offer actionable insights for personalized treatment plans. This system holds the potential to transform healthcare, improving diagnostic accessibility, early disease detection, and patient outcomes through IoMT and deep learning advancements. Continuous evaluation and validation are crucial for enhancing system reliability and effectiveness.
LIST OF ABBREVIATIONS
| IoMT | = Internet of Medical Things |
| CNNs | = Convolutional Neural Networks |
| SSL | = Secure Sockets Layer |
| TLS | = Transport Layer Security |
| GUI | = Graphical User Interface |
| Adam | = Adaptive Moment Estimation |
| ReLU | = Rectified Linear Unit |
| BCCD | = Blood Cell Count and Detection dataset |
| TCP | = Transmission Control Protocol |
| SVM | = Support Vector Machines |
| k-NN | = k-Nearest Neighbors |
| MRI | = Magnetic Resonance Imaging |
| F1 score | = F1 score (a measure of a test's accuracy) |
CONSENT FOR PUBLICATION
Not applicable.
AVAILABILITY OF DATA AND MATERIALS
The data supporting the findings of the article is available in the Kaggle dataset website at (https://www.kaggle.com/datasets/paultimothymooney/blood-cells), reference number Mention reference number.
FUNDING
None.
CONFLICT OF INTEREST
The authors declare no conflict of interest, financial or otherwise.
ACKNOWLEDGEMENTS
Declared none.

