All published articles of this journal are available on ScienceDirect.

An Exhaustive Study on Deep Neural Network-based Prediction of Heart Diseases and its Interpretations
Abstract
Cardiovascular disease prediction is important in day-to-day life. A tool to diagnose cardiovascular diseases is an Electrocardiogram (ECG), which records electrical activities happening in the heart through a wave. A determination is made by checking the wave changes in an ECG. Predicting wave changes and diagnosing the disease requires domain expertise like cardiologists/physicians. Deep Neural Network techniques extract the features accurately and automatically predict the type of disease. This article lists different types of cardiac disorders, and parallelly different disease interpretations of all types of diseases are discussed to manually identify the disease type; segmentation of leads, pre-trained models, and different detection techniques are discussed to predict the type of diseases from an ECG image. Finally, this article discussed the different challenges in predicting heart diseases, and solutions to some of the challenges are given.
1. INTRODUCTION
Cardiovascular disease occurs in the heart and blood vessels [1]. Prediction of cardiovascular disease is important and challenging too. Electrocardiogram (ECG) data predicts heart diseases [2]. Physicians or domain experts are needed to predict the diseases in ECG. But diagnosing using a large amount of data by experts is difficult to achieve scalability [3]. Machine learning or deep learning concepts are used to overcome scalability issues.
Researchers conducted their research in two ways: diagnosing single diseases like myocardial infarction [4], arrhythmias [5], etc. using 12 lead ECGs. The second is taking particular waves like QRS wave [6], ST interval [7], etc. from the ECG and diagnosing the disease. But collective research finding is challenging. Instead of finding individual diseases or individual waves to predict the diseases, we can diagnose all the possible diseases using 12 lead ECGs with the help of machine learning and deep learning concepts. Further work carried out for diagnosing all cardiovascular diseases is pattern matching. Pattern matching is done by matching a given or extracted pattern with the patterns already trained [8]. If the pattern matches exactly, it will classify, or else it will search for other patterns and so on. Likewise, in the ECG signal [9, 10], continuous matching of each wave with the waves already trained is carried out. A particular wave of change will happen for particular diseases, and by matching the changes, we can classify the diseases. Similarly, each lead is segmented anonymously in ECG images, and segmented images are matched with the trained image [11, 12]. Matching is not done using the pixel values, which are done using scalar values and image shape [13].
An intelligent decision-making system widely helps us to monitor the patients like heart patients heart rates, and also it helps us to automatically diagnose heart disease, manage the patients, record their heartbeats, and store the data [14]. This is useful when the patients need treatment for a particular disease because heart disease can’t diagnose properly within an hour, we need to monitor the heart rate continuously, and accordingly, treatment is to be started [15]. An expert in cardiology is there to predict heart diseases, but one main challenge is scalability because a cardiologist can’t monitor all the patients. Time complexity and cost factors are important properties [16]. Artificial intelligence concepts can achieve these properties and automatically detect diseases that can be done with good complexity and less cost [17].
Artificial Intelligence (AI) will mimic the tasks done by humans. Machines will be trained like humans by giving all input possibilities to learn and predict. It consists of Machine Learning (ML) and Deep Learning (DL) [18]. Commonly, DL is good at analyzing the images, and it will learn the features using a huge number of images, but ML is good at analyzing data, and also, it will not give good results in image-based predictions. This study analyzes the ECG images for predicting cardiovascular diseases. Deep Learning involves a Deep Neural Network (DNN), Convolutional Neural Network (CNN), and Recurrent Neural Network (RNN). In ECG images, lead information is important for predicting the type of heart disease. An object is detected with a DNN concept to extract accurate information from each lead. Furthermore, related work on ECG signals and images, interpretation of ECG images, challenges in the publically available dataset and possible solutions are discussed.
1.1. Related Work
1.1.1. Research Carried Out
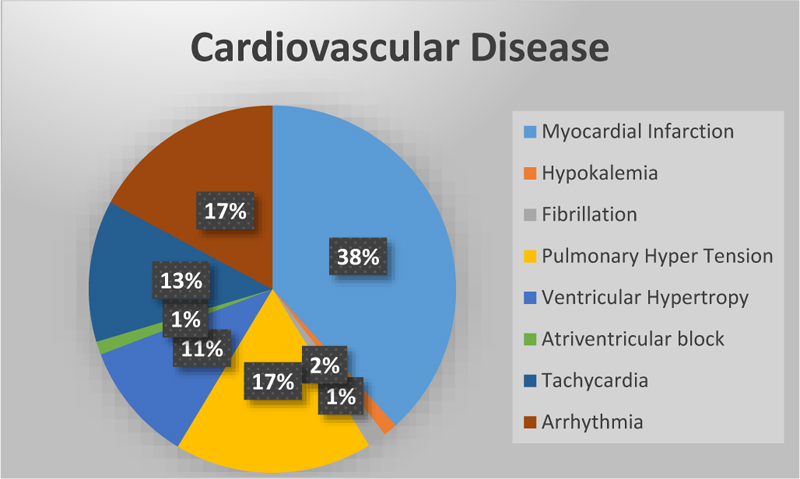
Cardiovascular disease is the leading cause of death worldwide [19]. Cardio diseases mainly occur due to a lack of blood supply and blockage in arteries. If chest pain occurs, it may be angina or else a heart attack. In angina, there won’t be any permanent damage to the heart, but in a heart attack, it's not the case [20]. Fig. (1) represents the total number of research studies on different diseases [21] taken from Google scholar.
1.2. About 12 Lead ECG
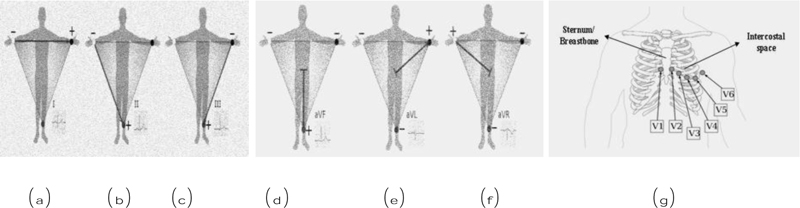
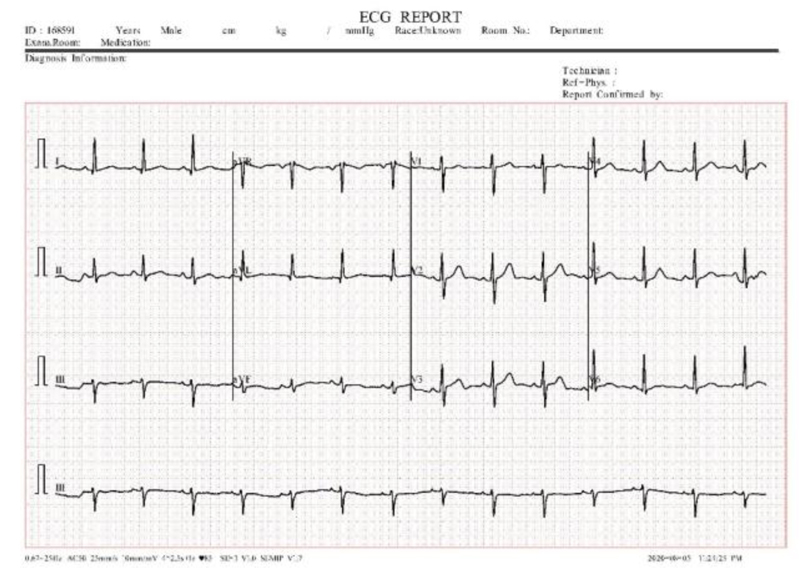
12 lead ECG tests are used to diagnose heart disease. In this test, 10 electrodes are placed on the human body and then from the 10 electrodes, 12 leads are calculated. Each electrode records the skin movement when heat impulses an electrical signal. The 12 leads are divided into 3 subparts a) limb nodes, b) augmented limb nodes c) chest or precordial leads. Limb nodes are categorized into Lead I, II, and III. Augmented limb nodes are categorized into Lead augmented vector right (aVR), Lead augmented vector right (aVL), and Lead augmented vector right (aVF) [22]. Chest leads are categorized into V1, V2, V3, V4, V5, and V6. Each lead is calculated using the electrodes placed in the body shown in Fig. (2). Recorded waves are printed on a graph sheet; each small box in a sheet represents 0.04s, and a large box represents 0.2s, shown in Fig. (3) [23].
1.3. ECG Interpretation
1.3.1. Rate
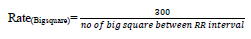
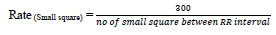
Heart rate defines the speed of heartbeats. The rate is calculated in an electrocardiogram by measuring the number of the boxes between the RR intervals [24, 25]. A rate between 60 to 99 bpm indicates the patient is normal Eq 1, 2; if the rate is lower or higher, it shows some abnormalities Eq 3 shown in Table 1.
| Interpretation | Beats Per Minute |
|---|---|
| Normal | 60 - 99 |
| Bradycardia | Less than 60 |
| Tachycardia | Greater than 100 |
If the rhythm is regular,
 |
(1) |
 |
(2) |
If the rhythm is irregular,
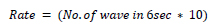 |
(3) |
2. DATASET AVAILABILITY
A dataset collection is a challenging task when research is based on the medical field. Here, the discussion is based on ECG images; research on ECG images is much less [45]. Most of the data on the internet is time series, which is inappropriate for this work. The Benchmark dataset is available on Mendeley, published by the University of Management and Technology in 2021 [46, 47]. Table 4 describes the dataset availability in a different class.
| Interpretation | Rate | Rhythm | P-wave | QRS Interval | PR Interval | T Wave |
|---|---|---|---|---|---|---|
| Normal Sinus | 60 to 100 bpm | No | Upright in the lead I and II | QRS preceded by P | Constant | No |
| Sinus Bradycardia [27] | <60 bpm | Regular | No | No | No | No |
| Sinus Pause [28] | Varies from slow to normal | Irregular | Absent | No | Normal or long PR | No |
| Atrial Fibrillation [29] | ~150 bpm | No | Absent | < 0.12s | No | No |
| Atrial Flutter [29] | ~300 bpm | No | No | 3 flutters to 1 QRS wave | No | No |
| Ventricular Fibrillation [30] | Can’t discerned | Unorganized | Absent | Absent | Absent | No |
| Ventricular tachycardia [30] | 100 to 250 bpm | Irregular | Absent | No | No | Absent |
| Supraventricular tachycardia [30] | 150 to 250 bpm | Regular | Can’t discerned | No | No | No |
| Atrial Escape Rhyth [31] | 60 to 80 bpm | No | No | No | No | No |
| Asystole [30, 32] | Absent | Absent | Absent | Absent | No | No |
| Normal | Abnormal | Interpretation | |
|---|---|---|---|
| P-Wave [33] | Best seenPositive – Lead I and IINegative – aVRBiphasic – V1DurationLess than 0.12s | Tall Peaked P Wave, Duration - Greater than 2.5 mm | - Congenital Heart diseases- Pulmonary Hypertension |
| Biphasic, Duration -Greater than 40s wide, Greater than 1mm deep | - Left atrial enlargement | ||
| Mitrale, Duration - Greater than 0.12s (Wide P wave) | - mitral stenosis- Left atrial Enlargement | ||
| PR interval [34] | Duration0.10s to 0.20s | Long PR, Duration - Greater than 0.22s | - First-degree atrioventricular block [34] |
| The first PR interval is normal and successive as a P wave with no following QRS complex | - Second-degree atrioventricular block [35] | ||
| No relationship between the P wave and the QRS complex | -Third-degree atrioventricular block | ||
| Short PR, Duration - lesser than 0.12s | - Tachycardia | ||
| Q Wave | Duration- Less than 0.04s- >2mm in III and aVR- No Q wave in V1 to V3 | Abnormal Q wave, Duration - 1mm wide, 2mm deep. Best seen - V1 to V3 | Past or current infraction [36] |
| No Q wave, Best seen - V5, V6 | NSTEMI, LBBB [36] | ||
| R Wave | - Size is not absolute, small in V, large in V1 to V6- R > S in (V4)- For children and young adults, the tall R wave in lead V1 is normal | Taller R wave in V1 | - Right ventricular hypertrophy- Posterior Myocardial Infarction- Right bundle branch block [37] |
| Taller R wave in aVR | - Dextrocardia- Ventricular tachycardia | ||
| Absent | - Dextrocardia | ||
| - <= 3mm in V3 | - Prior anteroseptal MI [37]- LVH- Inaccurate lead placement | ||
| QRS Complex [38] | - upright in Lead I and II, Duration - 0.07s to 0.10s | Sokolow & Lyon criteria - S(V1) +R(V5 or V6) > 35mm, Cornell Criteria - S(V3)+R(aVL) > 28mm (men), >20mm(women). OthersR(aVL)>11mm | Left ventricular hypertrophy [38] |
| V1(R>S), V6(S>R), Strain T wave inversion | Right ventricular hypertrophy | ||
| Duration - 0.10s to 0.11s | Incomplete Bundle Branch | ||
| Duration - Greater than or equal to 0.12s | Complete Bundle Branch [39] | ||
| QT interval | Duration - 0.35 to 0.45s [33] | Long QT interval, Duration - Greater than 0.45 | Ventricular arrhythmia |
| Short QT interval, Duration - Lesser than 0.35 | - Paroxysmal atrial, Ventricular fibrillation [40] | ||
| ST-Segment | Duration0.8 to 0.12s | - Concave ST elevation with PR depression (I, II, III, aVF, V5, V6), Reciprocal ST depression | Pericarditis [41] |
| - Concave ST elevation (Precordial, Inferior leads) with J point | Benign Early Repolarization | ||
| - ST-elevation with deep S wave (V1 to V3), ST depression with tall R wave (I and aVL) | Left Bundle Branch Block | ||
| - ST-elevation with deep S wave (V1 to V3), ST depression, and T-wave inversion (V5 to V6) | Left Ventricular Hypertrophy [42] | ||
| - ST-elevation with deep Q wave and inverted T wave (V1 to V3) | Ventricular Aneurysm | ||
| - ST-elevation and partial RBBB (V1 to V2) | Brugada Syndrome | ||
| - ST depression with dominant R wave (V1 to V3), Upright T Wave, ST-elevation (V7 to V9) | Posterior Myocardial Infarction [43] | ||
| - Downsloping ST depression | Digoxin Effect | ||
| - Downsloping ST depression with T wave flattening/ inversion, Prolonged QU interval | Hypokalaemia | ||
| - ST depression and T wave inversion (V1 to V3) | Right Ventricular hypertrophy | ||
| - abnormalities in RVH with ST depression, T wave inversion (V1 to V3) | Right Bundle Branch Block [44] | ||
| -widespread horizontal ST depression (V4 to V6) | Supraventricular Tachycardia | ||
| T Wave [45] | Duration0.15s to 0.20s | Inverted T wave (aVR, aVL, aVF, V1, III) | Myocardial Infarction |
| Biphasic T Wave (V2 to V3) | - Myocardial Infarction (rise and fall below), Hypokalemia (fall and rise above) | ||
| Flattened T wave, Duration - Varies from -1 mm to +1 mm | Hypokalemia | ||
| U Wave [46] | DurationLess than 2 mm | Inverted U wave | Myocardial ischemia or Left ventricular volume |
| Present | Hypokalemia | ||
| Normal waves - QRS and T wave incline to have the same direction; all waves are negative in lead aVR | |||
| Class | Number of Images |
|---|---|
| Abnormal Heart Beat | 779 |
| Covid | 250 |
| History of MI | 375 |
| Normal | 1,243 |
| Myocardial Infarction (MI) | 387 |
3. DEEP NEURAL NETWORK (DNN)
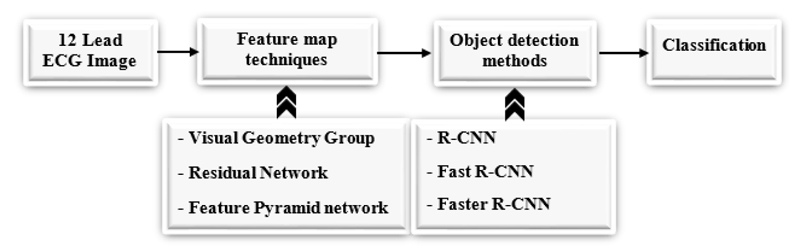
A 12 Lead ECG image is taken and fed into different pre-trained models to extract features from the image [48], we can use any pre-trained techniques like ResNet [49], VGG [50], and FPN [51], etc. after getting the feature map from the pre-trained models, object detection techniques are applied like Fast R-CNN, Faster R- CNN, and RPN to detect the object in an image. Fig. (4) shows the workflow diagram of the proposed approach.
3.1. Pretrained Models
3.1.1. VGG
A visual Geometry Group (VGG) recognizes the object in an image [50]. An RGB image is given as input of any size. An RGB image is passed through the convolutional layer with the filter size 3 x 3 and stride 1. In VGG, we can determine how many layers we need, but the limit is up to 19 because the backpropagation algorithm will make changes in weights, and as the layer increases, the number of feature maps also increases. Also, it contains millions of parameters [52].
3.1.2. ResNet
Residual Network (ResNet) is an object recognition method [53]. Many methods have been used to detect the object accurately, and they were found to increase the number of layers. But increasing the number of layers will detect the object; on the first layer, it will learn some features of the image, and after some more layers, it will learn many features, but one disadvantage is its computational time is high, and its error percentage is also high while testing and training the data [54]. The ResNet technique solves these issues using the skip connection (x) shown in Fig. (5). The skip connection solves the vanishing gradient problem [55].
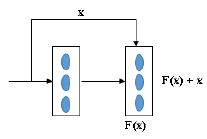
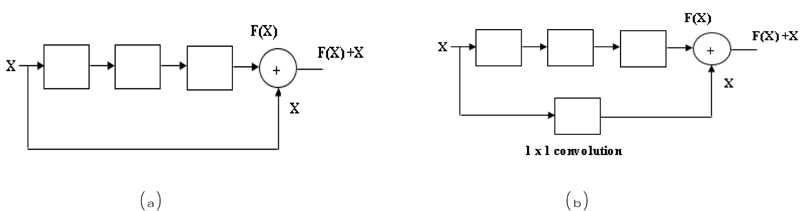
In the residual network, there are two blocks, one is an identity block, and another is a convolutional block. In the Identity block [56], the input size (x) and output size (F(x)) will be equal to add-up shown in Fig. (6a). In the Convolutional block [56], the input size (x) and the output size (F(x)) will not be equal while adding. A convolutional block uses a shortcut path using a 1 x 1 convolution layer from the input, and then it will add both the output, as shown in Fig. (6b), to solve the size variant issues.
In ResNet there are several layers ResNet 18, ResNet 34, ResNet 50 etc. [57, 58]. For example, we will discuss ResNet 18; the input image is fed into the first layer. In layer one 64 times 7 x 7 filter is used in an input image with stride 2, and then max pooling is performed on the image (outcome of the first layer) using a filter size of 3 x 3 with stride 2. A third layer x2 indicates a 3x3 convolution filter will 2 times, so 4 layers and the same in the next step. ResNet-18 layers calculated as 2+4+4+4+4 = 18 layers shown in Fig. (6b).
3.1.3. Feature Pyramid Network (FPN)
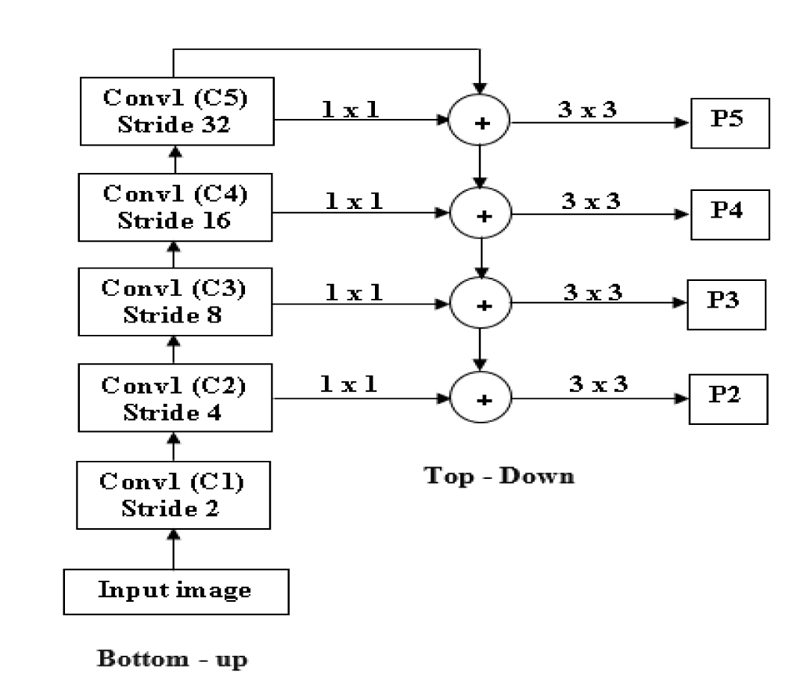
FPN is mainly used to extract features in an image [51]. FPN will merge low-resolution features and high-resolution features to get an accurate result. It takes input as a single image and gives proportionally sized feature maps at different levels. FPN is not dependent on the backbone convolutions network; we can use any convolutional network. FPN is constructed in two ways: top-down and bottom-up [59].
In Fig. (7), an input image is taken with any size. At first, the Bottom-up strategy is performed by giving the input to the first convolutional layer, and we will get one feature map after the first convolution layer (C1), and stride 2 is used to reduce the size of the image by 2. By comparing the input and output of the first convolutional layer, the first convolutional layer's result resolution is lower than the input image. After reducing the image by 50%, the next level convolution is performed: downsampling using stride 4. The output of the second convolution layer is given as input to both the top-down and bottom-up layers [60].
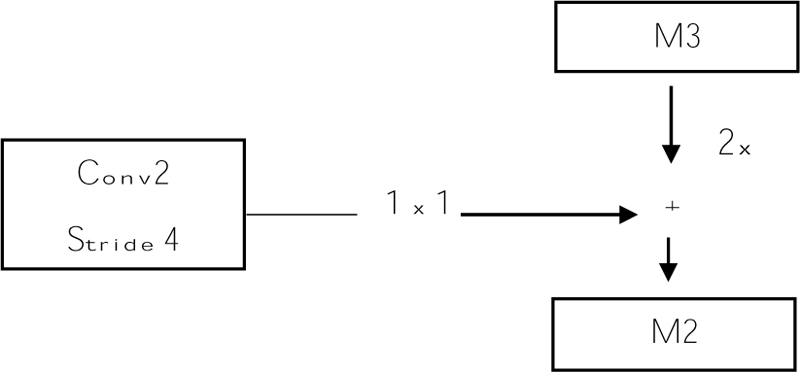
Before giving input to the top-down layer, the output of the convolutional layer should process a 1 x 1 convolution filter to decrease the channel depth with a fixed size of channel 256. And this output with the M3, M3 is the top-down approach. Addition can be done using the previous layer (M3) by 2 with the second convolutional layer (Fig. 8). The output of the addition is again applied to a 3 x 3 filter. This filter is aliasing to make the image smoother because we upsampled the image by 2, so the image size increases. Aliasing is performed to balance the noise in an image. And the prediction is made (P2, P3, P4, and P5), and this prediction is called a feature map [61].
3.2. Detection Methods
3.2.1. Fast R-CNN
R-CNN is a Region-based Convolutional Neural Network. It detects objects in an image [62], and this method achieves a good result while detecting the object. However, R-CNN [63] has limitations like higher time complexity and slow detection. Because warping and separate algorithms for region proposals are used, it will make the training process slower and also increases time complexity. To increase the speed and to get accurate results Fast R-CNN is proposed. There is no need for a separate storage disk in Fast R-CNN to store the data.
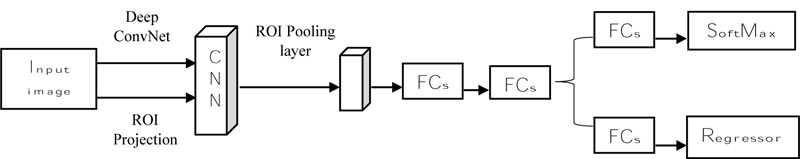
Fast R-CNN (Fig. 9) states that it takes an input image and then processes the convolution layer and Region of Interest (ROI) to get the feature map [62]. From the feature map, feature vectors are extracted and then the vector is applied to a fully connected layer and it gives two layers: the SoftMax layer and the Bounding Box Regressor. SoftMax will identify the background classes, and the regressor will plot the bounding box on the object using the SoftMax layer [64]. Fast R-CNN uses selective search to find the region, but it increases the time and is slow to detect the object. R-CNN is introduced to overcome that faster [65].
3.2.2. Faster R-CNN
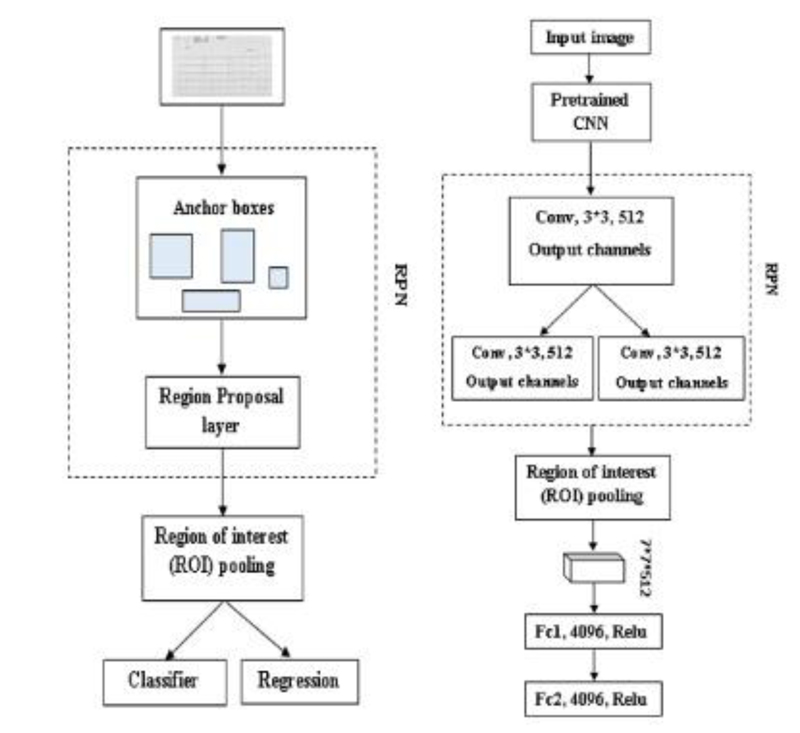
Faster R-CNN is also an object detector method; at first input image is given to Region Proposal Network (RPN) [66]; it produces the region proposals, and it won’t tell us what object is present, it only tells us whether the object is present or not (Fig. 10a). In Faster R-CNN, one advantage is it won’t use any selective search algorithm separately; it will automatically produce the region proposals [67]. And the proposals are fed into the ROI pooling layer or max-pooling layer to get two tasks one is a classification task, and another is a regression task. The classification task tells us whether the object is present in an image, and the regressor will plot or adjust the bounding box on an image [68].
3.2.2.1. Region Proposal Network (RPN)
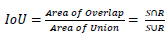
RPN is used to detect an object in an image. It won’t tell us what object is present; instead, it will tell us whether it is present or not [70]. It will act as binary classification; if the object is found, it gives 1; otherwise, 0. First, the image is pretrained using feature extractor techniques (VGG, ResNet, etc.); after the features are extracted, the intermediate layer is taken to feed into an RPN first layer. In the first layer, 3*3 is the filter size of that layer, and 512 is the number of channels divided into classification and regression. In classification Conv, 1*1, and 2*9 are used in Fig. (10b). 1*1 is filter size, and in 2*9, 2 bounding box coordinates and 9 is the number of anchor boxes. In the anchor box, different boxes are used; here Intersection over Union (IoU) technique is used. It computes the IoU on two bounding boxes [71]. if IoU 0.5, foreground clause and < 0.5 Background clause carried out based on the bounding boxes and if the two bounding boxes match 50% and greater, it is a foreground clause. If it matches less than 50%, it is a background clause shown in Eq 4 [72]. Classification says whether the object is present or not, regression takes the output from convolution and plots the bounding boxes. The region produced from RPN is fed into an ROI pooling layer or maximum pooling layer of 7*7*512. After the pooling layer, it passes to two fully connected layers and gets output as Regressor and Classifier. The softmax classifier will tell us the type of clause, and the Regressor will form the bounding box [73].
 |
(4) |
4. DISCUSSION
Diagnosing cardiovascular Diseases is essential to give proper treatment. The primary technique for diagnosing heart disease is an electrocardiogram. The most popular ECG used is the 12 Lead ECG. Signals from the body will be recorded and printed on a graph sheet. Heart abnormalities are diagnosed using the printed wave. Deep learning reduces time complexity and increases diagnosing accuracy.
Different convolution networks with different backbone network layers are used to detect the object in an image. Faster R-CNN is a recent technique that takes less time to train the data, and for backbone techniques, ResNet-50 and VGG-16-like techniques are used. Many datasets are publicly available; different convolutional layer techniques are used to detect the object. Different researchers used these techniques and accurately detected the object shown in Table 5 . An important challenge is detecting the small objects in an image; therefore, detecting a smaller object FPN will give a good object recognition result because FPN will predict the object in a pyramidal fashion.
We can’t use precision techniques; instead, Mean Average Precision (mAP) is used. Because for detecting objects, we need to calculate both the localization and classification shown in Eq 5.
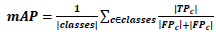 |
(5) |
Further work can be carried out using Faster R-CNN methods with independent backbone networks like Resnet and FPN. In existing work, SSD is used to detect the object in an image, but it only detects the large object in an image and fails to detect the smaller object [77, 78]. Detecting the smaller object is important in the medical field, like ECG; a small wave change in an image may indicate some abnormality. So, Faster R-CNN techniques can be used.
4.1. Issues/Challenges
4.1.1. Data Imbalance
The dataset available in the repository [48] has an imbalanced set of images in all classes, which will affect the performance. So, balancing the available dataset is important. There are several ways to balance the dataset; let us take any two classes Abnormal Heart Beat (AHB) and Covid class, as 779 and 250 images.
4.1.1.1. Increasing the Image in the Lesser Class
Lesser class indicates the class has less number of images. Likewise, in our example, Covid has fewer images. Increasing the number of images from 250 to 779 will balance the class. We can increase the number of images by using image augmentation techniques.
4.2. Image Augmentation Issues
In most cases, image augmentation is carried out by rotating to the left and right for some degrees, but these augmentation techniques can’t be used for the ECG image dataset. Because the ECG image contains information in a waveform, if we rotate the image meaning of that waveform will be different, leading to information loss. Only the way is to change the Contrast, Hue, convert to grayscale, Saturations, etc.
| Network | Backbone | PCB Dataset | mAP |
|---|---|---|---|
| Faster R-CNN [74] | ResNet-50 | PCB | 85.2% |
| Faster R-CNN [75] | VGG-16 | VOC 2007 | 73.2% |
| Faster R-CNN [74] | ResNet-101 | PCB | 87.1% |
| Faster R-CNN [75] | VGG-16 | VOC 2012 | 70.4% |
| Faster R-CNN [74] | ResNet-101 with FPN | PCB | 90.8% |
| Faster R-CNN [75] | ResNet-50 with FPN | PCB | 86.4% |
| Fast R-CNN with RPN [67] | VGG-16 | COCO + VOC 2007 + VOC 2012 | 78.8% |
| Fast R-CNN with RPN [67] | VGG-16 | VOC 2007 + VOC 2012 | 73.2% |
| YOLOv3 [74] | MobileNet | PCB | 70.6% |
| Faster R-CNN | NAS-FPN | Flower | 87.6% |
| SSD [76] | MobileNet v2 | Flower | 80.6% |
4.3. Mis-labeling
It is important to be careful while labeling the class of an image, as the wrong indication of an image will raise issues.
4.3.1. Machine Problem
While taking ECG, in the ECG graph sheet, we will get the class of the particular patients. Sometimes the waves in the graph sheet will be normal, but the machine gives the patients diseases like MI. This is an important problem that needs to be cross-checked.
4.3.2. Lack of Knowledge
The person not from a medical background trying to label the dataset is another problem that needs to be cross-checked with experts who are knowledgeable in ECG.
4.3.3. Image Belongs to many Classes
This is a major problem that arises while classifying diseases. If the patient has one or more diseases, that patient’s image will belong to two or more different classes. This issue can be solved by keeping the same patient details in all the respective classes is important.
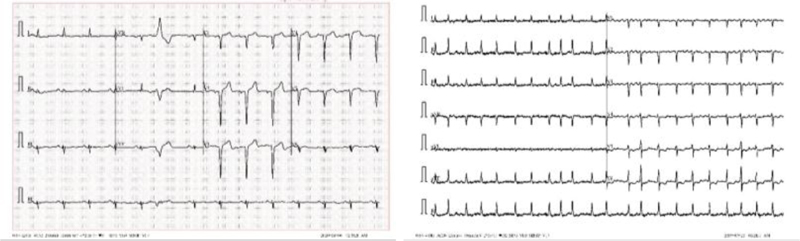
4.4. Format Difference
From Fig. (11), we can see two different lead alignments of ECG. This lead alignment is different; classifying it may lead to the misclassification of the diseases. By using Deep Learning, we can correctly predict diseases.
CONCLUSION
Deep Learning is widely used in the medical field to diagnose diseases automatically. It helps us minimize manual time and accurate detection and avoids the wrong prediction because of manual and machine detection. Before using the Deep Learning techniques on ECG images to diagnose heart diseases, learning manual procedures to detect the type of diseases by seeing the ECG graph sheet is important. For this purpose, disease interpretation for various heart diseases is discussed. Then Deep Learning techniques are discussed; segmentation of each lead, pre-trained models, and different detection techniques are discussed. This paper compared different DNN techniques’ accuracy and their various associated challenges.
LIST OF ABBREVIATIONS
| ECG | = Electrocardiogram |
| ML | = Machine Learning |
| DL | = Deep Learning |
| DNN | = Deep Neural Network |
| CNN | = Convolutional Neural Network |
| aVR | = Augmented Vector Right |
| aVL | = Augmented Vector Right |
| aVF | = Augmented Vector Right |
| RNN | = Recurrent Neural Network |
| VGG | = Visual Geometry Group |
| ROI | = Region of Interest |
| RPN | = Region Proposal Network |
| AHB | = Abnormal Heart Beat |
CONSENT FOR PUBLICATION
Not applicable.
AVAILABILITY OF DATA AND MATERIALS
The data supporting the findings of the article is available in the Mendeley Data at http://dx.doi.org/10.17632/gwbz3 fsgp8.1, reference number [47].
FUNDING
None.
CONFLICT OF INTEREST
The authors declare no conflicts of interest, financial or otherwise.
ACKNOWLEDGEMENTS
Declared none.

