All published articles of this journal are available on ScienceDirect.

Advanced Enhancement Techniques for Breast Cancer Classification in Mammographic Images
Authors Info & Affiliations
Abstract
Background:
Breast cancer is one of the most significant health problems in the world. Early diagnosis of breast cancer is very important for treatment. Image enhancement techniques have been used to improve the captured images for quick and accurate diagnosis. These techniques include median filtering, edge enhancement, dilation, erosion, and contrast-limited adaptive histogram equalization. Although these techniques have been used in many studies, their results have not reached optimum values based on image properties and the methods used for feature extraction and classification.
Methods:
In this study, enhancement techniques were implemented to guarantee the best image enhancement. They were applied to 319 images collected from the Mammographic Image Analysis Society (MIAS) database. The Gabor filter and local binary pattern were used as feature extraction methods together with support vector machine (SVM), linear discriminant analysis (LDA), and nearest neighbor (KNN) classifiers.
Results:
The experimental work indicates that by merging the features of the Gabor filter and local binary pattern, the results were 97.8%, 100%, and 94.6% for normal/abnormal and 85.1%, 88.7%, and 81.9% for benign/malignant using the SVM, LDA, and KNN classifiers, respectively.
Conclusion:
The best results were obtained by combining the features of the two tested strategies and using LDA as a classifier.
1. INTRODUCTION
Breast cancer is a perfidious disease that leads to a large number of deaths in women [1]. There are many techniques used for detecting breast cancer, such as mammography, ultrasound, magnetic resonance imaging (MRI), thermography, and electrical impedance tomography. Mammography has a high specificity and sensitivity to detect cancer together with better resolution and more accuracy in detecting abnormalities deeper in breast tissue, although it uses ionizing radiation and is less sensitive to radiographically dense breasts [2]. On the other hand, ultrasound has a high diagnostic utility in women with dense breasts [3], which uses nonionizing radiation and is a safe technique. However, it cannot capture an image of the entire breast. MRI is a very accurate test with approximately 100% efficiency and can detect the intraductal spread of cancer, but it has poor specificity and is very expensive compared to others [4, 5]. On the contrary, thermography is non-invasive, non-radioactive, and promising for dense breasts [6]. However, it is easily affected by temperature and poorly extracts images from large breasts. Electrical impedance is non-invasive, non-radiative, and risk-free, works well with dense breasts, and is reasonably priced [7-9], but it has poor resolution [10]. Sahiner et al. used mammography and a convolutional neural network (CNN) to classify cancer as normal/abnormal [11]. Nega et al. used linear discriminant analysis (LDA) as a classifier [12]. However, 92% accuracy for normal/abnormal and 80% accuracy for benign/malignant were achieved by using the support vector machine (SVM) classifier, discrete wavelet transforms (DWT), and discrete shearlet transform (DST) [13]. Using the SVM classifier and wavelet decomposition, 80% accuracy was achieved at 1.1 fps/I by Campanini et al. [14], and by using the SVM classifier, 85.11% accuracy was achieved at 1.44 fps/I by Ke et al. [15]. Magnetic resonance imaging (MRI) [16-19], which uses subtracted mean intensity projection images, evaluates a fully automatic CAD system. A semiautomatic segmentation algorithm achieved accurate and consistent breast lesion segmentation in the study by Ritter et al. [20]. It is different from using ultrasound as in the study by Eltoukhy et al. [21, 22], which uses curvelet and wavelet transformation and nearest neighbor as a classifier, achieving 94.07% accuracy, while wavelet 90.07% and curvelet transform achieving 94.28% accuracy for abnormal. After the classification of the Euclidian distance and curvelet transform for feature extraction, 98.59% accuracy was achieved in the study by Eltoukhy et al. [22]. Using the local discrete cosine transform (LDCT) and curvelet transform in the wrapping technique, 77.3% accuracy was achieved by Gardezi et al. [23]. The use of a support vector machine and 1238 coefficients and 150 features achieved an accuracy of 95.84% for normal/abnormal and 96.56% for benign and malignant lesions in the study conducted by Eltoukhy et al. [24, 25]. In addition, a marker-controlled watershed transformation algorithm achieved 84.848% accuracy in the study by Shareef [26].
An image preprocessing technique was used to improve the image features and prepare for further processing by eliminating unrelated and spare parts from the background of the mammogram images [27]. Preprocessing used many steps to make the image ready to use, such as the median filtering technique, edge enhancement, dilation, erosion, and contrast-limited adaptive histogram equalization. The median filter is a nonlinear filter that efficiently eliminates the salt-and-pepper noise. The median tends to maintain the sharpness of image edges while removing the noise. Edge enhancement is the simplest linear filter that assigns equal weights (Wk) to all neighborhood pixels. A weight of Wk = 1/(NM) was used for the N × M neighborhood. It is used as a filter to suppress noise in an image and remove Gaussian noise with a reasonable effect. The mean filter smoothens and blurs the images [28]. Dilation and erosion affect the shape, structure, and the form of objects. Dilation is used to add pixels at the region's boundaries or to fill in holes in the image [29]. Dilation can also be used to connect disjoint pixels and add pixels at edges. Erosion does the opposite operation of dilation; erosion reduces boundaries and increases the size of holes. Contrast-limited adaptive histogram equalization (CLAHE) was originally applied to the enhancement of low-contrast medical images [30-32]. CLAHE differs from ordinary AHE in terms of contrast limitations. CLAHE introduces a clipping limit to overcome the noise amplification problem. CLAHE limits the amplification by clipping the histogram to a predefined value before computing the cumulative distribution function (CDF). Regarding feature extraction techniques, many studies have used the Gabor filter, wavelet transform, and local binary pattern (LBP). The Gabor filter provides the highest response at the points and edges where texture changes. Owing to these characteristics, algorithms based on Gabor filters have been successfully applied in computer vision applications [33], such as texture extraction [34, 35]. The general form of the 2D (for mammographic images) Gabor filter family is characterised by a Gaussian kernel adapted by an oriented complex sinusoidal wave [36]. LBP is an effective method for extracting textural features. The LBP operator converts the image into an array or an image with integer labels, illustrating a small-scale appearance of the image [37].
Support vector machine (SVM), linear discriminant analysis (LDA), and nearest neighbor (KNN) classifiers were used in our research. SVM is a machine learning technique that categorizes binary classes by obtaining and using a class boundary hyperplane, thereby expanding the margin of the offered training data. The training data samples along the hyperplanes close to the class boundary are known as support vectors, and the margin is the space between the support vectors and class boundary hyperplanes. The SVM is established based on the idea of decision planes that identify decision boundaries. The decision plane differentiates sets of items with different class memberships. The SVM is a valuable procedure for data classification. A classification mission typically involves training and testing data comprising data instances [38].
Linear discriminant analysis (LDA) is a frequently used procedure for data classification and dimensionality reduction. LDA handles situations in which within-class frequencies are unequal, and their actions are analysed using randomly generated data. This approach maximizes the ratio of between-class variance to within-class variance in any specific dataset, thereby ensuring maximal separability [39]. LDA often delivers robust, reliable, and interpretable results in a simple manner. When faced with real-world classification difficulties, LDA is repeatedly the first benchmarking technique before other more complicated and adaptable techniques are utilized [40].
The nearest neighbor classifier (KNN) is a commonly used pattern classification procedure owing to its ease and productivity [41-43]. Furthermore, KNN, a flexible multivariate statistical technique, uses the standard Euclidean distance to estimate the data [44, 45]. KNN evaluates the class aspect based on the k-nearest training models in the feature space. When a dataset is offered, it selects the k-nearest samples from the categorized training data and determines the class taking into consideration the most representative samples. The Euclidean distance similarity metric was applied to select neighborhoods. Our study aimed to differentiate between normal and abnormal mammographic breast images and to accurately diagnose these images.
2. MATERIALS AND METHODS
2.1. Data
The data were gathered using the Mammographic Image Analysis Society (MIAS) database, which categorizes breast tissues as normal, benign, or malignant. Although breast tissues may be classified as fatty, fatty glandular, or dense glandular, the collected images are diagnosed using image processing algorithms. The collected images were analyzed using 1024 × 1024 pixels. Their distribution is shown in Table 1, considering the radius of the abnormality as 197 pixels.
| Types of Images | Normal | Benign | Malignant |
|---|---|---|---|
| 319 | 209 | 60 | 50 |
2.2. Image Preprocessing
Image preprocessing techniques are regarded as one of the most significant steps for improving image quality by reducing noise or other undesired regions.
Image segmentation is used to cut and change images into abnormal regions for easy detection and diagnosis of ROIs (regions of interest). Beginning manually, a circle of radius 197 pixels was considered.
Four different preprocessing procedures were used, and each technique had its own filtration sequence. As indicated in Table 2, the median filter, average filter dilation, erosion, and adaptive histogram are four filters that can be used in specific sequences. The key variation between these sequences is the order in which filters are applied. For example, in sequence four, an adaptive histogram is first applied, followed by dilation, erosion, median filter, and average filter.
| Sequence | 1 | 2 | 3 | 4 | 5 |
|---|---|---|---|---|---|
| Seq1 | Median | Average | Dilation | Erosion | Adaptive histogram |
| Seq2 | Adaptive histogram | Dilation | Median | Average | Erosion |
| Seq3 | Adaptive histogram | Average | Erosion | Dilation | Median |
| Seq4 | Adaptive histogram | Dilation | Erosion | Median | Average |
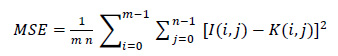
The extracted and filtered images were examined and compared using the mean square error (MSE) and structural similarity index (SSIM) to determine the best applied scenario to make the image clearer and noise-free.
The mean square error is the most common form of image quality. A higher MSE value indicates lower image quality. MSE is defined as follows:
 |
(1) |
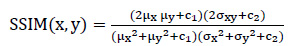
SSIM is also used to measure the similarity between the two images in order to assess the difference in the quality of the generated image from the original image. With a moving window, SSIM considers the arrangement of image values by quantifying pixel intensities, which are composed of three components: brightness, contrast, and structure. SSIM calculates the similarity between two images, X and Y, as expressed by the following equation:
 |
(2) |
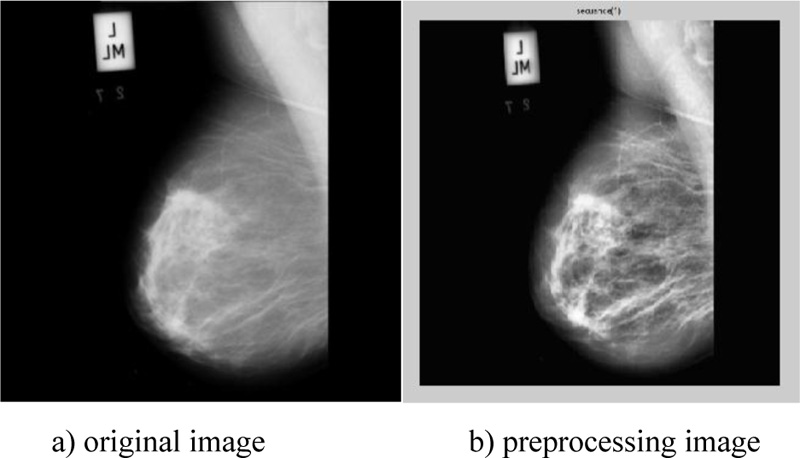
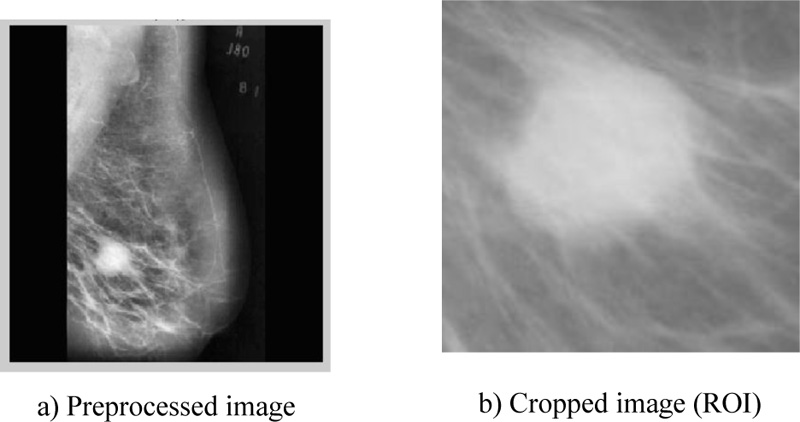
According to the retrieved findings of the two tested methodologies, scenario-2 of the sequence (adaptive histogram, dilation, median, average, and erosion) obtained the highest score, as shown in Table 3. The original image and preprocessing image are illustrated in Fig. (1), whereas Fig. (2) shows the image after it has been processed as well as the ROI extraction.
| Sequence No. | Seq1 | Seq2 | Seq3 | Seq4 |
| MSE | 54.0915 | 56.0948 | 52.6007 | 55.0121 |
| SSIM | 0.5165 | 0.5187 | 0.5198 | 0.5191 |
3. EXPERIMENTAL
3.1. Feature Extraction
To select the most effective features in the gathered photos, the Gabor filter and local binary pattern were employed as feature extraction techniques, with features combined between them. Fig. (3) shows the flowchart of the completed work.
3.1.1. Gabor Filter
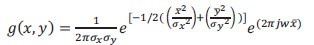
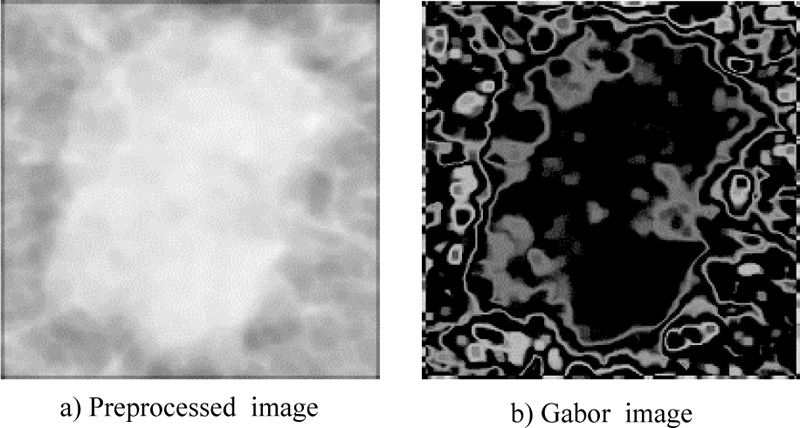
The Gabor filter is a linear filter used to extract information from images, such as texture (mean, standard deviation, skewness, variance, mean absolute, and maximum energy). Fig. (1) shows the ROI of the mammography image before and after using the Gabor filter (eq. 4) at points and edges where the texture changes. Algorithms based on Gabor filters have been effectively employed in breast cancer images to extract significant features and data to aid the classification process using these characteristics (Fig. 4). A Gaussian kernel modulated by an oriented complex sinusoidal wave represents the generic form g(x, y) of a 2D Gabor filter family, as shown in equations 3-6:
 |
(3) |
 |
(4) |
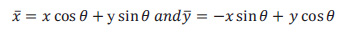
Where, δx and δy are the scaling parameters, W is the central frequency of the complex sinusoid, and ϴ ϵ [0, π] is the orientation of the normal to the parallel stripes of the Gabor function.
 |
(5) |

 |
(6) |
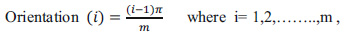
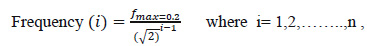
Where, m is the total number of orientations and n is the total number of frequencies.
3.1.2. Local Binary Pattern
An LBP is a robust description of textures. The features were extracted based on a threshold. This method has proven to be a powerful tool for extracting texture features from images, such as the mean intensity value, contrast, correlation, and entropy. The mammogram image preprocessing and after the local binary pattern are shown in Fig. (5).
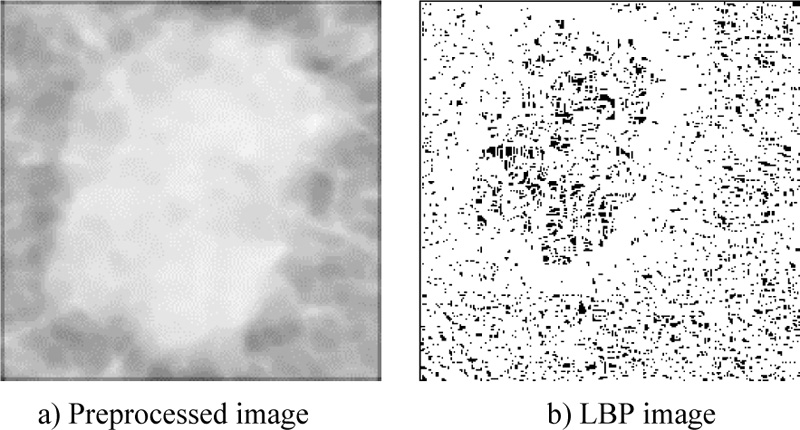
Local binary pattern (LBP) was used to calculate the mean intensity value, contrast, correlation, and entropy of the studied image, which was considered a texture descriptor. Texture was defined for each pixel using the local structure. The binary code is extracted based on the intensity level differences between neighboring pixels. The pixel intensity level was used as the threshold value for surrounding pixels.
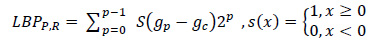
The general form of a local binary pattern (LBP) is represented by equation 7, as follows:
 |
(7) |
Where, gp is the value of its neighbors, gc is the gray value of the central pixel, P is the total number of neighbors involved, and R is the radius of the neighborhood. To calculate the accuracy of the classifier, a merged Gabor filter and local binary pattern features are employed as a new group of features. Ten features were created by combining these values, including mean, standard deviation, skewness, variance, mean absolute, maximum energy, mean intensity, contrast, correlation, and entropy. To determine the best features, three groups of features were introduced for the three classifiers.
3.2. Classification
After collecting three groups of features, 1) Gabor filter features, 2) local binary pattern features, and 3) merged features, the features were classified using three techniques: support vector machine (SVM), linear discriminant analysis (LDA), and nearest neighbor (KNN) classifiers. In KNN, the cosine distance metric and equal distance weights, together with 10 neighbors, are the adjusted parameters. The linear kernel function, together with the multiclass method, is an SVM factor, whereas LDA assigns a full covariance structure. These parameters are assigned to implement the classification process.
4. RESULTS
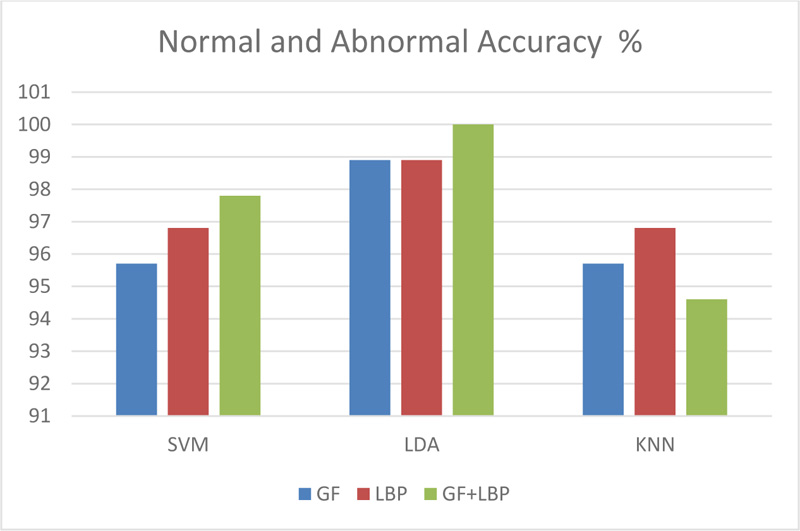
In this paper, 319 images were obtained from the Mini-MIAS database (Mammographic Image Analysis Society). The images were divided into 209 normal and 110 abnormal for the mass/non-mass classification. For benign/ malignant legions, 110 images were divided into 60 benign and 50 malignant lesions. The images were grayscale, with a size of 1024 × 1024 pixels.The ROI was manually extracted, with a radius of 197 pixels. The images were processed via a group of filters, such as adaptive histogram equalization, dilation, median, average, and erosion as selected sequences/scenarios that satisfied the best MSE and SSIM scores. Three groups of features were used: 1) features from the Gabor filter, 2) features from LBP, and 3) features from merging (GF+LBP). Three classifiers, SVM, LDA, and KNN, were used to classify the images as either normal/abnormal or benign/malignant. The combination of LDA as a classifier and GF+LBP as a group of features has satisfied the highest results with 100% differentiation between normal and abnormal images, as illustrated in Fig. (6).
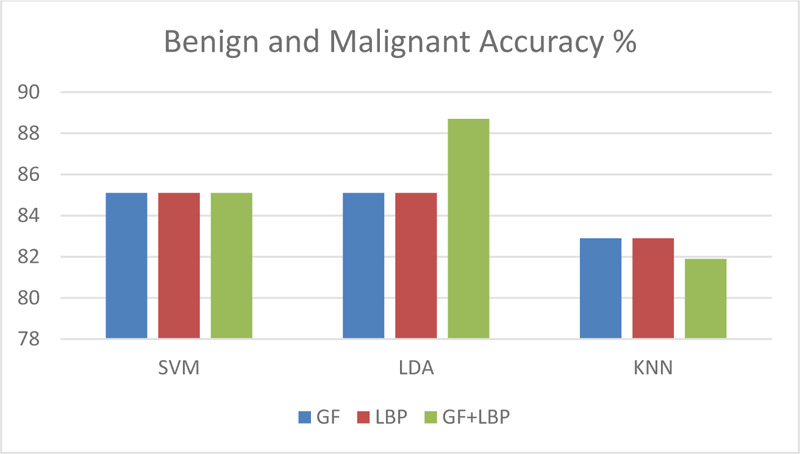
The experimental results indicated that when using the Gabor filter, the results were 95.7%, 98.9%, and95.7% for normal/abnormal, and 85.1%, 85.1%, and 82.9% for benign/malignant using SVM, LDA, and KNN as classifiers, respectively. Using the local binary pattern for feature extraction, the results were 96.8%, 98.9%, and 96.8% for normal/abnormal and 85.1%, 85.1%, and 82.9% for benign/malignant, using SVM, LDA, and KNN as classifiers, respectively. By merging the features of the Gabor filter and local binary pattern features, the results were 97.8%, 100%, and 94.6% for normal/abnormal and 85.1%, 88.7%, and 81.9% for benign/malignant by using SVM, LDA, and KNN classifiers, respectively.
As shown in Fig. (7), the accuracy of applying classifiers to abnormal cases (benign and malignant) was 88.7% in the case of applying LDA together with combined features. Furthermore, as shown in Table 4, a comparison of the proposed technique and previous work ensures that the calculated results meet the higher accuracy, particularly in distinguishing between normal and abnormal cases.
| Paper | Database | Feature Extraction | Classifier | Accuracy |
| Breast cancer detection with Gabor features from digital mammograms (2010) [46] | DDSM | Gabor filter | KNN | TP=90% at FPI=1.21 TP=93% at FPI =1.19 |
| A comparison of different Gabor feature extraction approaches for mass classification in mammography (2015) [47]. | MIAS, DDSM | Bank of Gabor filter | KNN | TP=90% at FPI=1.21 TP=93% at FPI=1.19 |
| Breast tumor detection and classification in mammograms: Gabor wavelet vs. statistical features (2018) [48] | DDSM | Gabor, wavelet, statistical | SVM, KNN | 79.50% |
| Breast tissue classification using Gabor filter, PCA, and support vector machine (2012) [49] | MIAS | Gabor filter | SVM | 84.37% |
| Optimized Gabor features for mass classification in mammography (2016) [50] | MIAS, DDSM | Gabor features | SVM | 98.8% (normal/masses) 93.95% (benign/malignant) |
| Classification of breast cancer using local binary pattern and Gabor filter (2017) [51] | MIAS | Local binary pattern, Gabor filter | SVM | Benign 89.28% Normal 79.61% Malignant 70.37% |
| Computer-aided model for breast cancer detection in mammograms (2016) [52] | MIAS | Texture features, intensity features | LDA | 93% normal/abnormal 79% benign/malignant |
| Breast tissue classification using local binary pattern variants: a comparative study (2018) [53] | MIAS | LBP | SVM, KNN, Bayesian network, Random Forest | SVM 66% KNN 69.2% Bayesian network 70.1% Random forest 67.3% |
| A study of different texture features based on the local operator for benign-malignant mass classification (2016) [54] | DDSM | LBP | Fisher linear discriminant analysis (FLDA) | 92.20% |
| LBP features for breast cancer detection [55] | DDSM [56], MIAS [57] | LBP | SVM | 84% |
| Our proposal | MIAS | Gabor filter, LBP, GF+LBP | SVM, LDA, KNN | N/Ab B/M Gabor filter SVM 95.7% 85.1% LDA 98.9% 85.1% KNN 95.7% 82.9% LBP SVM 96.8% 85.1% LDA 98.9% 85.1% KNN 96.8% 82.9% GF+LBP SVM 97.8% 85.1% LDA 100% 88.7% KNN 94.6% 81.9% |
| Advanced enhancement techniques for breast cancer classification in mammographic images |
Mammographic Image Analysis Society (MIAS)
5. DISCUSSION
Based on the experimental results, KNN was observed to be a poor classifier, either for differentiating between normal and abnormal images or between benign and malignant images. SVM techniques provided equal results for abnormal images for all three feature groups. The texture descriptor extracted from the LBP and the maximum response at points and edges extracted from the Gabor filter correlated to the observed differences in the results between normal and abnormal images. The same accuracy as that of the LDA classifier was obtained using features extracted from either GF or LBP.
CONCLUSION
This paper has introduced a combined system that uses the best sequences of preprocessing enhancement techniques after manually segmenting ROIs extracted from the MIAS database. Three distinct classifiers were used to classify the features obtained from the Gabor filter (GB) and the local binary pattern (LBP). The LDA classifier achieved substantial improvement by integrating the features, achieving 100% accuracy for normal/abnormal images and 88.7% accuracy for benign/malignant images. The advanced technique combines these methods and determines the appropriate order of picture enhancement techniques based on the image database used.
LIST OF ABBREVIATIONS
| MIAS | = Mammographic Image Analysis Society |
| SVM | = Support Vector Machine |
| LDA | = Linear Discriminant Analysis |
| CDF | = Cumulative Distribution Function |
ETHICAL STATEMENT
The database that supports the results of this research is available online and cited appropriately. We were concerned only with data analysis and methodology and not with any clinical testing. Mammographic Image Analysis Society (MIAS) database has been used for this study. This study has been approved by the medical ethics committee.
CONSENT FOR PUBLICATION
Not applicable.
FUNDING
None.
CONFLICT OF INTEREST
The authors declare no conflict of interest, financial or otherwise.
ACKNOWLEDGEMENTS
Declared none.

