All published articles of this journal are available on ScienceDirect.

Monitoring of Surgical Wounds with Purely Textile, Measuring Wound Pads – II. Detection of Bacterial Inflammation by Measurement of Wound Tissue Temperature
Abstract
Aims:
This study was executed to aquire basic knowledge on relations between design characteristics and the quality of measurements, as well as the optimization of the design of purely textile, measuring wound dressings for the detection of wound tissue warming as an indicator for (bacterial) inflammation.
Background:
The normal healing of surgical skin wounds may be disrupted by complications, by far the most common being post-operative bacterial infections.
Objective:
The temperature of the wound and its surroundings – the main indicative parameter for the onset of bacterial inflammation – can be determined and shown by means of functionalized, purely textile wound dressings with measuring capability when used as part of a measuring and assistance system. The textile sensors comprise insulated electrical wires stitched onto a textile backing designed as double meander, which is appropriate for the detection of temperature, moist, and rectangular transverse elongation (indicating inflammation, bleeding or seroma discharge, and tissue volume increase as a sign of haemorrhage (into the tissue) or seroma formation).
Methods:
Major design parameters are diameter of the electrical conductor (wire) / distance between an electrical conductor and the nearest (parallel) conductor / spacing of the embroidered seams (upper thread loops) along a conductor / number of meander loops, and length, width, and area of the double meander sensor array.
Results:
Skin temperature rises a few degree Celsius resulting in differences in ohmic resistance in the order of a few parts per thousand. The ohmic resistance of the electrical sensor wire as measurement for the temperature under the dressing solely depends on the length of the wire. Neither the spacing between the sections of wire nor the spacing of the upper thread has any detectable direct effect on the determination of the temperature.
Conclusion:
To improve measuring accuracy, sensor wires as thin as possible should be used for two reasons: (1) because their ohmic resistance is higher, simplifying measurement, and (2) because they can be stitched closer together in wound dressings, enabling a longer sensor wire to be used in the area of interest.
1. INTRODUCTION
The normal healing of surgical skin wounds may be impaired or interrupted by complications [1]. By far the most frequent complications are (1) post-operative surgical site infections (SSIs), (2) bleeding and seroma discharge from the wound, and (3) the formation of haematoma or seroma in peri-vulneral tissue [2]. Despite strict asepsis in the operating theatre, post-operative SSIs are the most common nosocomial infections and therefore probably also the most common post-operative healing disorder.
The above-mentioned complications in post-operative wound healing can be detected with functionalized, purely textile dressings with measuring capability when used as part of a measuring system [3-5]. An assistance system based on a measuring system of this type would eliminate the need to frequently change dressings unnecessarily, thus preventing the considerable risk of bacterial contamination – and also saving nurses’ time [3].
One extremely important parameter which can be used to monitor the healing of surgical wounds is the temperature beneath the dressing, since an increase in temperature is a key indicator of the onset of bacterial inflammation [2], and therefore a focus of research in wound monitoring [6-12]. In the sensor system presented here, the temperature is determined by measuring the ohmic resistance of electrically conductive sensor wire that has been suitably integrated into a functionalized textile dressing.
2. MATERIALS AND METHODS
2.1. Measuring Instruments
A ‘WK 6500/5 B Precision Impedance Analyser’ (Wayne Kerr Electronics, Chichester / UK) with gold-plated terminals in 4-wire technology was used to measure ohmic resistance R.
Measurement errors are only quoted by the manufacturer for standard electrical conditions (measurements from 1 to 10 Ω with the use of a special component holder). The estimated relative measurement inaccuracy (δR/R) when using gold-plated connecting terminals in 4-wire technology is < 0.2%.
2.2. Skin Temperature Model
A technical skin model with typical surface temperatures of healthy skin or a post-operative skin suture with early, still localized inflammation was described in a previous paper [3]. The surface of the model consists of the POM thermal insulator and is either (1) continuous (meaning the surface temperature is homogeneous) or (2) has an aluminium cuboid acting as a thermal bridge placed inside a slot (5 mm ∙ 50 mm) to conduct heat from below to the surface – this simulates a linear skin suture with an increase in temperature of about 1.26 °C (Fig. 1).
The surface of the aluminium cuboid and the temperature difference define a ‘difference threshold’ of the surface temperature, causing a difference in ohmic resistance when dressing samples are measured consecutively on both surfaces. The size of this difference varies depending on the dressing used.
2.3. Temperature Measurements
The textile sensors were placed centrally and straight (parallel to the sides) on the surface of the temperature model, weighted down with two Plexiglas plates (about 90 mm ∙ 90 mm, 2 mm thick, resp.), and gently pressed down, thus covering the model and also thermally insulating it from heat radiation losses [3]. Furthermore, a flat cardboard box (about 10 cm ∙ 10 cm ∙ 30 mm) without a lid and with the opening facing downwards was placed over the textile sensor and the Plexiglas plates to provide both additional thermal insulation and a mechanical barrier against air currents.
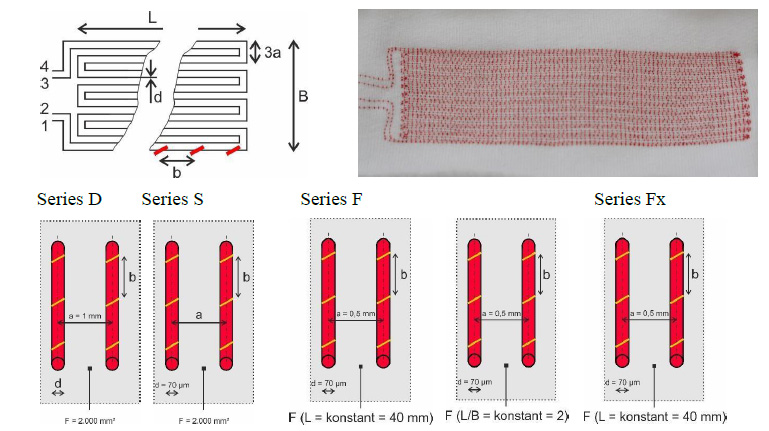
Top left: Symbolic diagram of the sensor wire array of the wound dressing samples. Of the connections on the left (1, 2, 3, 4), 1 and 4 are connections at both ends of the same sensor wire, and the same applies to connections 2 and 3.
Top right: Photo of an example of a wound dressing.
Bottom: Representation of the variables (larger letters) of the series from left to right:
Series D (wire diameter d and stitching spacing b), Series S (conductor spacing a and stitching spacing b), Series F (Sub series L and Q; area of sensor array F and stitching spacing b), Series Fx (width of sensor array B and stitching spacing b).
Readings were taken once thermal equilibrium had been reached (usually after about 25 ± 5 minutes), as confirmed by a temperature constancy at two measuring points (1) in the centre of the POM surface or of the aluminium cuboid bridging the slot in the POM surface (point T1) as well as (2) in the POM surface about 5 mm away from the slot and at right angles to it (point T2) (see Fig. 2 in [3]).
2.4. Textile Sensors
The textile sensors were contract-manufactured by the ITA Institute for Textile Technology at RWTH Aachen University following the development of a suitable production process.
The textile backing was made from cotton jersey (‘white/heavy/elastic, type SW 45542-5003’, Scheffer & Wiggers, Nordhorn / D, 95% cotton, 5% elastane) with 30% reversible stretch. To enable stitching, the textile backing was clamped between two layers of water-soluble PVA paper (SolvyFabric, Gunold, Stockstadt / D), which was later dissolved in lukewarm water and completely washed out.
The electrical conductors were enamelled copper wires (‘Cu-ETP 99.95%’, Elektrisola Dr. Gerd Schildbach, Reichshof / D) with the following diameters: 0.071 mm (71 µm), 0.14 mm (140 µm) and 0.21 mm (210 µm). They served as a model for non-toxic wires made of silver, which would be necessary in possible future medical applications on humans. This is because the complete integrity of the insulating enamel probably cannot be guaranteed – and copper is toxic to cells (and thus inhibits healing).
Only double meanders were produced and examined as geometrical patterns for positioning the sensor wires before stitching them on. No fundamental advantages are likely to be yielded by any other possible geometries (e.g,. spirals or (single) meanders). Moreover, double meanders theoretically allow other physical variables to be determined, namely an increase in humidity and elongation as explained in another study [3].
The sensor wires were embroidered onto the textile backing using an asymmetric double lockstitch seam (a modified form of stitch type 301) with an affixing suture thread and electrical conductors as the lower thread (= needle thread, upper thread = bobbin thread: ‘polyester multifilament thread Serafil 200, yellow’ or, for conductor spacing of 0.5 mm, ‘polyester multifilament thread Serafil 300/2, red’, Amann & Söhne, Bönnigheim / D) using a programmable embroidery machine ‘JF 0111-500’ (ZSK Stickmaschinen, Krefeld / D).
Textile sensors were manufactured with a range of variations so that the effect of different parameters could be systematically examined. At least three variants of each of the expected main factors of influence were included.
The following parameters were varied (Fig. 1 and Table 1):
d Diameter of the electrical conductor(wire)
a Distance between an electrical conductor and the nearest (parallel) conductor
b Spacing of the embroidered seams (upper thread loops) along a conductor
n Number of meander loops
L, B Length and width of the double meander sensor array
F Area of the sensor array (F = L ∙ B)
Details are shown in Fig. (1).
| WD-sample | L · B | F | d | a | b | n | Λ | Ew (R20) | Ew (R=) | F↑ | AF,↑ |
Ew (ΔrelR) |
|---|---|---|---|---|---|---|---|---|---|---|---|---|
| Type | / mm2 | / mm2 | / mm | / mm | / mm | / 1 | / mm | / Ω | / Ω | / mm2 | / 1 | / % |
| Serial D | ||||||||||||
| ‘d - b’ | 80 · | 1,840 | 1 | 1, 3 | 6 | 1,946 | 250 | 0.136 | 0.064 | |||
| 0,07 - b | 23 | 0.071 | 8.40 | 8.83 | ||||||||
| 0,14 - b | 0.14 | 2.16 | 2.27 | |||||||||
| 0,21 - b | 0.21 | 0.96 | 1.01 | |||||||||
| Serial S | ||||||||||||
| ‘a - b’ | 80 · | 0.071 | 1, 3 | 250 | ||||||||
| 0,5 - b | 23.5 | 1,880 | 0.5 | 12 | 3,865 | 16.7 | 17.5 | 0.133 | 0.063 | |||
| 1 - b | 23 | 1,840 | 1 | 6 | 1,946 | 8.40 | 8.83 | 0.136 | 0.064 | |||
| 1,5 - b | 22.5 | 1,800 | 1.5 | 4 | 1,307 | 5.64 | 5.93 | 0.139 | 0.065 | |||
| 2 - b | 22 | 1,760 | 2 | 3 | 988 | 4.27 | 4.48 | 0.142 | 0.067 | |||
| Serial F | ||||||||||||
| Q/Lx - ‘b’ | 0.071 | 0.5 | ||||||||||
| Q1 - b | 20 · 9.5 | 190 | 1 | 5 | 417 | 1.80 | 1.89 | 100 | 0.526 | 0.248 | ||
| Q2/L2-b | 40 · 19.5 | 780 | 10 | 1,620 | 7.00 | 7.35 | 200 | 0.256 | 0.121 | |||
| Q3 - b | 80 · 39.5 | 3,160 | 20 | 6,441 | 27.8 | 29.2 | 250 | 0.079 | 0.070 | |||
| L1 - b | 40 · 9.5 | 380 | 5 | 811 | 3.50 | 3.68 | 200 | 0.526 | 0.248 | |||
| L3 - b | 40 · 29.5 | 1,180 | 15 | 2,431 | 10.5 | 11.0 | 200 | 0.169 | 0.080 | |||
| Serial Fx | ||||||||||||
| F’b - B’ | 40 · | 0.071 | 0.5 | 1 | 200 | |||||||
| Fb - 5 | 5.5 | 220 | 3 | 487 | 2.10 | 2.21 | 0.909 | 0.428 | ||||
| Fb - 10 | 9.5 | 380 | 5 | 811 | 3.50 | 3.68 | 0.526 | 0.248 | ||||
| Fb - 15 | 15.5 | 620 | 8 | 1,297 | 5.60 | 5.89 | 0.323 | 0.152 | ||||
L, B, F Length, width, and area of the sensor array
d Diameter of sensor wire, a Sensor wire spacing
b Stitching spacing, n Number of meander loops
Λ Total length of sensor wire, Λ = 2 ∙ [B + 2 ∙ a + 2 ∙ n ∙ (L – a)]
Ew(R20) Calculated expected values of the ohmic (total) resistance of both sensor wires at 20 °C
Ew(R=) Calculated expected value of ohmic resistance at 33 °C
F↑ Additionally heated sensor area, area of the sensor array of dressing samples lying on the surface of the warmer aluminium cuboid (L ∙ B = 50 mm ∙ 5 mm, F = 250 mm2)
AF,↑ Additionally heated sensor area fraction, fraction of the area of the sensor array of dressing samples lying on the surface of the warmer aluminium cuboid
Ew(ΔrelR) Expected value of the relative differences in ohmic resistance, Ew(ΔrelR) = [Ew(Rp↑) – Ew(R=)] / Ew(R=)
To measure ohmic resistance, both sensor wires (between ends 1 and 4, and between 2 and 3, see Fig. (1) were soldered together on one side (3 to 4) to achieve the maximum possible extension (doubling) of the sensor wire length in the textile sensors and thus connected (electrically) in series. The (total) length Λ of both sensor wires (1 to 4 and 2 to 3 as shown in Fig. (1) is calculated as a series connection using the formula: Λ = 2 [B + 2a + 2n(L – a)]. Having a longer measuring conductor raises the ohmic resistance and improves the accuracy of the measurements since ΔR/ΔT ~ R0. The sensitivity ΔR/ΔT is the change ΔR in an ohmic resistance R0 when the temperature changes by ΔT.
Table 1 shows an overview of the dressing samples produced and their structural characteristics.
2.5. Determination of the Expected Ohmic Resistances and Differences in Resistance
The ohmic resistance of a conductor wire is the sum of the ohmic resistances of all the sections of the wire of any selectable length. If the temperature of the surface of the temperature model is homogeneous, all the sections of wire in the dressing sensor will have the same temperature, whereas in the case of a simulated local inflammation, the sections of sensor wire above the warmer ‘wound suture’ will also be warmer. Due to the positive temperature coefficient of copper, the ohmic resistance increases with the temperature. The correlation between the total ohmic resistance of the dressing sensor and the proportion of sensor wire that undergoes additional warming is strictly linear.
The (absolute) ohmic resistance R of the conductor wire in the dressings is correlated with the diameter of the wire d (according to the formula R = 4ρΛ / πd2, where ρ is the specific ohmic resistance and Λ the length of the sensor wire) [13]. This also applies to temperature-dependent differences ΔR = RB – RA (A and B denote two states of the dressing sensor array with different mean temperatures above the skin suture simulated by the temperature model).
Conversion into relative differences ΔrelR = ΔR / Rx = (RB – RA) / Rx (x denotes here a freely selectable reference state, preferably A or B) eliminates the correlation with the wire’s diameter d. This allows the measurements for all the dressing samples examined to be compared to each other, regardless of their structural characteristics, for example as measurements of the relative differences in the ohmic resistance of the dressing samples plotted as dependent variables against the calculated expected values of the relative differences in the ohmic resistance of the dressing samples as independent variables.
Calculated expected values (Ew) of the differences in ohmic resistance of wound dressing samples caused by a localized increase in temperature were calculated using the temperature coefficient of ohmic resistance of copper αCu,20 = 0.00393 / K and the loop resistance (resistance load per unit length) at 20 °C Ew(R20)* = Ew(R20) / Λ (Λ: length of the sensor wire) as follows [13]:
1. Expected values of ohmic resistance (at a homogeneous temperature of 20 °C) Ew(R20)
The expected (total) ohmic resistance of both sensor wires at 20 °C is calculated as the product of the manufacturer’s specification of the loop resistance (resistance load per unit length) Ew(R20)* = Ew(R20) / Λ
[d | Ew(R20)*: 0.071 mm | 4.318 Ω/m, 0.140 mm | 1.110 Ω/m, 0.210 mm | 0.493.5 Ω/m ]
and the sensor wire length Λ (Table 1)
Ew(R20) = Ew(R20)* ∙ Λ
2. Expected ohmic resistance without localized temperature increase (at a homogeneous temperature of 33 °C) Ew(R=)
The expected ohmic resistance at a homogeneous temperature of 33 °C Ew(R=) is calculated as follows:
Ew(R=) ≡ Ew(R33) = Ew(R20) ∙ [1 + αCu,20 ∙ ∆T]
where ΔT = 33.0 °C – 20 °C = 13.0 °C (= 13.0 K), αCu,20 is the temperature coefficient of copper at 20 °C (αCu,20 = 3.93 ∙ 10–3 / K [14]), and [1 + αCu,20 ∙ 13.0 K] = 1.05109
3. Expected ohmic resistance upon a complete temperature increase to 34.26 °C Ew(R↑)
The expected ohmic resistance Ew(R↑) upon a complete temperature increase (ΔT) of 1.26 °C (= 1.26 K, from 33.0 °C to 34.26 °C) is calculated as follows:
Ew(R↑) = Ew(R34,26) = Ew(R20) ∙ [1 + αCu,20 ∙ ∆T]
where ΔT = 34.26 °C – 20 °C = 14.26 °C (14.26 K) and [1 + αCu,20 ∙ 14.26 K] = 1.05604
4. Expected ohmic resistance upon a partial temperature increase of the sensor array to 34.26 °C Ew(Rp↑)
The expected (calculated) total ohmic resistance Ew(Rp↑) is the length-weighted (and, since the density of the stitching is roughly uniform, also area-weighted) sum of all ohmic (partial) resistances of the sensor wires. It is made up of the resistance across the POM surface of the temperature model (without an increase in temperature, Ew(R=)) and the simulated skin suture above the aluminium cuboid of the temperature model (with an increase in temperature, Ew(R↑)) and is calculated as follows:
Ew(R↑) = (1 − AF,↑) ∙ Ew(R=) + AF,↑ ∙ Ew(R↑)
where:
AF,↑ the fraction of the area of the dressing sensor array above the aluminium cuboid of the temperature model
1 – AF,↑ the fraction of the sensor area of the dressing sample above the POM surface (without an increase in temperature)
Ew(R=) the calculated ohmic resistance of the sensor wire at 33.0 °C
Ew(R↑) the calculated ohmic resistance of the sensor wire at 34.26 °C (33.0 °C + 1.26 °C)
5. Expected relative differences in ohmic resistance Ew(ΔrelR)
The expected value of the relative differences of wound dressing samples due to a localized increase in temperature Ew(ΔrelR) is calculated as follows:
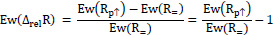 |
With a proportion of the area of the dressing sensor array above the aluminium cuboid of the temperature model (AF,↑) of 1 (i.e. 100%), the expected relative (and maximum achievable) difference in ohmic resistance Ew(ΔrelR) is:
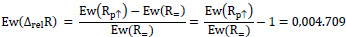 |
Apart from relevant characteristics of the geometry of the dressing samples, Table 2 contains the expected values of the ohmic resistances Ew(R20) and Ew(R=) determined as described, as well as the expected relative differences in ohmic resistance Ew(ΔrelR) assuming the presence of a warmer aluminium cuboid in the POM surface of the temperature model.
2.6. Presentation of Results
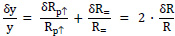
All calculated expected quantities Ew(x) are considered to be error-free. Error limits (maximum errors) of quantities calculated from several measured electric resistances are obtained by the rules for error propagation. Especially, for y = (Rp↑ – R=) / R= = (Rp↑ / R=) – 1 relative error limits are calculated as the sum of the relative error limits of individual measurements:
 |
3. RESULTS
3.1. Comparison of Measurements with Expected Values
Table 2 shows the calculated expected and measured values (mean values of (two or) three samples) of ohmic resistance at 33 °C (R=) of several dressing samples, and Fig. (2) - A a plot of the measurements of ohmic resistance against the calculated expected values. All deviations are positive (i.e., the measurements all exceed the expected values).
| WD-sample | Ew(R=) | R=,min ... R=,max | <R=> | Abs. dev. | Rel. dev. | |
| Serial | Type | / Ω | / Ω | / Ω | / Ω | / % |
| D | ‘d - b’ | |||||
| 0,07 - 1 | 8.83 | 15.7 ... 16.1 | 15.9 | 7.07 | 80.0 | |
| 0,14 - 1 | 2.27 | 2.52 ... 2.54 | 2.53 | 0.26 | 11.5 | |
| 0,21 - 1 | 1.01 | 1.16 ... 1.22 | 1.19 | 0.18 | 17.9 | |
| 0,07 - 3 | 8.83 | 11.8 ... 12.1 | 11.95 | 3.12 | 35.3 | |
| 0,14 - 3 | 2.27 | 2.49 … 2.53 | 2.51 | 0.24 | 10.6 | |
| 0,21 - 3 | 1.01 | 1.17 ... 1.19 | 1.19 | 0.18 | 17.9 | |
| WD-sample | Ew(R=) | R=,min ... R=,max | <R=> | Abs. dev. | Rel. dev. | |
| Serial | Type | / Ω | / Ω | / Ω | / Ω | / % |
| S | ‘a - b’ | |||||
| 0,5 - 1 | 17.5 | 18.4 ... 19.0 | 18.7 | 1.16 | 6.60 | |
| 1 - 1 | 8.83 | 10.7 ... 12.1 | 11.4 | 2.57 | 29.1 | |
| 1,5 - 1 | 5.93 | 7.70 ... 7.87 | 7.79 | 1.86 | 31.2 | |
| 0,5 - 3 | 17.5 | 18.5 ... 18.7 | 18.6 | 1.06 | 6,00 | |
| 1 - 3 | 8.83 | 10.9 ... 11.6 | 11.25 | 2.42 | 27.4 | |
| 1,5 - 3 | 5.93 | 7.74 ... 7.93 | 7.84 | 1.91 | 32.1 | |
| 2 - 3 | 4.48 | 5.85 ... 5.87 | 5.86 | 1.38 | 30.7 | |
| F | Q/Lx - 'b’ | |||||
| Q1 - 1 | 1.89 | 2.58 … 2.63 | 2.61 | 0.72 | 37.8 | |
| Q2/L2 - 1 | 7.35 | 8.15 ... 8.84 | 8.50 | 1.15 | 1.,6 | |
| Q1 - 3 | 1.89 | 2.58 ... 2.63 | 2.61 | 0.72 | 38.4 | |
| Q2/L2 - 3 | 7.35 | 8.53 ... 8.87 | 8.70 | 1.35 | 18.4 | |
| Q3 - 3 | 29.2 | 32.7 ... 32.8 | 32.8 | 3.60 | 12.2 | |
| L1 - 3 | 3.68 | 4.28 ... 4.36 | 4.32 | 0.64 | 17.4 | |
| L3 - 3 | 11.0 | 12.7 ... 12.8 | 12.8 | 1.80 | 15.9 | |
| Fx | F‘b - B’ | |||||
| F1 - 5 | 2.21 | 4.25 ... 4.30 | 4.28 | 2.07 | 93.7 | |
| F1 - 10 | 3.68 | 5.85 … 6.08 | 5.97 | 2.29 | 62.2 | |
| F1 - 15 | 5.89 | 7.59 … 7.86 | 7.73 | 1.84 | 31.3 | |
| F3 - 5 | 2.21 | 2.48 … 2.50 | 2.49 | 0.28 | 12.7 | |
| F3 - 10 | 3.68 | 3.44 ... 3.50 | 3.47 | - 0.21 | - 5.7 | |
| F3 - 15 | 5.89 | 4.39 ... 4.45 | 4.42 | - 1.47 | - 24.9 | |
Ew(R=) Calculated expected values of ohmic resistance at 33°C
R= (Generally) measured values of ohmic resistance at 33 °C of the two sensor wires (connected in series) of (2 or) 3 identical dressing samples, each measured once. The actual measurements include:
(1) The (transition) resistances of 9 soldering points each: 8 on the connection circuit board (for both ends of each sensor wire) – 4 sensor wires and 4 measuring terminal connecting wires – and 1 soldering of the two sensor wires to each other via 1 measuring terminal connecting wire each
(2) The ohmic resistances of the connection circuit board, the measuring terminal connecting wires, and the connections (sensor wire) of the sensor arrays with the connection circuit board
R=,min, R=,max Extreme values (lowest and highest) of the measurements of ohmic resistance of the sensor wires at 33 °C
<R=> Mean value (linear middle of the range) of measurements: <R=> = R=,min + (R=,max – R=,min) / 2
Abs. dev. Absolute deviation (the difference between mean measured and expected values): abs. dev. = <R=> – Ew(R=)
Rel. dev. Relative deviation (the ratio between absolute deviation and expected value): rel. dev. = [<R=> – Ew(R=)] / Ew(R=)
Fig. (2) - B shows the relative deviations (relative differences) of the measured ohmic resistances from the expected values plotted against the calculated expected values. Apart from one obvious outlier, the relative deviations are irregularly scattered. For lower expected values of 0 Ω to 10 Ω, scattering is up to about 40%, whereas for higher expected values of 15 Ω to 30 Ω, it is lower in relative terms at up to about 15%
Of particular interest are the relative differences in the measured ohmic resistances ΔrelR = (Rp↑ – R=) / R= of dressing samples, with both a homogeneous temperature (R=) and a locally increased temperature (Rp↑) on the temperature model. This provides an indication of the temperature increase to be detected in the area of a wound suture during the onset of inflammation. Fig. (3) - A shows the relative differences of the measured ohmic resistances ΔrelR of dressing samples plotted against the corresponding calculated expected values Ew(ΔrelR). The measurements are the arithmetic mean of (two or) three specimens of the dressing samples shown in Table 1, each specimen measured once.
With the given temperature difference ΔT of 1.26 °C and the given area of the surface of the temperature model affected by this temperature difference of 250 mm2 (5 mm ∙ 50 mm), the calculated expected values of the relative differences in the ohmic resistance of the copper wires ΔrelR are, as expected, small (only about 0.05 to 0.25%). The measured values show considerable scattering, especially with expected values up to about 0.1%. In fact, in this range (expected values < 0.1%), 57% (8 out of 14) of the measurements are negative.
Plotting the relative differences of the measured ohmic resistances ΔrelR between measurements with the aluminium cuboid in the slot (Rp↑) and measurements without a slot (R=) against the fraction of the dressing sensor array subject to additional warming by the aluminium cuboid AF,↑.(rather than against the expected values) proves interesting. This plot is shown in Fig. (3) - B. Here, too, clear scattering is revealed, especially against fractions of the surface area surface AF,↑ below about 20%. From about 25%, the deviations from a straight line are significantly smaller.
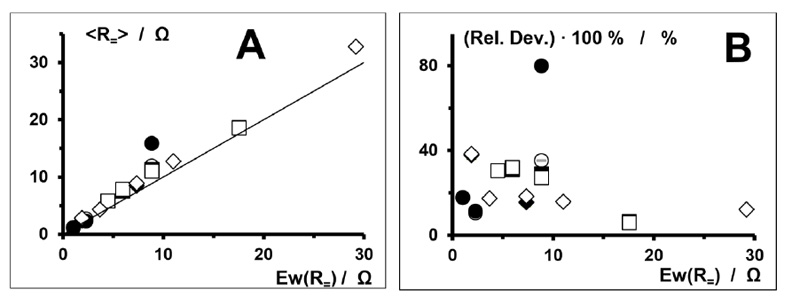
The figures contain values of dressing samples from series D, S, and F (subseries Q and L).
In A, the continuous straight line is the equality of ordinate and abscissa (y = x).
The indicators of relative measurement inaccuracy (δ(rel. dev.)/(rel. dev.) < 0.2%) are concealed by the data point symbols.
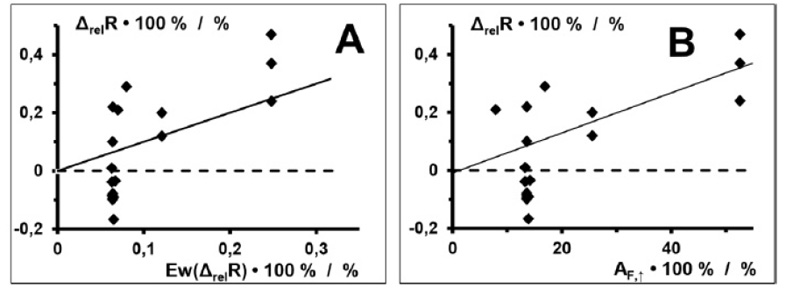
Values of dressing samples from series D, S, and F (Q and L) are shown.
In A, the continuous straight line is the equality of ordinate and abscissa (y = x).
The dashed straight line is the zero of the ordinate (ΔrelR).
In B, the continuous straight line is a linear least squares regression function.
Indicators of measurement uncertainty (δ(ΔrelR) / ΔrelR < 0.4%) have been left out for clarity.
3.2. Correlation with Sensor Wire Spacing
The following results are taken from measurements on dressing samples from the Fx series with fractions of the sensor area subject to additional warming AF,↑ of about 32%, 53% and 91% (Table 1). In order to rule out any (unexpected) direct influence by the sensor wire spacing a on the relative differences in ohmic resistance ΔrelR, wound dressing samples from the Fx series with two different sensor wire spacings a (0.5 mm and 1 mm) were measured. Figs. (4 and 5) show the measurements plotted against the width of the sensor array B and the sensor wire spacing a. There is no clear correlation.
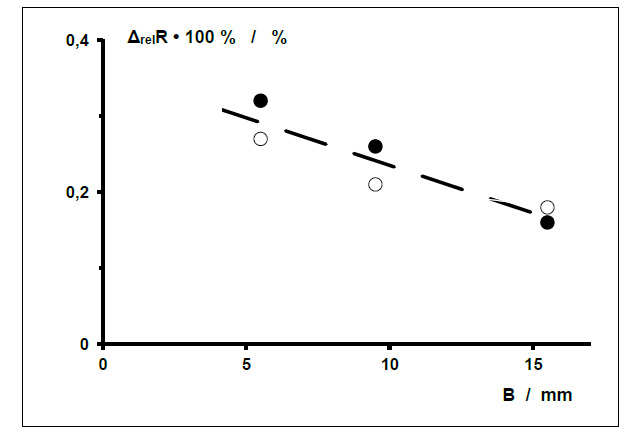
Widths B of 5.5 mm, 9.5 mm and 15.5 mm correspond to a fraction of the surface area of the dressing sample subject to additional warming (AF,↑) of about 32%, 53% and 91%.
Sensor wire spacing a = 0.5 mm - ●, a = 1 mm - ○
The relative measurement uncertainties (δ(ΔrelR)/ΔrelR) of all the relative differences in ohmic resistance ΔrelR are < 0.4%. They are left out here for clarity.
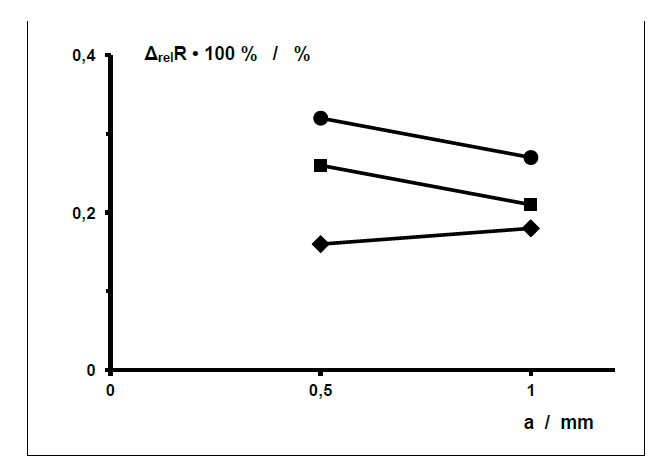
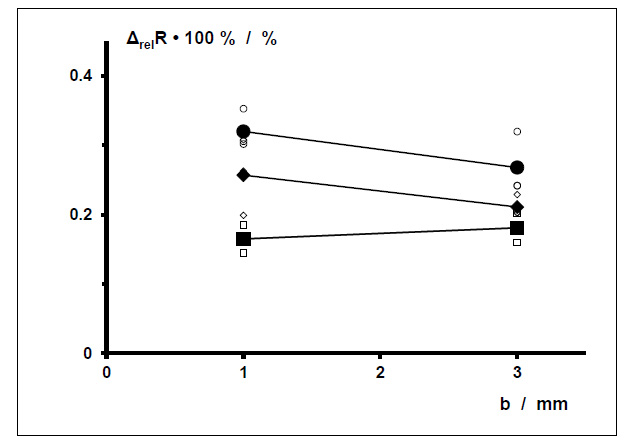
Sensor array width B = 5.5 mm - ●, 9.5 mm - ■, 15.5 mm - ♦. Area fraction subject to additional warming AF,↑ ≈ 91 % - ●, 53 % - ■, 32 % - ♦.
The relative measurement uncertainties (δ(ΔrelR)/ΔrelR) of all the relative differences in ohmic resistances ΔrelR are < 0.4%. They are left out here for better clarity.
○ ●. WD-samples F’b’-5 (L ∙ B = 40 mm ∙ 5.5 mm, AF,↑ ≈ 91%)
◊ ♦ WD-samples F‘b’-10 (L ∙ B = 40 mm ∙ 9.5 mm, AF,↑ ≈ 53%)
□ ■ WD-samples F‘b’-15 (L ∙ B = 40 mm ∙ 15.5 mm, AF,↑ ≈ 32%).
Small symbols: Values of 3 measured specimens of otherwise identical wound dressing samples with b = 1 mm (left) and b = 3 mm (right), partially concealed
Large symbols: Mean values (of individual values) for different b connected by line segments
The relative measurement uncertainties (δ(ΔrelR)/ΔrelR) of all the relative differences in ohmic resistance ΔrelR are < 0.4%. They are left out here for better clarity.
3.3. Correlation with Stitching Spacing b
The following results are also taken from measurements on dressing samples from the Fx series with fractions of the sensor area subject to additional warming AF,↑ of about 32%, 53% and 91% (Table 1). In order to rule out any (again unexpected) effect exerted by the stitching spacing b on the relative differences in ohmic resistance ΔrelR due to partial warming by the aluminium cuboid in the slot of the POM surface of the temperature model, measurements were taken by way of example on the dressing samples specified. Fig (6) shows the relative differences determined in ohmic resistance as a function of the stitching spacing b. No clear correlation can be seen.
4. DISCUSSION
4.1. Comparison of Measurements with Expected Values
When monitoring the healing of surgical wounds treated with purely textile wound dressings, being able to measure the temperature to detect the onset of wound infection is extremely important.
1. Ohmic resistance measurements always proved higher than the calculated expected values. In all the dressing samples, the measurements were found to be higher by an additional ohmic resistance of similar magnitude of between 0.18 and 3.60 ohms. These additional ohmic resistances have a bigger effect on lower calculated values of the ohmic resistance of copper wire than on higher values. There are two likely explanations for this:
- The biggest factor of influence is probably the conduction of heat in copper wire. Being a good electrical conductor, copper is also a good heat conductor (its thermal conductivity λ is 390 W / (K ∙ m)). A higher temperature in limited sections of the sensor wire (above the thermal bridge – the aluminium cuboid – of the temperature model) will therefore clearly spread to adjacent, slightly cooler areas. Sharp (steep) transitions of the temperature (reflecting the distribution of the surface temperature of the temperature model), which at least exist without the presence of a dressing on top, would then flatten out in the sensor wire array to produce an overall higher mean temperature with correspondingly higher mean ohmic resistance.
- The actual measurements also include the (transition) resistances of 9 soldering points each (8 on the connection circuit board (for both ends of each sensor wire) – 4 sensor wires and 4 measuring terminal connecting wires – and 1 soldering of the two sensor wires to each other via one measuring terminal connecting wire each) as well as the ohmic resistances of the additional enamelled sensor wires up to the connection circuit board, and also the connecting wires soldered there for the measuring terminals of the measuring instrument, which are not included in the calculations.
2. Comparing the actual measurements with the expected values of the relative differences in ohmic resistance as shown in Fig. (3) suggests that the measuring accuracy is poor, despite the use of a high-precision impedance meter. The results show that the readings aren’t exact enough to determine with adequate accuracy relative differences in the ohmic resistance of the sensor wires in the order of approximately 0.05 to 0.1% of the calculated expected values.
The relative inaccuracy (δx/x) of measurements taken using the high-precision meter is < 0.2%. For the relative differences in ohmic resistance ΔrelR (= (Rp↑ / R=) – 1) – the ratio of two measured ohmic resistances – the relative inaccuracies (δRp↑ / Rp↑ and δR= / R=) of both variables (Rp↑ and R=) [15] add up to a relative inaccuracy (δΔrelR/ΔrelR) of < 0.4%. True, the relative inaccuracy quoted by the manufacturer is a maximum error that is reluctantly used in practical science because it is very improbable, i.e., it occurs only very rarely. However, the determination of relative difference in ohmic resistance ΔrelR with a maximum expected value Ew(ΔrelR) of 0.428% (Table 1), especially in the range of expected values below 0.1%, perhaps up to 0.25% (Fig. 3), is evidently subject to unacceptably large error.
The outcome for the intended clinical dressings is that either (1) only temperature differences (significantly) higher than 1.26 °C can be measured reliably, or (2) the sensitivity of the sensors must be increased. Sensitivity could be raised as follows:
- Theoretically, the length of the sensor wires could be increased. However, reducing the spacing between sensor wires to below 5 mm in the manufacture of dressings isn’t feasible using ordinary stitching.
- Sensors could be used with a smaller surface area, in which a temperature increase of the skin limited to a certain area heats up a larger fraction of the sensor area. This appears to be the more hopeful approach for future investigations. However, all additional ohmic resistances (in this case circuit boards, solder joints and connecting wires) would then have to be minimized.
For this study, the necessary direct consequence was that for individual detailed investigations, only measurements with sensor arrays with a relatively small area were used, in which the partial temperature increase to be detected caused by the skin model (over an area measuring 5 mm ∙ 50 mm) additionally warmed a fraction of the sensor area that (Fig. 3) exceeded at least 30%.
4.2. Correlation with Sensor Wire Diameter
The determination of relative differences eliminates the absolute values of ohmic resistance and normalizes the results. This makes measurements with sensor wires with different ohmic resistances – for instance due to different diameters – directly comparable with each other.
As expected, although the wire thickness determines the respective absolute ohmic resistances (Table 2), it has no discernible influence on the relative differences in ohmic resistance with homogeneous temperature or with locally different temperatures of the sensor wires – presumably because these are ultimately relative differences in the properties of the same material, namely high-purity copper.
From a purely practical point of view, however, it should be borne in mind that large ohmic resistances are easier to measure with lower relative error because the measurement sensitivity ΔR/ΔT is proportional to the ohmic resistance to be measured (ΔR/ΔT ~ R0). Since the ohmic resistance of metal wire is inversely proportional to the square of its diameter (R = (4ρ20Λ / πd2), using the thinnest possible sensor wire with the highest possible ohmic resistance is expedient.
4.3. Correlation with Sensor Wire Spacing a
Taking into account the possible measuring inaccuracy (< 0.4%), there was – as expected – no evidence of the sensor wire spacing a affecting the relative difference in ohmic resistance. The sensor wire spacing a evidently only indirectly influences the measurement of the ohmic resistance of the dressing via changes in the length and density of the sensor wires.
4.4. Correlation with Stitching Spacing b
There is no theoretical justification for the stitching spacing to affect the ohmic resistance of an electrically insulated copper wire, which is an internal electrical property. Measurements of ohmic resistance and the resulting calculated values of the relative differences in ohmic resistance for three very similar wound dressing samples with a relatively small sensor wire area and hence a relatively large fraction of the area subject to additional warming (about 32%, 53% and 91%) did not reveal any (clear) correlation with the stitching space b.
CONCLUSION
Since the measuring effects are tiny, the measuring accuracy needs to be improved. Possible methods include:
- Using sensor wires with high ohmic resistance. As the ohmic resistance of metal wire is inversely proportional to the square of its diameter d, this can be achieved by using sensor wire which is as thin as possible.
- Using the smallest possible sensor arrays. This would increase this relative size of the fraction of the area subject to additional warming owing to a local increase in temperature upon the onset of inflammation.
LIST OF ABBREVIATION
| POM | = Polyoxy Methylene |
ETHICS APPROVAL AND CONSENT TO PARTICIPATE
Not applicable.
HUMAN AND ANIMAL RIGHTS
No animals/humans were used for studies that are the basis of this research.
CONSENT FOR PUBLICATION
Not applicable.
AVAILABILITY OF DATA AND MATERIALS
Not applicable.
FUNDING
The project “Full-textile sensor wound dressings” was kindly funded by the DFG German Research Foundation under project number ZI 1518/3-1. Publication fees were funded by the PHWT – Private University for Economics and Engineering, Vechta and Diepholz, Germany.
CONFLICT OF INTEREST
The authors declare no conflict of interest, financial or otherwise.
ACKNOWLEDGEMENTS
Declared none.

