All published articles of this journal are available on ScienceDirect.

Modelling Human Activity using Smartphone Data
Abstract
Background:
Over time, multichannel time series data were utilized for the purpose of modeling human activity. Instruments such as an accelerometer and gyroscope which had sensors embedded in them, recorded sensor data which were then utilized to record 6-axes, single dimensional convolution for the purpose of formulating a deep CNN. The resultant network achieved 94.79% activity recognition accuracy on raw sensor data, and 95.57% accuracy when Fast Fourier Transform (FFT) knowledge was added to the sensor data.
Objective:
This study helps to achieve an orderly report of daily Human activities for the overall balanced lifestyle of a healthy human being.
Methods:
Interfacing is done using Arduino Uno, Raspberry-Pi 3, heart rate sensor and accelerometer ADXL345 to generate real time values of day-to-day human activities such as walking, sleeping, climbing upstairs/downstairs and so on. Initially, the heart pulse of our four tested individuals is recorded and tabulated to depict and draw conclusions all the way from “Low BP” to “Heavy Exercise”. The convolution neural network is initially trained with an online human activity dataset and tested using our real time generated values which are sent to the MAC OS using a Bluetooth interface.
Results:
We obtain graphical representations of the amount of each activity performed by the test set of individuals, and in turn conclusions which suggest increase or decrease in the consistency of certain activities to the users, depicted through our developed iOS application, “Fitnesse”.
Conclusion:
The result of this works is used to improve the daily health routines and the overall lifestyle of distressed patients.
1. INTRODUCTION
After the use of hardware sensors, there evolved a popular method for recognizing human activity, through Google Activity Recognition API [1-3]. Google Activity API detects user’s activities such as walking, riding a bicycle, staying still, running, etc. by making use of the sensor data obtained from the user’s smart phone device.
Wearable sensors with embedded accelerometers then caused the issue of discomfort and appeared bulky because they are wired and battery operated, and also very expensive. To motion-track everyday tasks, multiple wearable sensors must be placed on different parts of a person’s body [4,5]. Another study depicted that Research Studies and Statistical Reports conducted by Ericson Consumer Lab in this regard reported increased percentage in the number of smart phones users from 36% in 2013 to70% by 2020 [6,7]. This led to the increase in demand for smart phone-based activity recognition systems and the overall study and research narrowed down the two most efficient categorization methods like Random Forest and One-Dimensional Convolution Neural Network. These two methods were then compared against each other using numeric comparison methods such as precision and recall, calculated from their respective confusion matrices and True/False Positive/Negative rates, as depicted in Table 1. In comparison, One-Dimensional Convolution Neural Network provided a higher accuracy and more concise results. The minimum, maximum and the threshold and data ranges and overall number of training and testing sets classified using this 1D-CNN are tabulated in Table 2 and Table 3. Previous studies to this, applied complicated pattern recognition strategies comprising of decision trees, decision tables, SVM, k-nearest neighbours, and naïve Bayes [8,9].
| Random Forest | Predicted Class | Recall | |||
|---|---|---|---|---|---|
| Actual Class |
Activity | Run | Walk | Still | |
| Run | 587 | 100 | 4 | 84.95% | |
| Walk | 65 | 561 | 65 | 81.19% | |
| Still | 0 | 62 | 629 | 91.03% | |
| Precision | 90.03% | 77.59% | 90.11% | 85.72% | |
| 1D CNN | Predicted Class | Recall | |||
| Actual Class |
Activity | Run | Walk | Still | |
| Run | 605 | 84 | 2 | 87.55% | |
| Walk | 68 | 597 | 26 | 86.40% | |
| Still | 0 | 0 | 691 | 100% | |
| Precision | 89.90% | 87.67% | 96.11% | 91.32% | |
| Train and Test Data | |||
|---|---|---|---|
| Data | Train | Test | Total |
| Feature 1 | 4953 | 2073 | 7026 |
| Feature 2 | 4923 | 1473 | 6666 |
| Activities | Minimum | Maximum | Data Ranges | Threshold Ranges |
|---|---|---|---|---|
| Standing | 0.03 ±0.01 | 0.10 ± 0.05 | 0.01 -0.16 | 0.00<Ysd ≤0.20 |
| Walking | 0.36±0.12 | 3.41± 0.51 | 0.24-3.92 | 0.20<Ysd≤4.00 |
| Running | 5.18± 1.02 | 9.03± 0.93 | 4.16-9.95 | 4.00<Ysd <10.00 |
The random forest method [10] was then discovered, and was found to be an ensemble learning methodology used in classification. It uses small sized data to manufacture multiple decision trees at training time. It improved the performance execution by developing these procedures. The confusion matrix shows that Random Forest has the highest accuracy rate. Filtering [11] was performed using Butterworth filter and Median filter. The Median filter is a computerized nonlinear sifting methodology, often used to expel noise. With a set end goal to quantitatively understand the acknowledgement performance, standard measurements such as kappa statistics, average accuracy rate, F-Score, sensitivity, specificity, positive/negative predictive value, negative detection prevalence and balanced accuracy are utilized using the confusion matrix depicted in Table 4.
Alternative to ambient wearable sensors, some work was done using smartphone sensors. Seven regular activities were classified by using the accelerometer sensor embedded inside Smartphones in several work areas [12,13]. Later, a system was formed [14] by combining 20 sensors to identify activities such as standing, lying, walking, etc. As K- Nearest Neighbour method is non-parametric, it describes a model structure, by not making any assumptions on the data distribution of given data [15].
| Overall Statistics | Decision Tree | KNN | Naïve Bayes | Random Forest | SVM |
|---|---|---|---|---|---|
| Sensitivity/Recall | 96.29% | 83.33% | 92.59% | 100% | 92.59% |
| Specificity | 99.26% | 96.67% | 98.52% | 100% | 98.51% |
| Positive PV/Precision | 96.67% | 87.12% | 93.63% | 100% | 93.07% |
| Negative PV | 99.28% | 97.50% | 98.58% | 100% | 98.54% |
| Prevalence | 16.67% | 16.67% | 16.67% | 16.67% | 16.67% |
| Detection Rate | 16.05% | 14.81% | 15.43% | 100% | 15.43% |
| Detection Prevalence | 16.35% | 16.67% | 16.67% | 100% | 16.67% |
| Balanced Accuracy | 97.77% | 89.99% | 95.55% | 100% | 95.55% |
On generation of Time Series data, Machine Learning methodologies [16,17] are used for generating an activity recognition training model from the dataset tagged with values for categorizing them into several classes. The percentage of composition of our 7 classes in our dataset is depicted in Table 5. Hence, it is observed that the performance of a human activity recognition system depends on various aspects such as (i) The learning algorithm, (ii) The feature extraction method, (iii) The quality of the training data, and (iv) The number of activity classes [16]. For Ensemble Classifier approaches, various implementations concerning deep learning architectures with multiple modalities have been made, including Restricted Boltzmann Machine (RBM), Convolution Neural Network and Deep Neural Network [18, 19].
| Classes | Imbalanced Data (Case #1) |
Balanced Data (Case #2) |
||
|---|---|---|---|---|
| Number of Samples | Percent of Dataset | Number of Samples | Percent of Dataset | |
| Downstairs | 14894 | 28% | 15000 | 14.2% |
| Fall | 15000 | 29% | 15000 | 14.2% |
| Jogging | 3054 | 6% | 15000 | 14.2% |
| Sitting | 14675 | 28% | 15000 | 14.2% |
| Standing | 3636 | 7% | 15000 | 14.2% |
| Upstairs | 345 | 0.6% | 15000 | 14.2% |
| Walking | 29 | 0.05% | 15000 | 14.2% |
In an alternative approach, data were collected from smartphone and smartwatch in three-axis signal of an accelerometer and gyroscope by RubénSan-Segundoa et al. Extracted features from the raw data were applied to two methods: CNN and HMM. There was a steep incline in accuracy from 78.6 to 88.1 for the accelerometer. And for the smartphone, accuracy improved from 96.4 to 98.1. This makes it evident that a feature normalization technique is fruitful for smartphone data more than smartwatch data [20-24].
Accelerometer-based activity recognition is not a new topic in the history of mankind. Bao & Intille [25] developed an activity recognition system to identify 20 activities using bi-axial accelerometers placed in five locations on the user’s body. Other studies have focused on how accelerometer based devices can be used to identify a range of user activities. Other work included building applications centered on accelerometer-based activity recognition. This includes monitoring user activity levels in order to promote health and fitness [26-28], calculating a user’s level of intensity in activity and predicting their energy consumption [26], and detecting a fall and the movements of user after the fall [27].
After the detailed study and analysis of the above mentioned methods, a combinatory approach, unlike undertaken by the previous researchers, was used in this research analysis. Taking note from the previous work studied about, methods such as K-Nearest Neighbour [15], Random Forest [10] and Deep Convolutional Neural Network [2], either one of these methods were the primary basis of the respective research works, whereas there was no comparison done on why the set method was chosen by the authors. In our novel approach, we have used multiple methods to test the accuracy of every method available to perform HAR before arriving at the method which was proven to give the highest accuracy. This enabled a longer, more intricate process of getting highly refined results than those in the literature review done above. Moreover, this project was made freely customisable to the need of the hour. On designing this HAR system, it was made to be flexible to accustom to various health requirements that it may be put to use. With respect to the current pandemic, this project can be used to monitor home-quarantined COVID positive patients, for doctors to keep track of their vitals.
2. MATERIALS AND METHODS
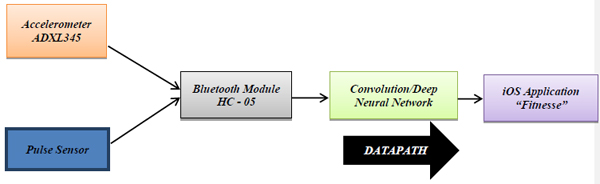
Human Activity Recognition (HAR) is a process, or algorithm which is used to detect basic and daily performed human activities. We collected data from various sensors, and record them in an organized manner, in order to perform further investigation and report results. In this project, the Arduino Uno (shown in Fig. 1) is made to use, by integrating it to the heart pulse sensor. With our finger on the sensor, Arduino takes in that analog input and converts it into our heart pulse in numeric digits (in bpm). The Raspberry pi 3 is then interfaced with the Accelerometer ADXL345 to take x, y, z axial readings of human movements, to draw conclusions as to which activity the person is performing and how much of each activity the person is performing. These two sensors/devices are the key elements of this design project’s hardware. The heart pulse sensor gives accurate pulse values in beats per minute (bpm), whereas, the accelerometer, detects axial x, y, z movement and predicts resultant human activity. These sensors are then interfaced with a Bluetooth Module to send these values via Bluetooth to the MAC OS where these data are served as a testing data for the Convolution Neural Network (Figs. 2 and 3).
Proposed convolutional neural network-based system works with taking in our sensor values through Bluetooth, to classify our human activities into various classes. The deep neural network calculates the mathematical manipulation to turn the input into the output, for both linear and non-linear relationships. Each mathematical manipulation is considered a layer, and complex DNN can have many layers. The network calculates the probability of each output at each layer. Later, the test set results are reviewed and the network should select which probabilities should be displayed and return the proposed label. The classified and predicted activity data are given as the input to the calculator scheme on an iOS application designed using XCode. In this project, a basic application “Fitnesse”, which predicts human activity based on Bluetooth received real time sensor data is developed. The convolutional neural network and multi-dimensional deep neural network are constructed, and it takes the input from accelerometer and performs many layers of training to build a regenerative and linear regressive model. The online dataset is used to train the inputs and build the model, and later proposed system generated real-time dataset is used to test the model to give an output. For the purpose of a study and visual analysis, an online dataset called wireless sensor data mining (WISDM) version 1.13 is used. The user ID’s are from 1 to 36. This is a pre-processed and initialized dataset. This dataset contains text as in Table 6.
| User ID | Activity | Time Stamp | X Axis | Y Axis | Z Axis |
|---|---|---|---|---|---|
| 33 | Jogging | 49105962326000 | -0.6946377 | 12.680544 | 0.5039528 |
This dataset is used for the classification of human activities. This dataset contains 1,098,207 examples encapsulating 6 attributes (Table 7). The dataset class distribution is:
| Attributes | No. of entries | % of entries |
|---|---|---|
| Walking | 424,400 | 38.6 |
| Jogging | 342,177 | 31.2 |
| Upstairs | 122,869 | 11.2 |
| Downstairs | 100,427 | 9.1 |
| Sitting | 59,939 | 5.5 |
| Standing | 48,395 | 4.4 |
The X, Y and Z axes are floating point values between -20 to 20 and are measured by the accelerometer as acceleration in the respective directions which includes gravitational acceleration toward the centre of the Earth, so that when the phone is at rest on a flat surface the vertical axis will register +-10. A value of 0 means no acceleration. The sampling rate of the Heart Pulse Sensor is 20Hz i.e. 100 samples/sec. The maximum sampling rate for the ADXL345 accelerometer is 3200 Hz. These challenges are overcome by using a method called photoplethysmography (PPG) [29] and was studied with the help of previous research work done by scholars [29]. PPG is usually used for heart pulse detection in wrist sensors. It can provide improved heart rate and human activity recognition (HAR) simultaneously at low sample rates, without an inertial measurement unit. This results in a simple hardware design and reduces power budgets.
2.1. Integration of Accelerometer and Heart Pulse Sensor
It is possible to measure heart rate at multiple sites on the body such as ankle, forehead, ear, etc. using PPG. The wrist is the most frequently used location for photoplethysmographic heart rate monitoring when it comes to personalised health and fitness monitoring using wearables. The accuracy of consumer-grade wearables is mostly acceptable but prone to errors during rigorous day-to-day activities [20]. The complications that accompany correctly estimating the heart rate are seen mostly while attempting to obtain a strong physiological reading from the sensors. Often, the signals read from the PPG modules tend to be largely corrupted with motion artefacts which is mainly caused by the movement of the limbs. A clean PPG signal can be retrieved even from a heavily corrupted signal by applying filtering techniques which include adaptive methods based on a measure of the artefact sourced from an accelerometer-based measurement.
2.1.1. Dataset
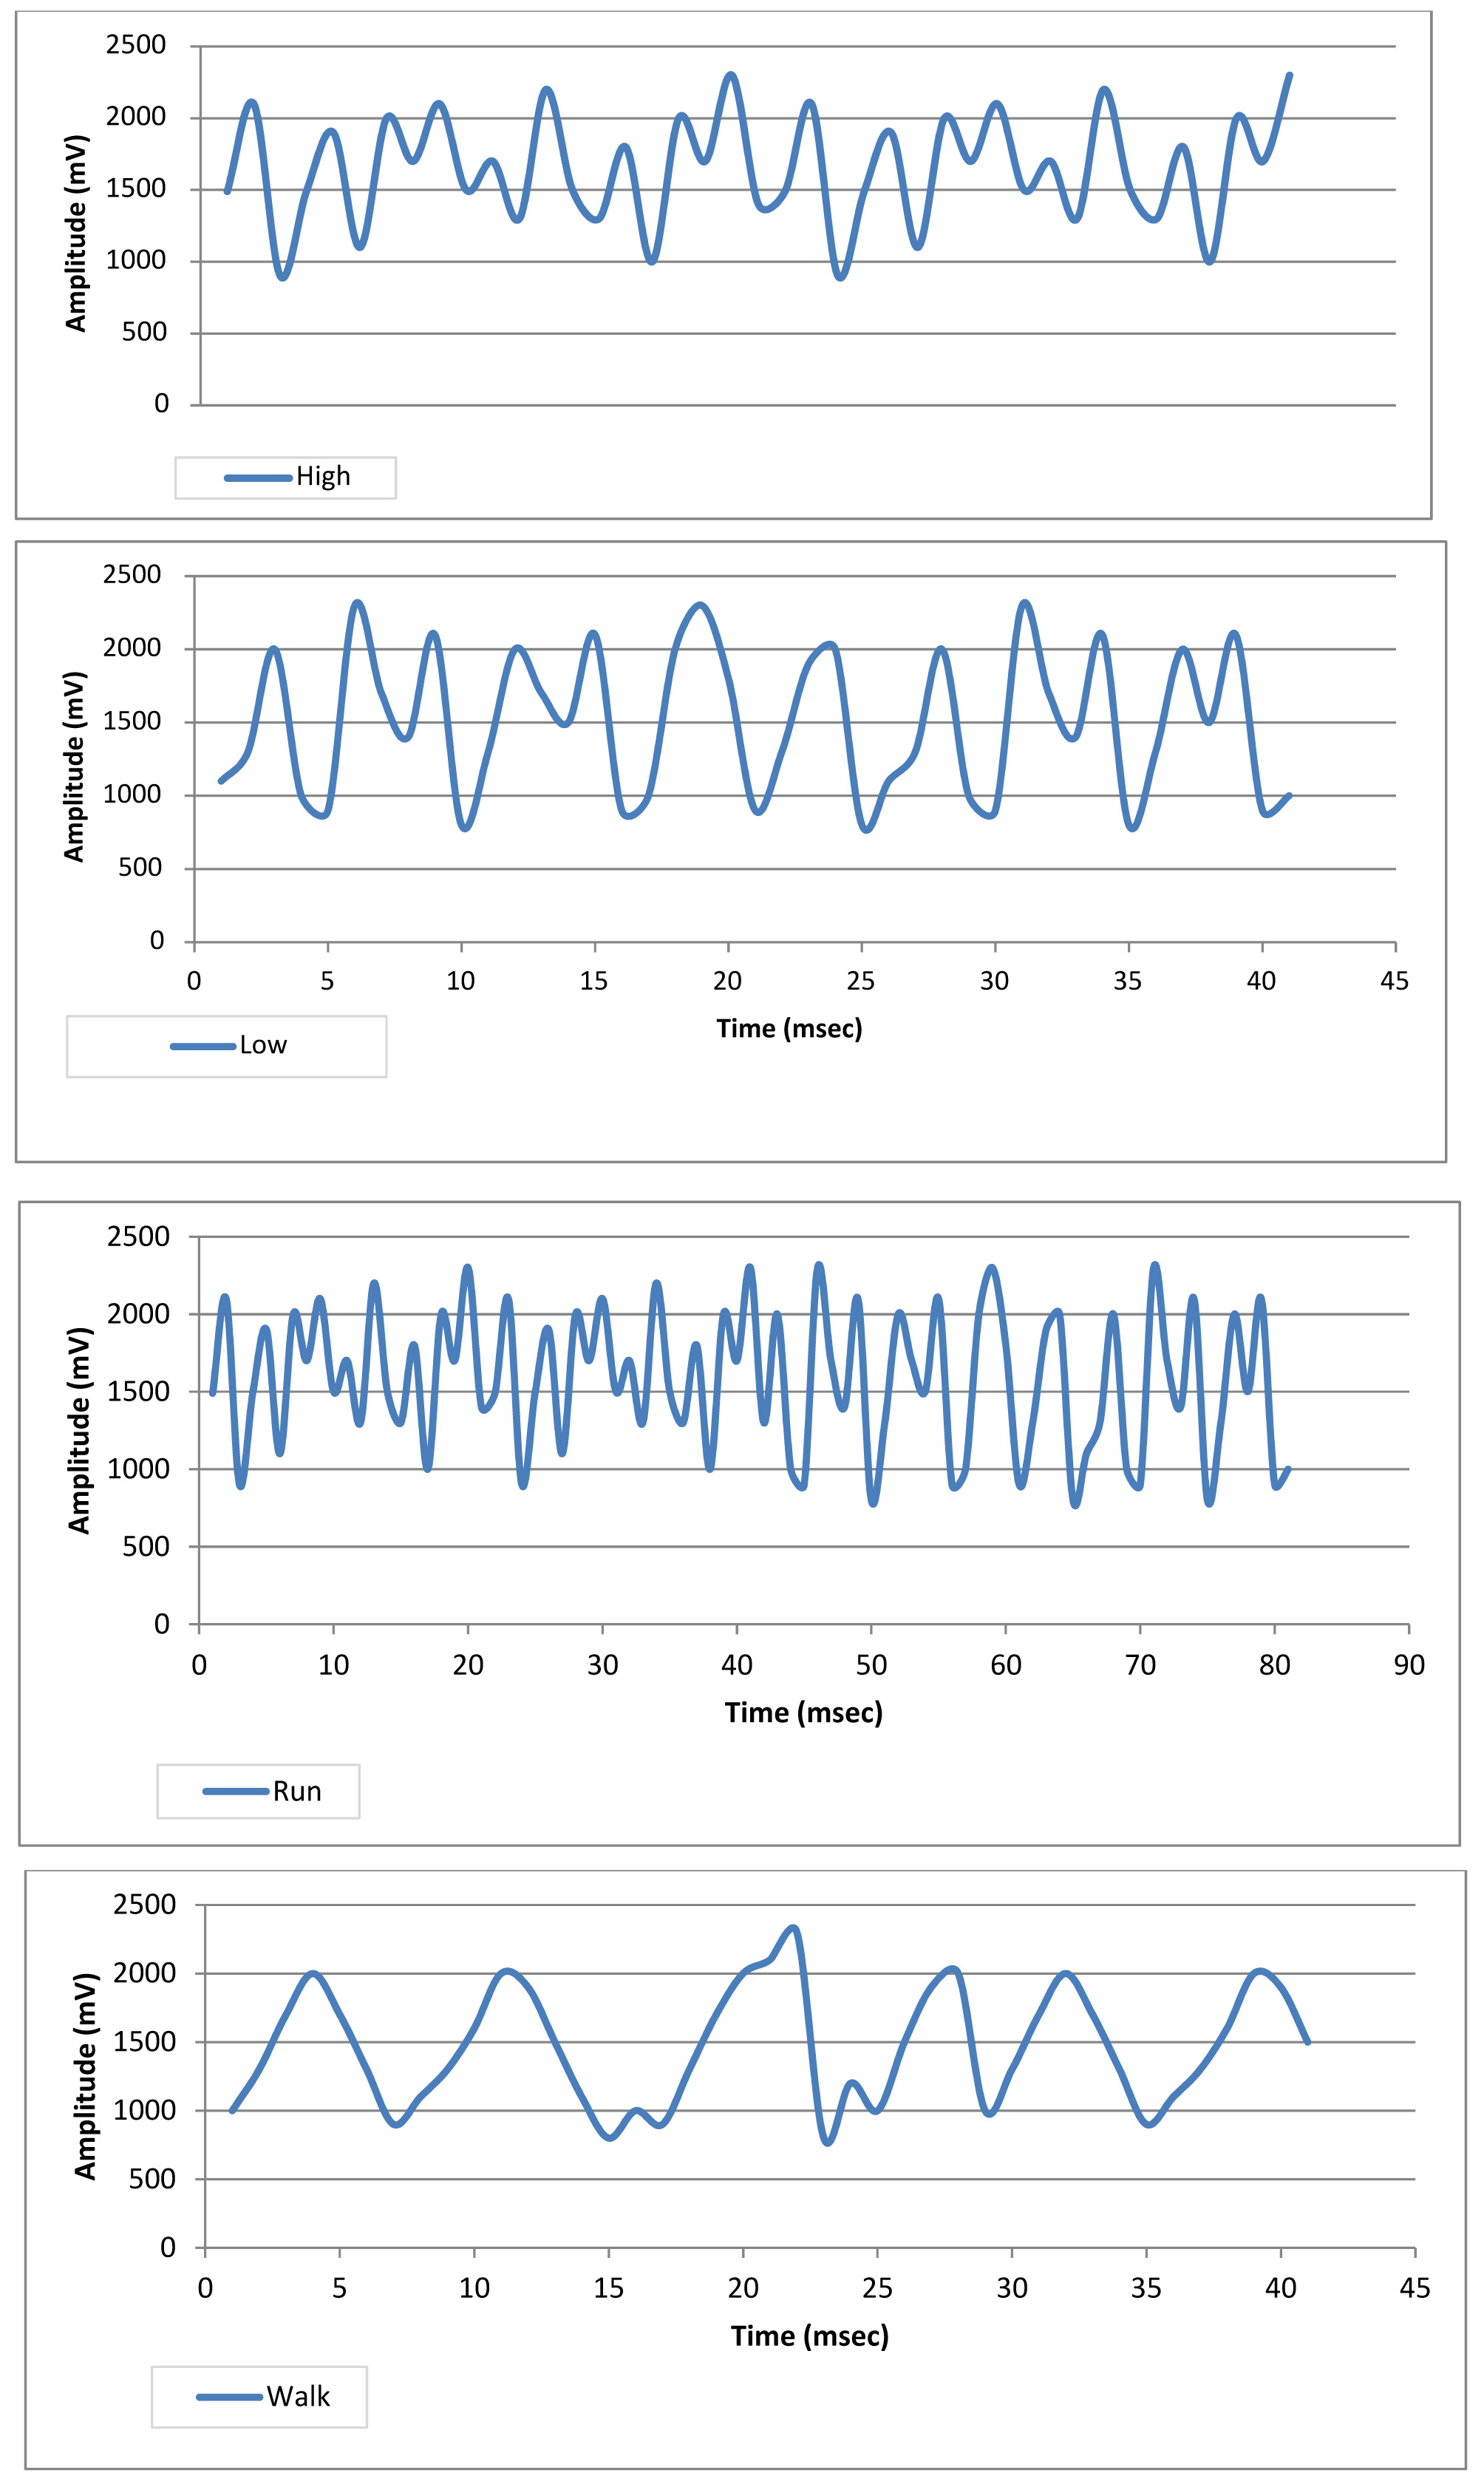
A wrist PPG exercise dataset collected by Jarchi and Casson [21] is readily and publicly available online on PhysioNet and was used for the experiments performed in this analysis [22]. Data from 8 healthy patients (5 male, 3 female) were collected, during exercise, with a sampling frequency of 256 Hz. A wrist-worn PPG sensor was used to collect the data, on board the Shimmer 3 GSR+ unit for an average recording time of 5 minutes and a maximum time of 10 minutes. Four exercises were chosen and carried out; two on a stationary exercise bike and two on a treadmill. The exercises were further categorized as; walk on a treadmill, run on a treadmill, high resistance exercise bike and low resistance exercise bike. There wasn’t any more filtering applied on the PPG data for the treadmill exercises other than what the Shimmer unit provided on board. High frequency noises were noted for the exercise bike recordings which was later filtered in MATLAB using a second order IIR Butterworth filter pertaining to a 15Hz cutoff frequency.
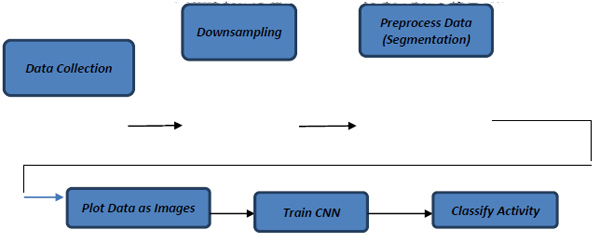
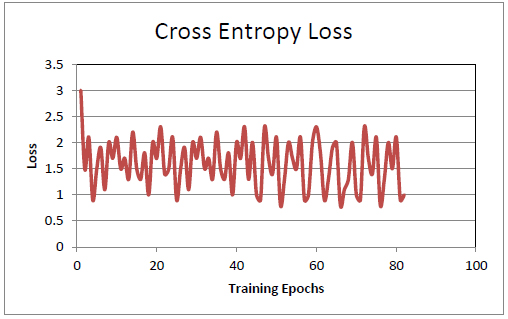
The HAR experiments were classified using the Inception-V3 architecture and was later pertained on ImageNet. The technique of Transfer Learning [23] was used to again train the deep model. The weights of the penultimate layer were changed whereas the other layers did not have any change. This enabled smaller amounts of data to be able to train models with large learning capacities which usually consume more time and data to train from scratch. It is possible to fine tune the retraining procedure by optimizing the hyperparamters. Default settings were enabled in this study but there was a change in the training steps from 10,000 to 4,000. This resulted in the convergence of cross entropy/loss function value, which in turn helped to minimise overfitting. Fig. (2) depicts the block diagram of the processing pipeline mentioned in this study. A python library named Matplotlib was used to plot the PPG signal as images, saved as 299x299 JPEGs. All axis labels, legends, titles and grid ticks were removed. The library“wfdb” in python, was made use to extract and load the data from PhysioNet. A total of 6,653 images were stored in four sub-directories of the possible predicted classes (High, Low, Run and Walk) to train the HAR classifier. The ratio of train:validation:test was 8:1:1.
2.1.2. Downsampling and Segmentation
Downsampling was performed on the PPG Signal before segmenting to different sampling frequencies. Initially, the classifier was trained in Python using the full 256Hz sampling frequency, and then retrained on downsampled frequencies of 30Hz, 15Hz, 10Hz, 5Hz and 1Hz respectively. After downsampling the signals, it was segmented into small chunks. Data were captured for 8 seconds (with increments every 1 second) using a windowing function.
On completion of 80 epochs, a cross entropy loss or log loss, which measures the performance of a classification model, is found to be an acceptable value of 0.09, as depicted in Fig. (4) and tabulated in Table 8.The train - test split ratio of the balanced dataset is 80/20. The following network after running 10 epochs gives us a model with training accuracy of 90% and validation accuracy of 89%. The results shown depict that train and validation both achieve near to 100% model accuracy and less than 20% loss. Later, the simulation has extended for the case of training set with50 epochs to see the comparison in the improvement of model accuracy and model loss.
| Epoch | Train Loss | Train Accuracy |
Validation Loss | Validation Accuracy |
|---|---|---|---|---|
| Epoch 1/10 | 1.6382 | 0.2965 | 1.2852 | 0.7290 |
| Epoch 2/10 | 1.1923 | 0.5953 | 0.8489 | 0.7103 |
| Epoch 3/10 | 0.9158 | 0.6565 | 0.5701 | 0.8318 |
| Epoch 4/10 | 0.6952 | 0.7059 | 0.4672 | 0.8224 |
| Epoch 5/10 | 0.5082 | 0.8259 | 0.3216 | 0.8972 |
| Epoch 6/10 | 0.4439 | 0.8353 | 0.3090 | 0.8879 |
| Epoch 7/10 | 0.3538 | 0.8659 | 0.2553 | 0.8972 |
| Epoch 8/10 | 0.2992 | 0.8847 | 0.2375 | 0.9865 |
| Epoch 9/10 | 0.2669 | 0.9129 | 0.2432 | 0.8879 |
| Epoch 10/10 | 0.2567 | 0.9082 | 0.2201 | 0.8972 |
The network after running 50 epochs (above shown sample in Fig. (5) is 10 epochs) raises a model with training accuracy of 84% and validation accuracy of 71%.The train – test data split as user ID’s from 1-28 were taken for training and 29-36 for testing to ensure training data would not bleed onto the testing data. As the table depiction of 50 rows of values is bulky and difficult to visualize, in order to depict these numeric values, a graph was plotted for Training/ Loss vs Epoch (1-50) with differentiated lines to show each of Loss, Accuracy, Validation loss and Validation Accuracy. Hence, it is observed that Train and Val attain above 80% accuracy and below 40%-60% loss.

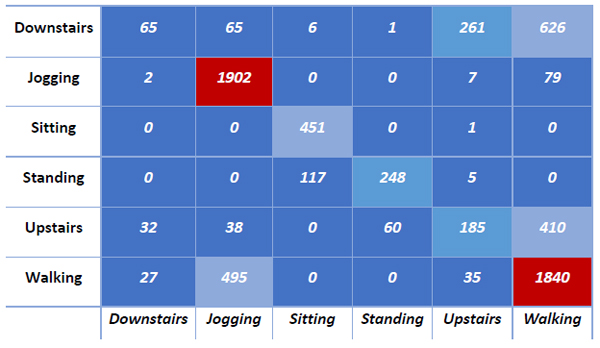
A clearer cut view of the Model Loss and Accuracy is depicted in Fig. (6), with the accuracy of training data touching exactly 80.001%. A confusion (error) matrix was also produced as shown in Fig. (7) which visualized the performance of the network after training. This matrix shows that the network faced difficulty while testing between walking downstairs and walking upstairs. The model was precise in predicting all the other activities particularly in order of jogging, sitting, standing followed by walking.

Later, the coreML and Keras toolsets were used to deploy the neural network alongside the XCode 11 model, which was then further projected onto the device (Table 9).
The exercise specific HRE is for the HeartPy method, and it is similar across all sampling rates except from the 10 Hz sampling frequency on the “walk” exercise. Heart Rate Error (HRE) is defined here as the absolute difference between the estimated heart rate for a given PPG sample and the heart rate ground truth calculated from the concurrent ECG sample. A 46% - 55% error was noted from other sampling frequencies except the 10 Hz one which was proven to achieve a reduced frequency of 39%. It can be clearly seen in Table 10 that the 10Hz sampling frequency has performed the best for estimating heart rate from the MA corrupted signal.
| Epoch | Loss | Accuracy | Val_loss | Val_accuracy |
|---|---|---|---|---|
| Epoch 1/50 | 1.0943 | 0.6401 | 0.7023 | 0.8146 |
| Epoch 2/50 | 0.5863 | 0.7902 | 0.6559 | 0.8055 |
| Epoch 3/50 | 0.5166 | 0.8096 | 0.6393 | 0.8251 |
| Epoch 4/50 | 0.4949 | 0.8183 | 0.6381 | 0.8218 |
| Epoch 5/50 | 0.4664 | 0.8296 | 0.6382 | 0.8184 |
| Epoch 6/50 | 0.4485 | 0.8366 | 0.6573 | 0.8268 |
| Epoch 7/50 | 0.4470 | 0.8346 | 0.6675 | 0.8220 |
| Sampling Frequency | Exercise | |||
|---|---|---|---|---|
| High | Low | Active | Rest | |
| 256 Hz | 11.78 | 8.14 | 19.44 | 54.94 |
| 30Hz | 11.80 | 10.61 | 20.71 | 53.69 |
| 15Hz | 12.10 | 11.15 | 19.94 | 46.83 |
| 10Hz | 10.46 | 14.05 | 17.82 | 39.28 |
| 5Hz | 10.94 | 10.05 | 19.27 | 48.85 |
3. BASIC EXECUTION: EXPERIMENTAL RESULTS
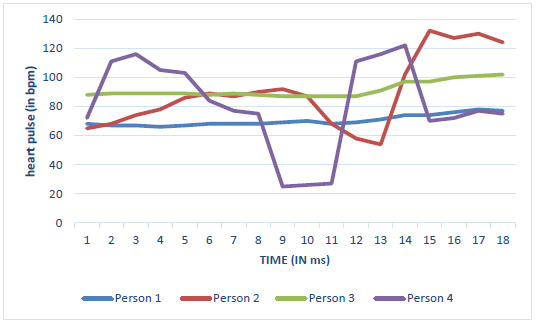
Various Experimental Results were obtained for the training and testing of our CNN and DNN, to classify our different classes of human daily activities. Values of the heartbeat of four person were recorded (in BPM) by our Pulse Sensor and tabulated as shown in Table 9. The categories are:
- Above 90 – Heavy Exercise
- Between 80 and 90 – Light Exercise
- Between 70 and 80 – Normal
- Below 70 – Low BP
The average overall heartbeat (in bpm) is written in the last column of Table 11, followed by the category that the last bpm falls into, as mentioned above. This helps to categorize the people into 4 different activity levels and hence allocate 4 different schemes of improvement/reduction of their daily activities.
3.1. Graphs
3.1.1. Pulse Sensor
The human heart pulse observed in Fig. (8) seems to be of a constant rate of heart beats ranging from 75 to 100 bpm (beats per minute) on an average, which is the normal range for an average human being.
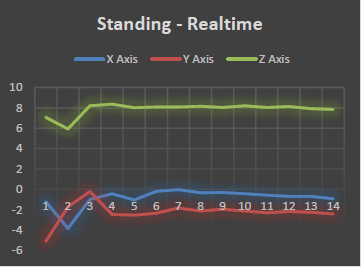
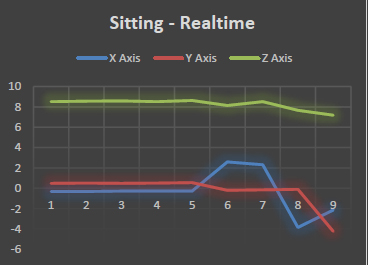
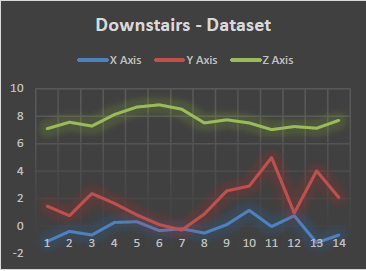
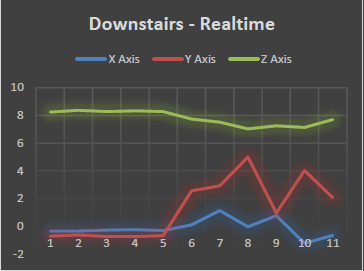
3.1.2. Mobile Activities
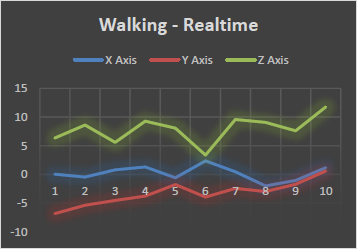
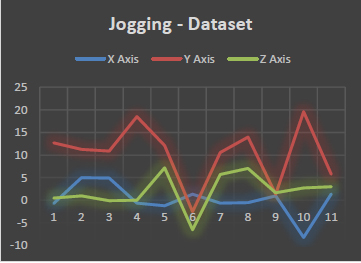
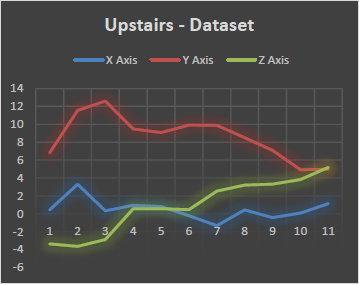
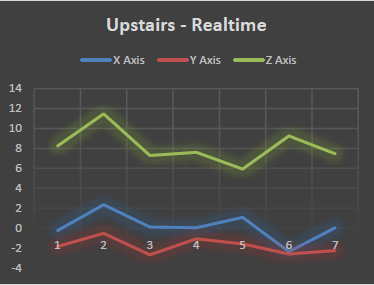
We observe that the Figures depicting strenuous or calorie-consuming activities such as Jogging, Walking and Climbing Upstairs show the most deflected movement of the body along X, Y and Z axes. We see a more straight-lined or smooth graph for casual activities such as walking downstairs, or standing still.
| Person 1 | Person 2 | Person 3 | Person 4 |
| 68 | 65 | 88 | 72 |
| 67 | 68 | 89 | 111 |
| 67 | 74 | 89 | 116 |
| 66 | 78 | 89 | 105 |
| 67 | 86 | 89 | 103 |
| 68 | 89 | 88 | 84 |
| 68 | 87 | 89 | 77 |
| 68 | 90 | 88 | 75 |
| 70 | 87 | 87 | 26 |
| 68 | 68 | 87 | 27 |
| 70.27 | 89.5 | 91.38 | 81.33 |
| Normal | Light Exercise | Heavy Exercise | Light Exercise |


4. DISCUSSION
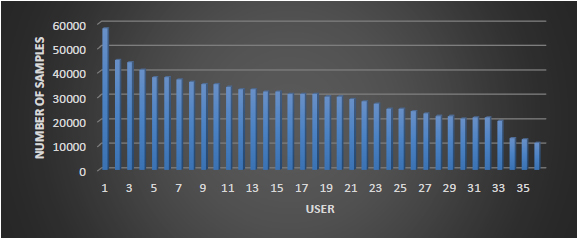
Figs. (9-18) depict the different activities recorded in real time from our Accelerometer and Heart Pulse sensor data values. On comparing the number of samples in our dataset per user, It is observed in Fig. (19) that User 1 has the most observed samples in his/her training set (The users are arranged in the decreasing order of number of recorded samples available). Fig. (20) depicts that most users seem to have provided the most number of samples or most frequently perform the activity of “Walking”, followed by “Jogging”, “Walking Upstairs”, “Downstairs” and so on.

CONCLUSION
This project developed a combination and blend of software and hardware devices, to give our various outputs of HAR classes, such as jogging, walking, sitting, standing, etc. We used Heart Pulse and Accelerometer sensors, to get and plot our real time values. These real time generated values were simultaneously sent to our MAC PC using a Bluetooth module interface.
The output of our Neural Network was sent to an iOS XCode created application, where the user could simultaneously interact and get the real time values corresponding to the activity that they were performing. Conclusions were drawn on Human Activity levels, based on the received classes of activity they performed, for how many time frames of a day. This project can be used in fields of medicine, day-care, surveillance, etc.
This project could be of use in multiple fields, as we have concluded above. One major application could be in the field of Mental Health. Our application could be slightly modified in order to give doctors the details of the activities performed by their respective patients undergoing mental illness treatments under their supervision. A doctor could either choose to sit in his cabin or his home office, and be able to monitor every activity the patient does, and he can generate his/her health report. Another recent scope of this project could be to monitor Home-stabilized Coronavirus positive patients, to monitor their daily activities and suggest deadlines of everyday minimum body activity limits, to improve immunity and metabolism rates, and keep them in good health to avoid worsening side effects associated with the virus and an overall quicker recovery.
ETHICS APPROVAL AND CONSENT TO PARTICIPATE
Not applicable.
HUMAN AND ANIMAL RIGHTS
Not applicable.
CONSENT FOR PUBLICATION
Not applicable.
AVAILABILITY OF DATA AND MATERIAL
Not applicable.
FUNDING
None.
CONFLICT OF INTEREST
The authors confirm that this article content has no conflicts of interest.
ACKNOWLEDGEMENTS
Declared none.

