All published articles of this journal are available on ScienceDirect.

Statistical Learning Models for Sleep Quality Prediction Using Electrocardiograms
Abstract
Background:
The sleep quality prediction has implications beyond trivial. It enables the holistic management of the clinical ramifications of treating sleep disorders, which include providing a foundational framework for mitigating sleep medication abuse and sleep medication dosage control due to the foreknowledge of the quality of a future sleep episode. Sleep Quality (SQ) is presented as a function of sleep stages and as such, predicting sleep quality will involve predicting the future realization of a sleep episode in terms of transition between different sleep stages. Electrocardiograms (ECG) provided by the National Sleep Research Resource (NSRR) are analyzed and a Sleep Quality (SQ) value is predicted on an interval (0,1).
Methods:
This research uses Support Vector Machines (SVM) and a polynomial regression model to forecast the Sleep Quality (SQ) of a future sleep episode. The statistical learning models are trained on the features extracted from the Electrocardiograms (ECG) signals in the training set. The datasets are composed of ECG signal from patients in the NSSR Sleep Health Heart Study (SHHS).
Results:
A confusion matrix comparing measured vs. predicted is presented as a measure of the performance of the SVM sleep stage as well as the comparison of the observed vs. predicted hypnogram in some cases. The Sleep Quality (SQ) values derived from classified forecasted PSD is compared with the measured Sleep Quality (SQ) values. Finally, a paired t-test is used to compare the predicted Sleep Quality (SQ) with the measured Sleep Quality (SQ) to determine if the difference between the two sets is significant.
Conclusion:
This research presents a simple method to forecast Sleep Quality (SQ) values. Consequently, it can be used to establish a personal Sleep Quality (SQ) history for clinical diagnosis and treatment.
1. INTRODUCTION
The definition of sleep quality that encompasses the ramifications of its implications is hard to achieve given its subjective nature. It is like describing “sweetness”; the description is based on a subjective personal history of exposure to “sweet” things. However, despite the variance of the actual manifestation, sleep quality can be generally regarded as the relative amount of satisfaction derived from a sleep episode.
In some research, sleep quality is defined in terms of the subjective Pittsburgh Sleep Quality Index (PSQI) as a statistical measure introduced by Buysse et al. in 1988 [1] and has now taken on a life of its own in the different localized varia tions such as the “Persian PSQI”, “Hungarian PSQI (PSQI-HUN)”, “Korean PSQI (PSQI-K)” and other non-distinct morphological variants [2, 3].
In introducing the Pittsburgh Sleep Quality Index (PSQI), Buysse et al., cited the difficulty of establishing a general definition of “sleep quality” which has qualitative aspects. This is because qualitative aspects of sleep are hard to quantify, for example, “restfulness”. In fact, one might argue that qualitative factors like “restfulness” are equally as important as quantitative factors like “sleep duration”, “number of interruptions” etc. in the perception of sleep quality.
The PSQI was also motivated by the need for a formal taxonomy in sleep quality research that captures both statistical and clinical factors. The PSQI is a score derived from the answers to 19-questions in a sleep questionnaire [4]. PSQI, however, has not been rigorously adopted as a standard by the mainstream even though it has been the subject of many research publications given the amount of citations. The reason is not far-fetched, while the PSQI is groundbreaking from an ontological viewpoint. It is not a significant improvement from what was already in use in mainstream sleep medicine, i.e. the use of questionnaires to establish sleep history. Although in scientific research, there has been reliance on questionnaires when studying phenomenon strongly correlated with behavioral or individual patterns, in many clinical applications, precision is a principal criterion. This criterion excludes data based solely on the ability of the subject to remember accurately and understand questions correctly. The exclusion of data gathered in this manner is due to its highly subjective nature which makes generalization difficult. Furthermore, varying subjectivity does not foster further development in the ontology of sleep research and consequently limits its usefulness in enabling emerging technologies in the 21st century.
For considerable progress to be made in sleep research, there is a need for more reliable and externally valid data sources which can be used to develop various statistical models in cadence with technology trends. This research will lean towards a rather vague but more clinically acceptable definition of sleep quality given by the Encyclopedia of Pharmacology which views Sleep Quality (SQ) as the outcome of polysomnography [5]. Subsequently, an ensemble of statistical learning models that collaborate to predict Sleep Quality (SQ) from polysomnography is presented.
2. MATERIALS AND METHODS
2.1. Sleep Episode Identification
Heart Rate Variability (HRV) will be used to differentiate between the parasympathetic and sympathetic nervous system within the Autonomous Nervous System (ANS). The adopted method relies on the research by Hon et al. (1963) [6] that revealed that Heart Rate Variability (HRV) delineates specific ANS activity.
A frequency domain analysis of the RR time series using Fourier transforms for the power spectral analysis identifies a period of decreased heart rate as the range of epochs with LF /HF < 1 are also selected as the epochs within a sleep episode. A Support Vector Machine (SVM) model is developed to identify different sleep stages based on the information from the Fast Fourier Transform (FFT) of the RR series.
As mentioned, the RR interval series is transformed using Fourier Transform (FFT)
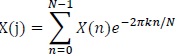 |
(1) |
Where:
N = Number of samples in the time domain
n = Current number of samples considered
X(n) = Value of the signal when t = n
The magnitude of the signal is then calculated as follows
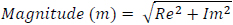 |
(2) |
The power P(k) at X(k) is taken as the square of the magnitude
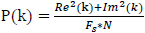 |
(3) |
The frequency at X(k) is taken as
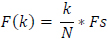 |
(4) |
Fs is the sampling frequency.
k is the current frequency bin.
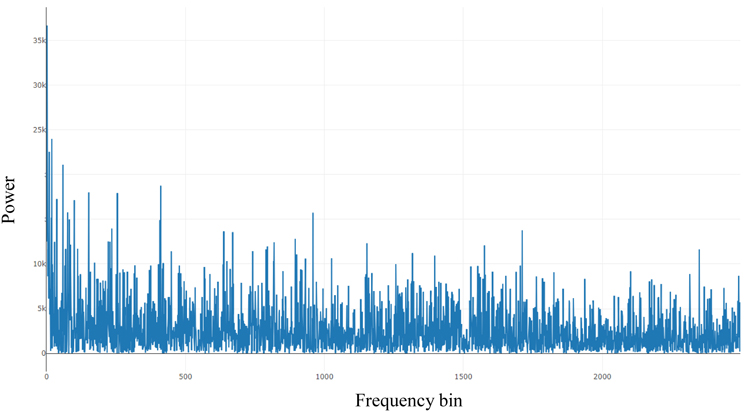
Fig. (1) shows the power spectral from the Fast Fourier Transform (FFT) of 10000 seconds of an ECG signal derived from Polysomnography records from the National Sleep Research Resource (NSSR), Dean et al., (2016) below:
2.2. The Support Vector Machine (SVM) Sleep Stage Classifier
As mentioned earlier, the RR sequence or the beat to beat interval data goes through a classification stage. A support vector machine is used to classify the RR interval data into 6 possible stages.
0 – wake
1 – Stage 1 Sleep
2 – Stage 2 Sleep
3 – Stage 3 Sleep
4 – Stage 4 Seep
5 – REM Sleep (The dataset used in the training set assigns 5 to REM sleep)
After the Fast Fourier Transform (FFT) of the RR series, the original time domain signal is transformed into the frequency domain and every element or point in the RR sequence now has two attributes viz. “power” and “frequency”.
P is a 2 X 1 vector of the mean power and mean frequency in an epoch. Simply put,
P1 = power
P2 = frequency
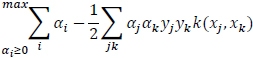
The general multi-class support vector machine as described by Weston et al., (1998) has formed dual formulation.
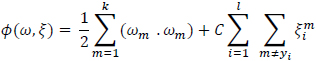 |
(5) |
with constraints
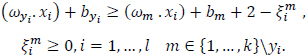 |
(6) |
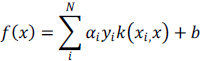
This gives the decision function:
 |
(7) |
In practice, when working with Support Vector Machines (SVM) on problems with non-linear decision boundaries, the dual problem is preferred over the primal problem because the dual problem uses the dot product of the support vector and the actual input vector which is very valuable when using a kernel for finding support vectors on the separating hyperplane in higher dimensions especially for non-linear decision boundaries as is the case of the dataset used in this research. The kernel method is used which maps the dataset into higher dimensional feature space where the data becomes linearly separable and a linear classifier can be learned and applied.
Scholkopf et al., (1997) suggested that the SVM with Gaussian kernels were as good or better than the traditional Radial Basis Function (RBF) classifiers.
An SVM model has a simplified form given below:
 |
(8) |
 |
(9) |
Gaussian Function SVM is given below:
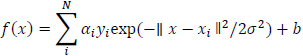 |
(10) |
The learning algorithm is given as:
 |
(11) |
Table 1 below shows the out-of-sample performance for a test sample drawn from the test set to illustrate the use of a confusion matrix in the overall results section. The confusion matrix summarizes the performance of the classifier for every sleep stage. In the results section, a general accuracy percentage is presented, which is a measure of the misclassified model output to the total model output.
2.2.1. Sleep Stage Identification
The succeeding step to sleep episode identification is to decompose a sleep sequence into the prevailing sleep stage classification. Every epoch will inherit a “sleep label” annotation which will vary from 1 through 5. According to Busek et al., (2005) [7], the minimum values for LF/HF ratio are recorded at stage 1 and the maximum values at Slow Wave Sleep (SWS) are recorded at stage 5. In practice, the values observed in later stages are closer to 1 which is a result of the vagal parasympathetic activity. In a more general sense, sleep stages are identified by the consistent decrease or increase in LF/HF ratio progressively through the sleep stages [8].
In this research, this relationship is learned by feeding classified data to a multi-class Support Vector Machine described prior and used repeatedly to classify “sleep” data into various stages as well as the trivial separation of “sleep” data from “wake” data.
| Predicted|Actual | 0 | 1 | 2 | 3 | 4 | 5 |
| 0 | 938 | 0 | 164 | 0 | 0 | 36 |
| 1 | 67 | 0 | 8 | 0 | 0 | 0 |
| 2 | 112 | 0 | 1973 | 82 | 0 | 13 |
| 3 | 6 | 0 | 77 | 1219 | 0 | 3 |
| 4 | 0 | 0 | 0 | 0 | 0 | 0 |
| 5 | 0 | 0 | 3 | 2 | 0 | 295 |
| - | Sleep Stage | Time Elapsed in Seconds |
|---|---|---|
| 1 | 0 | 0 |
| 2 | 1 | 840 |
| 3 | 2 | 870 |
| 4 | 0 | 960 |
| 5 | 1 | 990 |
| 6 | 2 | 1,020 |
| 7 | 3 | 1,290 |
| 8 | 2 | 1,410 |
| 9 | 3 | 1,440 |
| 10 | 0 | 1,560 |
| 11 | 2 | 1,590 |
| 12 | 3 | 1,710 |
| 13 | 2 | 1,740 |
| 14 | 3 | 2,010 |
| 15 | 2 | 2,070 |
| 16 | 3 | 2,250 |
| 17 | 2 | 2,640 |
2.3. SLEEP QUALITY ANALYSIS
The initial sleep quality analysis will assume two basic classes:
- Sufficient
- Poor
The determination of the categories derives from the baseline by William et al., (1964) which shows a percentage of time spent in the 4 sleep stages by normal subjects.
Stage 1: 0.36% - 16.7%
Stage 2: 34.6% - 60.2%
Stage 3(3a): 2.5% - 15.3%
Stage 4 (3b): 4.5% - 23.5%
Stage 5 (REM): 14.4% - 29.9%
3a originally refers to 3 and 3b refers to 4, since the amalgtween the sleep stages and the overall elapsed time foramation of these stages by the American Academy of Sleep Medicine [9].
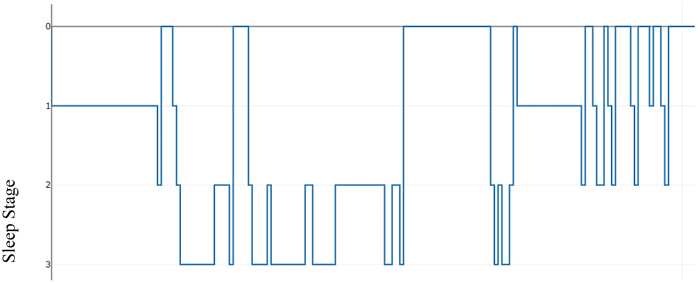
As an illustration, Table 2 below presents a hypnogram data extracted from a sleep annotations file from the Sleep Heart Health Study (SHHS) dataset provided by the National Sleep Research Resource (NSSR). Table 2 shows a transition between the sleep stages and the overall elapsed time for approximately the first 2,640 seconds.
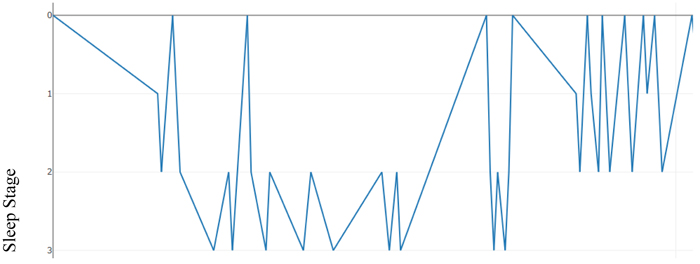
Figs. (2) & (3) show the sleep hypnogram associated with Table 2, with the latter emphasizing sleep stage transitions.
Generally, Stage 3, 4 and Rapid Eye Movement (REM) sleep stages are clinically regarded as the most restful and most restorative period of a sleep episode. The sleep quality expressed in this study is an expanded form of DSEI (Delta Sleep-wave Efficiency Index) introduced by Bsoul et al., (2010) [10].
Rapid Eye Movement (REM) sleep is especially important for committing emotional information to long term memory and maintain core body temperature according to Wagner et al., (2001) [11] and Charles et al., (1980) [12]. Therefore, the ensuing formulae account for REM sleep as an important factor in assessing Sleep Quality (SQ).
Therefore,
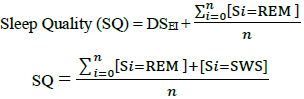 |
(12) |
2.4. Experiment Design
Fig. (4) captures the overall methodology. An informal mathematical notion of sleep quality (SQ) prediction is presented subsequently.
2.4.1. Sleep Quality Prediction from extrapolated (Power, Frequency) pairs
Let S, be a random variable that encapsulates the sleep stages {3, 4, REM (5)}
Therefore, Sleep Quality (SQ) can be succinctly described as follows,
 |
Suppose a random variable S encapsulates the sleep stages {3, 4, REM (5)} and a function H, such that
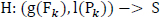 |
Where g, l are the extrapolating functions given as follows:
 |
The function H is a regression function that relates a Sleep Stage ‘S’ to a (power, frequency) pair.
This regression function can be used iteratively to classify a sequence of extrapolated (predicted) (power, frequency) pairs into their corresponding sleep stages.
The regression function H is learned by a support vector machine.
2.4.2. Forecasting/Extrapolating (Power, Frequency) pairs
2.4.2.1. Frequency
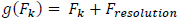
The frequency contained in every bin after Fourier transform is a multiple of the frequency resolution and is given by
 |
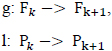
In the ideal case, this is a function of the characteristics of the input signal. However, suppose that Fk is a finite random variable over a set of real numbers and that Fk+1 is related to Fk by a linear function g(Fk).
Such that,
 |
and
 |
Generally, the frequency at successive frequency bin is given as follows:
 |

2.4.2.2. Power
Suppose Po and Ps are shifted versions of the power sequence P, such that;
 |
then,
 |
The predicted power spectrum  is modeled as by cubic polynomial of Ps such that, for a point Pk in Po, there is a point Pk-1 in Ps where,
|
The regression coefficients are estimated using polynomial least squares.
3. RESULTS
Predicting Sleep Quality (SQ) requires the ability to forecast future inputs for the “sleep stage” classification model since Sleep Quality (SQ) is a function of the time spent in the sleep stages. The higher the amount of time spent in stage 3-5, the higher the SQ value. The goal is to demonstrate that the power spectrum derived from the ECG signal of an individual can be learned by a regression model and used to forecast future trends which are then classified by a Support Vector Machine (SVM) model and evaluated as a Sleep Quality (SQ) value using the equation below:
 |
An intuitive way of conceptualizing the SQ formulae is that it is a function from the predicted sleep hypnogram (or the corresponding confusion matrix) to the real numbers. A summary of the performance of the SVM model for all data in the test set is presented in the confusion matrix in Table 3.
| Predicted|Actual | 0 | 1 | 2 | 3 | 4 | 5 |
|---|---|---|---|---|---|---|
| 0 | 192844 | 512 | 13675 | 2026 | 56 | 861 |
| 1 | 4044 | 2096 | 5738 | 823 | 17 | 713 |
| 2 | 8069 | 336 | 135360 | 10279 | 241 | 994 |
| 3 | 1027 | 19 | 13206 | 73344 | 635 | 69 |
| 4 | 129 | 0 | 304 | 3723 | 4505 | 30 |
| 5 | 415 | 37 | 4469 | 245 | 6 | 21690 |
The confusion matrix in Table 3 represents the overall result of the classification performed for all 100 patients in the test set. The rows represent the distribution of the predictions in the different sleep stages in cadence with the actual observations which are in the columns. For examples, row 0, column 0 translates to the total amount of points predicted or classified to be stage 0 “Awake” that is actually stage 0. Similarly, row 0, column 1 translates to the total amount of points classified to be stage 0 that is actually stage 1. The number in each cell represents the total for the entire test set. Mathematically, each cell is calculated as follows:
 |
Where 0 ≤ i ≤ 5
0 ≤ j ≤ 5, N = cardinality of test set
The average performance characteristics are reported as follows:
Average SVM Accuracy in the test set  85%
85%
To determine the accuracy, the number of correctly classified points are determined by checking the predicted sleep stages and wake stage against the actual stages in the clinical annotations. As such, for every sample patient, the accuracy of the classified wake stage and sleep stages is evaluated as follows:
For all in a set of predictions, and in a set of actual measured observation,
 |
where:
N = cardinality of test set.
Similarly, a statistic for the overall performance of the polynomial regression model is presented as follows:
Average adjusted R2 for polynomial regression = 0.61
For every sample patient in the test set, a reference point in the wake cycle is selected, the sleep onset latency is determined by predicting Time to Sleep (TTS) and it is added to a target length of sleep episode (sleep time) which is extracted from the clinical annotations, which varies for each patient. The polynomial regression model is then used to model the ideal progression of the power spectrum. The R2 is computed to determine the fit of the prediction to the actual model and then adjusted for the number of estimators or predictors, which in this case is 3. The average value of the adjusted R2 is calculated as follows for all patients:
 |
where: N = cardinality of test set
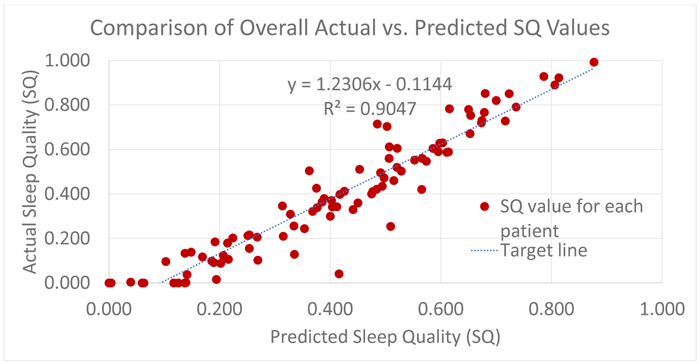
After the forecasted power spectrum is classified by the SVM model, the Sleep Quality (SQ) formula which can be conceived as a function from the predicted sleep hypnogram to the set of real numbers, is used to determine a score on the interval (0,1), with 0 meaning poor sleep quality and 1 meaning best sleep quality. The overall R2 for Sleep Quality (SQ) for all the patients in the test set is approximately 0.9. This is largely in part to the symmetry of misclassification and the evaluation of Sleep Quality (SQ) focuses on the transitions in the sleep hypnogram that involves only stage 3, 4 and 5.
Furthermore, in Table 3 which summarizes the SVM performance for the whole experiment, the misclassifications distributed within stage 0, 1, 2 for both predicted and actual values will have no impact of the final computation of the Sleep Quality (SQ) values because stages 0, 1, 2 are unused in the Sleep Quality (SQ) equation. Also, the symmetry of the mistake in classifying Stage 2 and 3 improves the outcome, i.e. 10279 actual stage 3 points were misclassified as stage 2 but 13206 actual stage 2 points were also misclassified as stage 3. This results in an offsetting behavior in the Sleep Quality (SQ) equation that focuses on the total time spent in stages 3, 4, 5 and not their exact distribution. It is worthy of mentioning that the 85% test set accuracy for the SVM model is directly influenced by the quality of the forecasted power spectrum by polynomial regression. Considering the average R2 is 0.61, meaning only 61% of the variation in the true model is explained, SVM intrinsic behavior of finding a separating hyperplane that maximizes the margin between classes was invaluable in achieving the reported accuracy and also responsible for the near-symmetric misclassification on the border classes of stage 2 and 3. Intuitively, this makes sense, since stage 3 and above is considered, then there is an implicit boundary line between stage 2 and 3. In a typical modal, we expect that the probability of predicting stage 3 when is 2 is the same as the probability of predicting stage 2 when it is 3. Informally, we conceive the error as being normally distributed. In this case, however, there is a slight bias towards stage 3 at the boundary.
Fig. (5) represents a plot of the overall Sleep Quality (SQ) model for all patients in the test set. It is obtained by plotting actual Sleep Quality (SQ) values computed from clinical annotations against the Sleep Quality (SQ) values from the predicted hypnogram. Recall, that the Sleep Quality formula, is a function from the predicted sleep hypnogram to the interval (0, 1) and as a result, the values computed from clinical annotations as well as predicted by the Sleep Quality (SQ) model are consistently between 0 and 1. Although, an informal notion can be introduced to view computed SQ values as probabilities if the outcome is viewed like a Bernoulli trial with binary realizations {good sleep, bad sleep}, SQ values are actually a measure of the goodness or quality of a sleep episode, with 1 being the best sleep possible [9, 13, 14].
CONCLUSION
As mentioned earlier, the Sleep Quality (SQ) model is influenced principally by the correctness of the forecasted future HRV power spectrum under the current methodology. It follows, therefore, that the general usefulness of the presented approach would depend on the ability of the learning model to generalize over a set of different sleep patterns under the presumption that these patterns are influenced by daily physiological experiences and that most individuals have finite distinct observable physiological experiences. There is also an assumption that the observed physiological patterns of other individuals would account for the variations possible in a single individual.
It is no surprise that the result is a mixed bag, ranging from a good fit to wide deviations from the true underlying model. However, in many cases, the performance of the model provides a fair replica of the true underlying Sleep Quality (SQ) model.
Industrial or mainstream adoption might benefit significantly from a calibration step, which will enable pre-trained models to learn the “Wake-Sleep” behavior of the host patient. However, since the quality of ECG recordings from many ambulatory ECG devices is noisy, real-time signal processing and data preprocessing for continuous training might be challenging.
LIST OF ABBREVIATIONS
| SQ | = Sleep Quality |
| SP | = Sleep Potential |
| TTS | = Time to Sleep |
ETHICS APPROVAL AND CONSENT TO PARTICIPATE
This study was approved by the Texas Tech University IRB review process (IRB2017-455).
HUMAN AND ANIMAL RIGHTS
No animals/humans were used for studies that are the basis of this research.
CONSENT FOR PUBLICATION
All subjects gave written informed consent.
AVAILABILITY OF DATA AND MATERIALS
The data-source was mentioned and stated to be National Sleep Study Research (NSSR).
FUNDING
Not applicable.
CONFLICT OF INTEREST
The author declares no conflict of interest, financial or otherwise.
ACKNOWLEDGEMENTS
Declared none.

