All published articles of this journal are available on ScienceDirect.

Novel Techniques for Classification of Lung Nodules using Deep Learning Approach
Abstract
Objective:
Lung cancer is proving to be one of the deadliest diseases that is haunting mankind in recent years. Timely detection of the lung nodules would surely enhance the survival rate. This paper focusses on the classification of candidate lung nodules into nodules/non-nodules in a CT scan of the patient. A deep learning approach –autoencoder is used for the classification.
Investigation/Methodology:
Candidate lung nodule patches obtained as the results of the lung segmentation are considered as input to the autoencoder model. The ground truth data from the LIDC repository is prepared and is submitted to the autoencoder training module. After a series of experiments, it is decided to use 4-stacked autoencoder. The model is trained for over 600 LIDC cases and the trained module is tested for remaining data sets.
Results:
The results of the classification are evaluated with respect to performance measures such as sensitivity, specificity, and accuracy. The results obtained are also compared with other related works and the proposed approach was found to be better by 6.2% with respect to accuracy.
Conclusion:
In this paper, a deep learning approach –autoencoder has been used for the classification of candidate lung nodules into nodules/non-nodules. The performance of the proposed approach was evaluated with respect to sensitivity, specificity, and accuracy and the obtained values are 82.6%, 91.3%, and 87.0%, respectively. This result is then compared with existing related works and an improvement of 6.2% with respect to accuracy has been observed.
1. INTRODUCTION
Lung cancer, one of the most fatal diseases, is affecting human health in recent times. The number of people who succumb to this fatal disease is much more than that of breast and prostate cancer put together [1]. An SPN which might represent the early stages of lung cancer is a well marginated rounded abnormality in the lung with a diameter less than 3 cm. Early detection of SPNs at an appropriate time contributes to the enhancement of the survival rate [2].
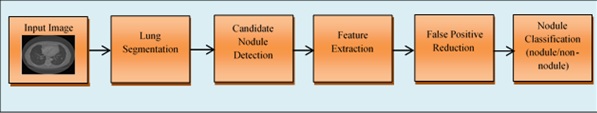
Among various imaging modalities, Computed Tomography (CT) has been mostly preferred by radiologists because of its ability to detect both acute and chronic variations in lung organ. A typical CT scanner can generate hundreds/thousands of cross-sectional images per patient both in 2-D and 3-D planes. To handle such massive information, the radiologists were assisted by CAD systems which help in making a precise prognosis about the disease and to make the proper planning about the medications. In general, the CAD systems for cancer detection comprises several processing stages including image acquisition, lung parenchyma segmentation, candidate nodule detection, feature extraction, false-positive reduction, and Nodule classification is as shown in Fig. (1).
Even with advancements in algorithmic design and implementations, recent CAD schemes having very high sensitivity, the possibility of marking the non-nodule structures as nodules is very common resulting in a high degree of false positives. Such a high number of false positives may result in a radiologist spending more time in examining each identified candidate nodules. The need for reducing the false positives is to reach high sensitivity [3] and this is a process of binary classification i.e. categorizing the candidates as nodule or non-nodule. Hence there is an urgent need of enhancing current CAD systems which exhibit improved performance in detecting and correctly classifying the nodules.
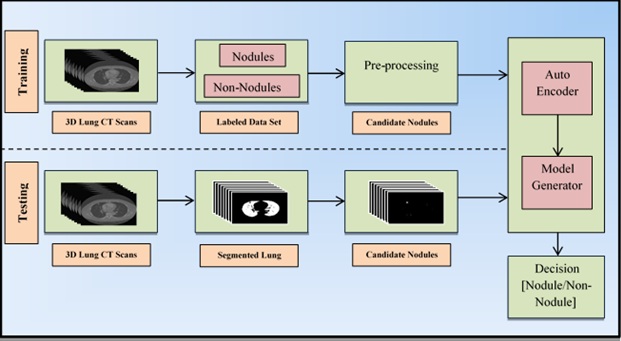
This paper proposes an approach that classifies the candidate nodules as either nodule or non-nodules based on one of the deep learning approaches called autoencoder. The proposed methodology replaces the feature extraction component which is commonly found in most of the conventional CAD systems and the components of the proposed system are shown in Fig. (2).
The remaining sections of the paper are as follows. Section II summarizes the literature review. Section III illustrates the proposed methodology. Experimental results and the discussions are presented in Section IV. Section V concludes this paper.
2. LITERATURE SURVEY
The last few decades have witnessed several contributions towards developing the CAD systems for identifying and localizing the lung nodules in various imaging modalities including CT scans. An elaborated review of various techniques that constitute a conventional CAD system has been tabulated by Bhavanishankar et al. and Li et al. [4, 5]. Three different approaches for detecting the pulmonary nodules in CT scans were implemented by Camarlinghi et al. [6] resulting in an overall sensitivity of 80%. Kuruvilla et al. [7] proposed a method which used six statistical features extracted from the segmented slices of two lungs and feed-forward back-propagation neural networks to classify the cancerous nodules resulting in sensitivity ranging from 82% to 91.4%. Torres et al. [8] proposed a CAD system based on Channeler Ant model for segmentation and a feed-forward neural network for classification of nodules, and this approach resulted in a sensitivity of about 80%.
Many of the conventional CAD systems exhibit inferior performance in detecting nodules because they make simple assumptions about the shape of the nodules and they make use of low-level descriptors to catch the discriminative features. Since CT scans are inherently in 3D and this very nature plays an important role in detecting nodules, deep neural networks have been very promising and are instrumentals in reducing false positives. The main advantage of the deep learning approach is that it does not extract the features as in conventional methods Rather it learns best possible feature representations from the data in the learning process. Taking this advantage, the last decade has seen many researchers contributing to the development of CAD systems using deep learning approach.
Devinder et al. [9] proposed a methodology wherein deep features are extracted using a two-layered network called autoencoder and the nodules are classified as benign or malignant. This approach resulted in an average sensitivity of 83.25%. Fakoor et al. [10] proposed an unsupervised and deep learning approach (stacked autoencoder) to classify and diagnose different types of cancers including lung cancer. Gruetzemacher et al. [11] used a deep learning approach for the classification of pulmonary nodules which resulted in a sensitivity of 78.2% with five convolution layers. Ginneken et al. [12] proposed a Convolutional Neural Network based approach to detect the pulmonary nodules in CT scans which generated the sensitivity of 78%. Most of the methods in the literature tested their algorithms on data sets obtained from LIDC-IRDI repository.
Although several researchers have contributed significantly towards reduction of false positives and achieving better classifications, they lack to deliver better accuracy with large data sets. This paper addresses this issue.

3. MATERIALS AND METHODS
3.1. Proposed Approach
The following section illustrates the proposed methodology whose architectural diagram is shown in Fig. (3). Let L={l1,l2,l3,…lk} be a set of lung 3D CT image, wherein each image has an average number of 180 slices of lung. Each of these slices li is subjected to the process of segmentation wherein the exact lung parenchyma has been extracted. Thresholding, morphological operations, and connected component labelling are used to segment lung parenchyma [13]. The reason for identifying the candidate lung region is to reduce the search space for actual nodule detection and classification. In addition to the actual lung nodules, the segmented lung parenchyma contains the non-noduleartifacts such as blood vessels, irregularities, and remains of bronchus which needs to be eliminated. The candidate lung nodules are extracted from the segmented lung image as mentioned by Bhavishankat et al. [14] which progressively eliminates these non-nodule artifacts and retains the candidate nodules. These candidate nodule images are segmented into a size of 50*50 and are used in subsequent processing stages.
3.2. Autoencoders Based Model Development
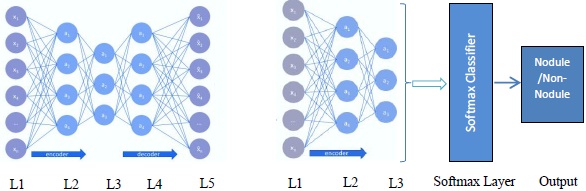
An autoencoder is a multilayer neural network with three layers namely an input layer, an encoding layer (hidden), and a decoding layer with a capability to discover structures within data to develop a compressed yet meaningful representation of the input. The proposed deep autoencoder model is shown in Fig. (4a).
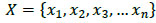
Let X be the number of local patches extracted from 3D lung cropped nodule image set which contains the set of images for nodule and a non-nodule (1). It should be noted that the set X is a training set which will have a ground truth. From the ground truth, the images in the set are labelled as nodule or non-nodule.
 |
(1) |
Hence, it is a two class problem and an autoencoder based model is developed whose description is illustrated in the following passage.
Let xi be the input data in neuron i, aij be the activation function of neuron i in the layer j, wikj be the weight mapping from neuron i in layer j to neuron k in layer j + 1, and bij be the bias associated with neuron i in layer j. The activation can be then articulated as equation (2), where i, a22 is the 2nd neuron in layer 2 and x0 through x4 are 5 input features.
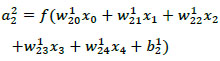 |
(2) |
The conventional feed-forward neural network differs from autoencoder in a way that an autoencoder’s output
 is always similar to its input X, where
can be computed as follows (3a and 3b).
is always similar to its input X, where
can be computed as follows (3a and 3b).
 |
(3a) |
 |
(3b) |
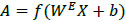
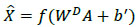
As discussed in the beginning of the section, an autoencoder consists of an encoder and a decoder. Among two layers of encoders, namely input layer and hidden layer, the latter transforms an input image X into feature vector A. The decoder which includes a hidden layer and output layer transforms feature vector A into output feature
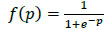
. WE and WD are weight matrices of encoder and decoder. f(.) can be either sigmoid or tanh function used to activate the neuron of each layer and their representation is given in (4) and (5).
 |
(4) |
 |
(5) |
When
≈ X, it is believed that the input feature vector X can be regenerated from compressed output feature vector A.
While training, to measure how wrong the autoencoder model is in estimating the gap between
 , the cost function is defined as follows:
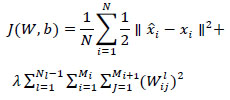 |
(6) |
The proposed deep autoencoder model has five layers including one input layer (L1), three hidden layers (L2,L3,L4), and one output layer (L5) as shown in Fig. (4a). L1 to L3 are encoding layers, L3 to L5 are decoding layers. Li forms the input to the layer Li+1 and the weights can be computed as per (3a, 3b). By minimizing the cost function (6) the model is trained and tuned. The proposed model is a two stacked autoencoder. The compressed features obtained from hidden layer L2 is presented to the second stacked autoencoder. The features obtained from the hidden layer L3 of the second stacked encoder is fed to the softmax layer. In a similar way, the working model of the entire autoencoder network is constructed and is shown in Fig. (4b).
The above model is tested for varied parameters and the detailed description is given in section IV.
The output obtained from the stacked autoencoder is the trained features vector
, i.e. every patch of lung nodule xi is transformed into a fixed-length trained feature vector txi as shown in (7). The hidden layer of the second stacked autoencoder is fed to the softmax classifier to obtain the classification results as nodule or non-nodule. The designed model is tested on the data set to analyse the performance of the system.
 |
(7) |
| Algorithm: Deep autoencoder for lung nodule classification |
| Input: Cropped images of candidate lung nodules as feature vector X and ground truth (labelled data) |
| Output: Binary classification of candidate lung nodules as nodule/non-nodule |
| Steps: |
|
Note: The proposed model comprises stacked autoencoders. 1. Compute the activation for every neuron in first autoencoder computed with appropriate weights (2.) 2. Compute cost function for the first autoencoder computed using (6). 3. Minimize cost function using backpropagation. (training of first autoencoder). 4. Extract the hidden layer after training the first autoencoder, and feed to second autoencoder 5. Repeat steps 1,2,3 for the second autoencoder to form a stacked autoencoder (training of entire stacked autoencoder) 6. Feed the hidden layer of second autoencoder and the ground truth data to the softmax layer for classification (nodule/non-nodule) |
4. EXPERIMENTAL RESULTS AND DISCUSSION
4.1. Dataset: LIDC – IDRI Database
The Lung Image Database Consortium (LIDC) and Image Database Research Initiative (IDRI) have established an open access repository that includes CT scans of 1018 cases with annotated lesions. This annotation process was carried out by 4 experienced radiologists. Each of 1018 cases include a set of images and the corresponding XML file which contains the result of the annotation carried out by expert radiologists. Table 1 highlights the data set used for experimental analysis in the proposed autoencoder model.
| No. of cases | Average No. of images | Size | Color type |
|---|---|---|---|
| 600 | 600*230 | 512 * 512 | Gray scale |
4.2. Experimental Details
The parameters considered in the proposed autoencoder model are hidden size, max epochs, L2 regularization, sparsity proportion, and sparsity regularization. Several experiments have been conducted on the data set for varied values of the above-stated parameters.
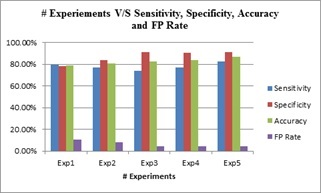
The outcome of these experiments is evaluated against the evaluation metrics namely, sensitivity, specificity, and accuracy. Summary of the results is depicted in Table 2, which portrays the values obtained for different metrics after the experimentation. From Table 2, it is evident that the best efficiency obtained with respect to sensitivity, specificity, and accuracy are 82.6%, 91.3%, and 87.0%, respectively. The last column of the table shows the reduction in the false-positive rate and the optimum value of the FP rate is found to be 4.3%. These results are also graphically illustrated in Fig. (6).
| Exp. No. | Sensitivity1 | Specificity2 | Accuracy3 | FP rate |
|---|---|---|---|---|
| Exp1 | 79.7% | 78.4% | 79.1% | 10.8% |
| Exp2 | 77% | 83.8% | 80.4% | 8.1% |
| Exp3 | 73.9% | 91.3% | 82.6% | 4.3% |
| Exp4 | 77% | 90.5% | 83.8% | 4.7% |
| Exp5 | 82.6 | 91.3% | 87% | 4.3% |
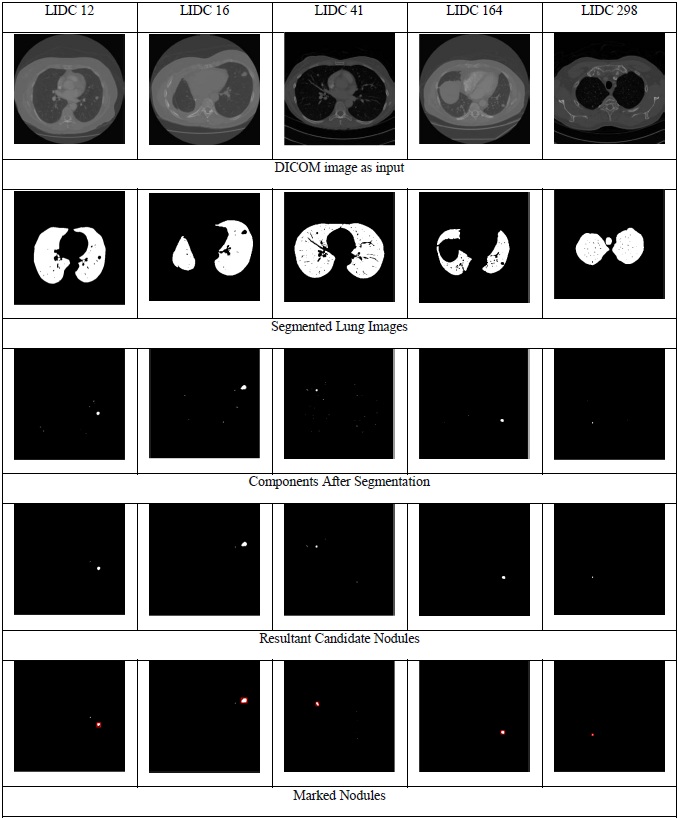
The image representations of the results obtained for the proposed approach are shown in Fig. (5). The figure demonstrates the results obtained for five LIDC cases. The first row in the figure shows the input DICOM images, the second row shows the segmented lung, and the third row depicts the classification of the candidate nodules as nodules/non-nodules (nodules are marked using red colour bounding box). The experimental results are compared with the existing approaches [11, 15-17] with LIDC data set and it can be observed from Table 3 that the results of the proposed approach have outperformed the existing approaches consistently with respect to accuracy [18-22].
CONCLUSION
A deep learning approach, autoencoder for the classification of candidate lung nodules as nodules/non-nodules has been presented in this paper. Several experiments have been conducted on LIDC data set and the results were compared with existing approaches.
The outcome of the proposed approach is so promising that this approach can be further extended to be able to classify the nodules as benign and malignant. A substantial improvement of 6.2% in respect of accuracy is observed from the experimental results. On the other hand, the limitation of the proposed model is that it requires large dataset to tune the parameters of the autoencoder. Normally, the training time of the proposed model is more, which is an offline process. However, the testing time will be very less.
The scope for improvement of the proposed model is auto-tuning for autoencoders, where the learning parameters can be learnt by the algorithm itself. Also, a combination of Convolutional Neural Networks and autoencoders can be implemented for further enhancement in the results.
ETHICAL APPROVAL AND CONSENT TO PARTICIPATE
Not applicable.
HUMAN AND ANIMAL RIGHTS
No animals/humans were used for studies that are the basis of this research.
CONSENT FOR PUBLICATION
Not applicable.
AVAILABILITY OF DATA AND MATERIALS
Not applicable.
FUNDING
None.
CONFLICT OF INTEREST
The authors declare no conflict of interest, financial or otherwise.
ACKNOWLEDGEMENTS
Decleared none.

