All published articles of this journal are available on ScienceDirect.

Automatic Identification of the Repolarization Endpoint by Computing the Dominant T-wave on a Reduced Number of Leads
Authors Info & Affiliations
Abstract
Electrocardiographic (ECG) T-wave endpoint (Tend) identification suffers lack of reliability due to the presence of noise and variability among leads. Tend identification can be improved by using global repolarization waveforms obtained by combining several leads. The dominant T-wave (DTW) is a global repolarization waveform that proved to improve Tend identification when computed using the 15 (I to III, aVr, aVl, aVf, V1 to V6, X, Y, Z) leads usually available in clinics, of which only 8 (I, II, V1 to V6) are independent. The aim of the present study was to evaluate if the 8 independent leads are sufficient to obtain a DTW which allows a reliable Tend identification. To this aim Tend measures automatically identified from 15-dependent-lead DTWs of 46 control healthy subjects (CHS) and 103 acute myocardial infarction patients (AMIP) were compared with those obtained from 8-independent-lead DTWs. Results indicate that Tend distributions have not statistically different median values (CHS: 340 ms vs. 340 ms, respectively; AMIP: 325 ms vs. 320 ms, respectively), besides being strongly correlated (CHS: ρ=0.97, AMIP: 0.88; P<10-27). Thus, measuring Tend from the 15-dependent-lead DTWs is statistically equivalent to measuring Tend from the 8-independent-lead DTWs. In conclusion, for the clinical purpose of automatic Tend identification from DTW, the 8 independent leads can be used without a statistically significant loss of accuracy but with a significant decrement of computational effort. The lead dependence of 7 out of 15 leads does not introduce a significant bias in the Tend determination from 15 dependent lead DTWs.
INTRODUCTION
In spite of the latest improvements in the treatment of severe ventricular arrhythmias, sudden cardiac death (SCD) is still among the main causes of death in the industrialized countries. Nowadays, a subject undergoes a major clinical cardiovascular checking and treatment only after surviving a life threatening arrhythmic event. As a consequence, availability of tools that allow identification of individuals at increased risk before the occurrence of episodes of ventricular arrhythmias are desirable because of high social impact in relation to the problem of SCD.
Abnormalities in the ventricular repolarization phase of the heart (ventricular relaxation) are well known to predispose to malignant ventricular arrhythmias [1-6] and, thus, associate to SCD. Performing an electrocardiographic (ECG) test is a simple, cheap and noninvasive way to investigate cardiac ventricular repolarization by automatically or manually analyzing the ST segment and the T-wave of the ECG. The features of such test make it particularly suitable for massive scale applications. The QT interval [2, 3], which provides the total duration of the ventricles contraction and subsequent relaxation by computation of the time distance between the beginning of the Q wave and the end of the T-wave, is currently the most commonly used repolarization index of cardiovascular risk. In spite of the fact that its prolongation is usually used to indicate cardiovascular risk or safety in clinical trials, the QT interval measure is often little reliable for various reasons. First of all the identification of the T-wave endpoint (Tend) from clinical ECG tracings is hard because the ECGs are often affected by the presence of noise and artefacts that may distort the repolarization waveforms. Moreover, such repolarization waveforms, even when clean, can be represented by several morphological variants. As a consequence Tend automatic localization by different automatic methods is affected by a significant variability, of the order of few tens of ms, which reflects in variability of QT interval measure [7, 8]. Eventually, the QT measure is lead dependent, phenomenon known as QT dispersion [1, 9-13]; still, there are no conventional standards about how to measure the QT interval, even if it is common custom to perform QT interval evaluations from lead II [8, 9]. On these bases we believe that a reliable QT interval measurement should be performed on global repolarization waveforms, which are obtained by opportunely combining several ECG leads, rather than relying on a single arbitrary lead. Indeed, the global repolarization waveforms have the advantage of being characterized by a reduced level of noise, thus improving automatic Tend detection by also allowing a better discrimination between the T-wave and any physiologic low-amplitude U wave that could be present [9, 12, 14].
The dominant T-wave (DTW) is an electrophysiological repolarization model introduced by van Oosterom [15] that provides a global repolarization waveform obtainable as a weighted average of the T-waves over the leads [15]. In a recent study [16] we have demonstrated that the DTW is a clinically useful tool since automatic Tend identification reliability is improved when Tend is localized in the DTW rather than in each single ECG lead. Considering that the higher the number of leads, the better the accuracy in estimating the DTW [15], in that work we have used the maximum number of ECG leads easily available in clinics, that is 15 leads, which include the 3 limb leads (i.e. leads I, II and III), the 3 augmented limb leads (i.e. leads aVr, aVl and aVf), the 6 precordial leads (i.e. leads V1 to V6) and the 3 orthogonal leads (i.e. leads X, Y and Z). It might be argued, however, that this set of 15 ECG leads includes different lead-systems (as said the 3 orthogonal leads, the 6 precordial leads and the 12 standard leads) which may be used independently. Moreover, since ECG leads III, aV1, aVr aVf, X, Y, Z can be obtained from leads I, II, V1 to V6 by application of well-known transformations (III=II-I; aVr=-(I+II)/2; aVl= (I-III)/2; aVf=(II+III)/2; eventually, X,Y, and Z can be derived from leads I, II, V1 to V6 using the inverse Dower’s transform [17]), only 8 leads (I, II, V1 to V6) out of 15 are linearly independent, so that the results could be biased by data redundancy. Thus, the aims of the present work were 1) to evaluate if automatic Tend identification remains clinically useful when performed on a DTW obtained using one of the above mentioned lead systems; and 2) to test if the dependence among leads introduces significant bias in the Tend determination. To this aim Tend measurements from DTWs of 46 control healthy subjects (CHS) and 103 acute myocardial infarction patients (AMIP) obtained using 15 leads (also reported in [16]) were compared with those obtained in the same subjects using the 3 orthogonal leads, the 6 precordial leads, the 12 standard leads and the 8 independent leads.
CLINICAL DATA AND METHODS
Study Populations and Clinical Data
Our clinical data consisted of a collection of single multi-lead sinus beats, one for each enrolled subject, randomly selected from the 15-lead (I to III; aVr, aVl, aVf, V1 to V6, X to Z) ECG recordings of 46 control healthy subjects (CHS; 38 males), who usually show regular repolarization waveforms, and 103 acute myocardial infarction patients (AMIP; 84 males), who instead are typically characterized by abnormal ST segments and T-waves. All ECG data are available at the PTB Diagnostic database of Physionet (www.physionet.org), have been fully de-identified (anonymized), and they may be used without any further institutional review board approval. The selected ECG beats, originally sampled at 1000 Hz, were subsequently resampled at 200 Hz before Tend identification and DTWs computation (see below). Tend was first independently identified in each single lead of the selected beat, and subsequently in five DTWs, respectively constructed using the 3 orthogonal leads (DTW3), the 6 precordial leads (DTW6), the 12 standard leads (DTW12), the 8 independent leads (DTW8) and all the 15 available dependent leads (DTW15).
The Dominant T-wave
Using an equivalent surface source model, van Oosterom [15, 18, 19] showed that the ECG repolarization morphologies observed in all ECG leads on the thorax can be seen as a scaled version of a single waveform, which was called Dominant T-wave (DTW) since it is supposed to dictate the shape of all the observed T-waves. Mathematically, the DTW can be defined as the time derivative of the transmembrane potential (D') during repolarization [15], even though, in clinical applications, it can be estimated by performing a weighted average of the corresponding T-waves of multiple-leads ECG recordings [15]. Let Tl(t) be the repolarization waveform relative to lead l (l=1,2…L) expressed as function of time. It can be demonstrated [15] that the DTW estimated using L leads (DTWL) can be estimated as a weighted average of the Tl(t):
 |
(1) |
In Eq. (1) the weight relative to each lead, i.e. wl, is obtained by integration of Tl(t) over the repolarization interval [15].
The Daskalov and Christov’s Method for Automatic T-wave Offset Identification
In this study automatic Tend identification was performed using a Matlab implementation of the Daskalov and Christov’s method (D&CM) [20]. Details of this technique can be found elsewhere [20]. Briefly, the D&CM algorithm, after having identified the isoelectric point Sis (occurring at a time instant indicated with tSis), defines two wings (i.e. adjacent functions), respectively termed W1 and W2, which slide through repolarization (i.e. for t > tSis):
 |
(2) |
 |
(3) |
In Eq. (2) and Eq. (3) t is time, ΔT is a time constant (ms) and ecg(t) is the ECG signal. According to the numerical value assigned to ΔT, the W1 and W2 functions allow the identification of specific points within repolarization. At first, the T-wave peak, Tp, is identified by the minimum of the function obtained as W1(t, 40)×W2(t, 40). The point to the right of Tp in correspondence of which W1(t, 10)×W2(t, 10) becomes smaller than 3 µV represents an isoelectric point, Tis, which together with Tp , is used to define the T-wave amplitude (Tampl):
 |
(4) |
Then, Tend is searched in a time window starting from the repolarization instant in which ecg(t) is equal to 0.2∙Tampl (i.e. a little earlier than Tis), and is identified as the instant that minimizes the angle between the segments (vectors) identified by W1(t, 10) and W2(t, 10). Eventually, the time distances between Tend and the previous R peak (ms) is measured. Such interval (R-Tend) is the output of the D&CM algorithm, as it represents Tend localization starting from the R peak (always available when automatically analyzing an ECG).
Statistics
The Lilliefors test was used to test normality of parameters distributions. The parameters characterized by normal distribution were described in terms of mean and standard deviation (mean ± sd) and compared using the T-test. Instead the parameters characterized by not-normal distributions were described in terms of 25th, 50th (median) and 75th percentiles (median [25th 75th percentiles]) and compared using the Wilcoxon rank-sum test. The distributions of binary parameters were compared using the chi-square test or, when not possible (expected cell frequency < 5), the Fisher exact one-tailed probability test. Associations between two parameters distributions were evaluated using the correlation coefficient (ρ). A correlation was considered strong if ρ > 0.85. Statistical significance level was 0.05 in all cases.
RESULTS
A detailed description of the clinical parameters relative to our CHS and AMIP can be found elsewhere [16]. Concisely, the CHS were significantly younger than the AMIP (46 ± 14 years vs. 58 ± 11 years; P< 10-5) and characterized by lower heart rate at recording time (69 ± 11 bpm vs. 81 ± 15 bpm).
Examples of repolarization morphologies associated to a healthy subject and an acute myocardial infarction patient, together with the various dominant T-waves (DTW3, DTW6, DTW12, DTW8 and DTW15) are reported in Fig. (1), whereas the Tend distributions obtained by application of the D&CM to all DTW3, DTW6, DTW12, DTW8 and DTW15 of both CHS and AMIP populations are reported in Table 1. Within each population, the median value of the Tend distribution relative to a specific DTW obtained with no more than 12 leads (i.e. DTW3, DTW6, DTW12 and DTW8) were compared with the median value of the Tend distribution obtained using 15 leads (DTW15). No significant differences were observed, with the only exception of median Tend measured in the DTW6 that was found to be significantly longer than that measured in the DTW15 (335 ms vs. 320 ms; P<0.05).
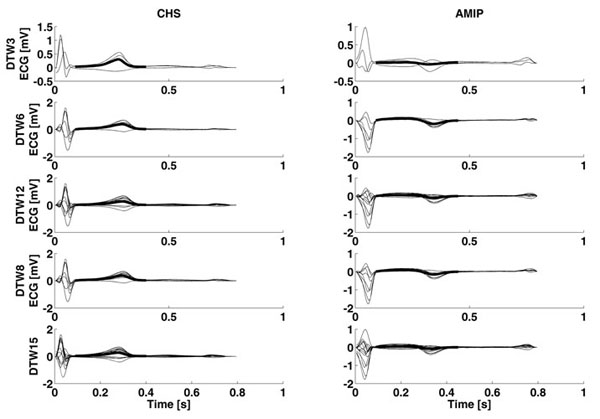
Examples of dominant T-waves computed using 3 orthogonal leads (DTW3), 6 precordial leads (DTW6), 12 standard leads (DTW12), 8 independent leads (DTW8) and 15 dependent leads (DTW15) relative to a control healthy subject (CHS) and an acute myocardial infarction patient (AMIP).
Tend distributions (median and [25th and 75th percentiles]; ms) obtained by application of the the Daskalov and Christov’s method to dominant T-waves obtained using the 3 orthogonal leads (DTW3), the 6 precordial leads (DTW6), the 12 standard leads (DTW12), the 8 independent leads (DTW8) and the 15 dependent leads (DTW15) of both control healthy subjects (CHS) and acute myocardial infarction patients (AMIP).
| CHS (46) |
AMIP (103) |
|
|---|---|---|
| DTW3 | 330 [305, 350] |
320 [295, 350] |
| DTW6 | 345 [325, 370] |
335* [310, 359] |
| DTW12 | 335 [315, 360] |
320 [290, 345] |
| DTW8 | 340 [320, 365] |
325 [305, 355] |
| DTW15 | 340 [320, 360] |
320 [290, 350] |
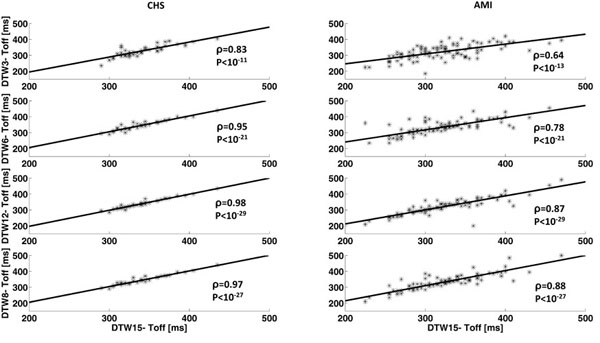
Regression lines and corresponding correlation values between Tend measurements from dominant T-waves computed using 3 orthogonal leads (DTW3), 6 precordial leads (DTW6), 12 standard leads (DTW12), 8 independent leads (DTW8) vs. 15 dependent leads (DTW15) relative to the control healthy subjects (CHS) and the acute myocardial infarction patients (AMIP).
The correlation values between Tend measurements obtained using DTW3, DTW6, DTW12, and DTW8 against DTW15 are reported in Table 2, while the graphical representations are shown in Fig. (2). Results indicate that Tend measurements from DTW15 are strongly associated (ρ > 0.85) to those from the other DTWs if the number of used leads is at least 6 in the CHS and 8 in the AMIP. In particular the correlation values obtained in the case of DTW12 and DTW8 were very close within a population for both CHS (ρ = 0.98 and ρ = 0.97, respectively, P < 10-27) and AMIP (ρ = 0.87 and ρ = 0.88, respectively, P < 10-27) even though higher in the former than in the latter.
Value of the correlation coefficient (ρ) between Tend measurements from dominant T-waves obtained using the 3 orthogonal leads (DTW3), the 6 precordial leads (DTW6), the 12 standard leads (DTW12), the 8 independent leads (DTW8) and the 15 dependent leads (DTW15) of both control healthy subjects (CHS) and acute myocardial infarction patients (AMIP).
| CHS (46) |
AMIP (103) |
|||
|---|---|---|---|---|
| ρ | P | ρ | P | |
| DTW3-DTW15 | 0.83 | <10-11 | 0.64 | <10-11 |
| DTW6-DTW15 | 0.95* | <10-21 | 0.78 | <10-21 |
| DTW12-DTW15 | 0.98* | <10-29 | 0.87* | <10-29 |
| DTW8-DTW15 | 0.97* | <10-27 | 0.88* | <10-33 |
The reduction of the number of leads for DTW computation for Tend determination implied a significant reduction of computations that reflected in a time saving during data analysis. Since the actual running time strongly depends on the computer characteristics and the programming language used to implement the algorithm, the quantitative results were reported in normalized units (n.u.). By normalizing for the mean time needed to identify Tend from DTW15 from a single subject, the time needed to identify Tend from DTW3, DTW6, DTW12, DTW8 and DTW15 was 0.84 n.u., 0.87 n.u., 0.95 n.u., 0.88 n.u. and 1 n.u. respectively.
DISCUSSION
Tend dispersion (i.e. Tend variability among leads) often causes a low Tend identification reliability. To overcome Tend dispersion issue, global repolarization waveforms [9, 12, 14-16] can be used. The global repolarization waveforms, indeed, are not obtained from a single arbitrary ECG lead but rather by combination of several leads, process that typically reduces the level of noise and allows a more accurate lead-independent Tend identification [1, 9-13]. The DTW is a global repolarization waveform originally proposed by van Oosterom after observing that the T-wave waveforms among leads appear to be a scaled version of a dominant waveform that can be generated using a biophysical model [15, 21]. In applications finalized to Tend identification (and not to obtain the best possible T-wave morphology), a linear relationship between the surface ECG waveforms and the repolarization phase of the myocytes transmembrane potentials can be hypothesized [15, 21], so that the DTW can be estimated as a weighted average of the repolarization ECG waveforms [15, 21]. The DTW estimation accuracy is supposed to increase with the number of used leads. Still, the use of 64 ECG leads proposed in the original experimental setting [15] is not realistic in clinical practice. In a previous study we have demonstrated that the use of the DTW estimated from 15 ECG leads enhances Tend identification by reducing both inter-method variability and inter-lead variability [16]. Instead, in this study we evaluated if the number of used leads can be further reduced in order to make possible the use of the DTW for Tend determination purposes also in those cases in which less than 15 leads are available. This possibility indeed, would make the DTW clinically more useful, also because of the significant reduction of computational efforts and thus, running time. Eventually, issues relative to the ECG lead dependence have also been analyzed.
Before DTW computation and Tend identification, the ECG tracings, originally sampled at 1000 Hz, were down-sampled at 200 Hz mainly. Down sampling is performed to get smoother waveforms since it eliminates the high-frequency components, simultaneously getting a significant reduction of the number of computations required for estimating the DTW. In the specific, resampling at 200 Hz represents a tradeoff between the need of smoothing the DTW for a reliable automatic Tend identification and the need to have a Tend resolution of no less than 5 ms, as suggested by Malik for QT intervals measurements [9]. For what concerns automatic Tend identification, the D&CM [20] was used since, differently from most automatic Tend identification methods [22, 23] (and similarly only to Zhang et al. method [24]), it is suitable for Tend identification from the DTW because it requires only information relative to the repolarization segment. The more popular approaches [22, 23] typically based on the first-derivative threshold are not applicable to our DTW-based study since they also require knowledge of some QRS features. Still, the DTW, by definition, models only repolarization so that a global depolarization waveform for the first-derivative computation is not available.
Results indicate that Tend distributions obtained using at least 8 leads (i.e. obtained using the 12 standard leads or the 8 independent leads) not only have a comparable median value (i.e. not statistically different) to those obtained using the 15 dependent leads, but are also strongly correlated to them (ρ > 0.87, P < 10-27) in both healthy and diseased conditions. A strong correlation indicates a linear dependence between two Tend distributions. If these have also the same median value, the two Tend distributions (and not only their median value) are statistically not different. Consequently, measuring Tend from DTW12 or DTW8 is statistically equivalent to measure Tend form DTW15. Moreover, the linear dependence between leads present among the 12 standard leads (4 out of 12) and among the 15 dependent leads (7 out of 15) do not seem to have a practical effect on Tend identification, since this results equivalent to that obtained using 8 independent leads. Goodness of Tend identification, indeed, seems more linked to regularity of repolarization than to the number of leads used to estimate the DTW. Indeed, within each population (CHS or AMIP), the values of ρ obtained correlating Tend values from DTW12 vs. DTW15 and from DTW8 vs. DTW15 were very close (ρ = 0.97 - 0.98 for the CHS and ρ = 0.87 - 0.88 for the AMIP), but when comparing one population against the other, the ρ values relative to the CHS, which have a regular repolarization waveforms, were considerably higher than those relative to the AMIP, which instead have a more complex repolarization waveforms. Eventually, the use of DTW8 instead of DTW15 for Tend computation allowed a running time reduction of 12%.
It is worth to stress that the fact that in our clinical application Tend identification from DTW8 is statistically equivalent to that from DTW15 (or DTW12) doesn’t mean that DTW8 and DTW15 (or DTW12) are equivalent. Indeed this study was not about evaluating the goodness of the DTW in accurately reconstructing repolarization morphologies, but rather to investigate if by reducing the number of leads used to determine the DTW (and thus if by using a less accurate DTW) the Tend determination reliability also reduces. Our results indicate that Tend identification accuracy is maintained if the number of leads are reduced from 15 till 8. If using fewer than 8 leads, Tend identification can becomes less reliable, especially in the presence of complex repolarization morphologies as those characterizing the AMIP. Only specifically designed studies, which will be matter of future works, will demonstrate how using a reduced number of leads to determine DTW would affect other T-wave morphological parameters.
CONCLUSION
For the clinical purpose of automatic Tend identification from DTW, the number of leads used to compute the DTW can be reduced from the 15 dependent leads (previously found suitable to provide reliable measurements) to the 8 independent leads without a statistically significant loss of accuracy but with a significant decrement of computational efforts. The lead dependence among the 15 leads does not introduce significant bias in the Tend determination.
LIST OF ABBREVIATIONS
CONFLICT OF INTEREST
Corrado Giuliani and Francesco Di Nardo have no financial and/or personal relationships with people or organizations that could inappropriately influence (bias) this work.
Angela Agostinelli, Sandro Fioretti and Laura Burattini declare their partnership to the academic spin-off B.M.E.D. SRL (Biomedical Engineering Development, Department of Information Engineering, Polytechnic University of Marche, Ancona, Italy, www.bmed-bioengineering.com).
ACKNOWLEDGEMENTS
Declared none.

