All published articles of this journal are available on ScienceDirect.

BP Neural Network Model-Based Physical Exercises and Dietary Habits Relationships Exploration
Abstract
With the continuous progress of society and increment of social pressure, people have paid little and little attentions to physical exercises and dietary necessity. Taking Beijing, Shanghai, Guangzhou, Shenzhen, Shijiazhuang and Baotou university students as research objects, targeted at physical exercises time and dietary habits, it starts investigation. Making principal component analysis of investigation results, it indicates that cereal intake is principal component in dietary habits; strenuous exercise time and general physical exercise time are the principal components in physical exercise. Utilizing BP neural network model, and analyzing these seven cities’ physical exercises and dietary habits conditions, the result indicates that except for Shenzhen, all the other six cities haven’t reached the standard.
1. INTRODUCTION
Good dietary habits and necessary physical exercises are important principles to ensure human health. As far as an office worker is concerned, as social pressure increases, pace of life speeds up, more and more people have started neglecting physical exercises and dietary necessity. As far as student is concerned, learning and video game have occupied their whole time of life. People who possesse toned body is the important factor to the prosperity of the country; therefore, physical exercises and dietary are especially important [1].
In 2012, Gao Min implemented lifestyle and physical health research on Shandong Medicine and Food Career College’s students, and took freshman as research objects. Research results indicated that students’ physical conditions were good, but excellent comprehensive evaluation people amount was fewer; most students were in the level of pass line [2, 3]. Students’ bad dietary habits was one of reasons that led to a decline in health level. Most students replaced sleep and physical exercise time with the time of watching TV and surfing online. The writer pointed out that students’ lifestyle and physical health had obvious correlation. Students of good physical exercise habits had comparatively high mental health level and physical test performances [4].
In 2003, Gao Gen-Di and others researched on Shanghai teenagers’ dangerous behaviors, from which it included daily dietary and physical exercises status research. They conducted a questionnaire survey on 105 schools’ partial students. Survey contents were weekly dietary contents and physical exercises conditions. The survey result indicates that nearly half students’ dairy product intake was lower, above quarter students excessively took in sweets, and even fewer students took in deep-fried and pickled food every day. Half the students strenuous exercise amount was not enough, above half students didn’t participate in extracurricular exercises, and as students’ ages increased, phenomenon of not participating in physical exercise became even more serious [5]. At the same time, it indicated that schoolgirls physical exercise level was even lower than that of schoolboys. The writer pointed out that it was quite necessary to develop dietary education and physical exercise ideological education targeted at teenagers.
In 2013, Xu Ya-Nan researched on elementary and secondary school students’ food safety education problem. Firstly it explained food safety current status, and then applied multiple research methods to carry out questionnaire survey on Nanjing city elementary and secondary school students. Finally, targeted at present problems, it presented solution. Investigation result indicated that local primary and secondary school students’ emphasis on food safety was high, but in students’ contiguous education, school food safety education ranked the last. Most of students suggested integrating food safety education into physical health education course [6-8].
The paper adopted questionnaire survey, researched on physical exercises and dietary necessity, and pointed out current existing issues and presented corresponding countermeasures.
2. QUESTIONNAIRE SURVEY AND RESULTS
Taking seven cities-Beijing, Shanghai, Guangzhou, Shenzhen, Shijiazhuang, Tianjin and Baotou- as investigation sites, and regarding university students as investigation objects, the questionnaire contents include daily dietary behaviors and physical exercises behaviors.
| City | Cereal<250g | Fruit and vegetable<350g | Protein<70g | Fried food>50g | Sugared beverage>50g |
|---|---|---|---|---|---|
| Beijing | 35% | 21% | 15% | 26% | 29% |
| Shanghai | 28% | 19% | 13% | 21% | 27% |
| Guangzhou | 46% | 15% | 10% | 19% | 31% |
| Shenzhen | 39% | 20% | 12% | 16% | 35% |
| Shijiazhuang | 26% | 25% | 25% | 29% | 29% |
| Tianjin | 29% | 29% | 23% | 32% | 23% |
| Baotou | 35% | 35% | 19% | 23% | 28% |
| City | Strenuous exercises<20min | General exercises<40min | Physical exercises<50min | Electronic entertainment>100min |
|---|---|---|---|---|
| Beijing | 80% | 65% | 69% | 86% |
| Shanghai | 76% | 68% | 72% | 79% |
| Guangzhou | 83% | 59% | 79% | 83% |
| Shenzhen | 79% | 52% | 68% | 76% |
| Shijiazhuang | 89% | 74% | 83% | 89% |
| Tianjin | 82% | 69% | 76% | 84% |
| Baotou | 91% | 64% | 80% | 81% |
2.1. Investigation Contents
Using year 2001 American disease control center’s teenagers’ dangerous behaviors questionnaire survey as evidence, combining with Chinese current status, the questionnaire survey contents were designed. Among them, daily dietary habits investigation contents include cereal intake amounting to less than 250 gram, fruit and vegetable intake amounting to less than 350 gram, protein intake amounting to less than 70 gram, sugared beverage intake amounting to above 50 gram, and fried and other junk food intake amounting to above 50 gram. Physical exercises investigation contents include strenuous exercises less than 20 minutes, general exercises less than 40 minutes, physical exercises less than 50 minutes, and watching TV and surfing online such entertainment time above 100 minutes [7].
2.2. Investigation Results
Respectively a random sample of 100 university students in each investigation site, filled out questionnaire anonymously. Each subject is required to independently complete the questionnaire to ensure questionnaire survey results validity. By sorting out and making statistics of investigation results, it can get investigation result as shown in Table 1, Table 2.
From Table 1, it is clear that all regions university students’ dietary structure has certain differences including: Guangzhou students lack of cereal intake; Baotou students lack of fruit and vegetable intake; Shijiazhuang students lack of protein intake; Tianjin students fried food intake amount is larger; and Shenzhen students’ sugared beverage intake amount is larger.
From Table 2, it finds out that Baotou students lack strenuous exercises, whereas Shijiazhuang students lack general exercises and physical exercises as well as take too long time in electronic entertainment.
3. PRINCIPAL COMPONENT ANALYSIS
Main thought of principal component analysis is variable’s dimension reduction. It is a statistical analysis method that transforms multiple variables into fewer main variables. It is generally used for data compression, system evaluation, regression analysis, weighted analysis and so on.
3.1. Definition of Principal Component Analysis Approach
The way of principal component analysis is reducing dimension of variables, which is recombining original many variables with correlation into a group of uncorrelated variables to replace original variables. Therefore, we can pay attention to every time observation’s variables with maximum variation, and use every time observation’s small changed variables as constant to process and get rid of them, so that reduces variables number in question that needs to be considered.
Assume that there is m pieces of original indicators to do principal component analysis, which are recorded as x1, x2,...,xm, now it has pieces of samples, corresponding observation value is
 , and k = 1,2,...,m takes standardization transformation, and then transform xk into
 , that:
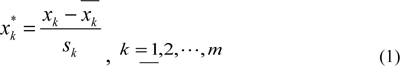
Among them,
 and sk are respectively xk average number and standard deviation;
average number is 0, standard deviation is 1.
and sk are respectively xk average number and standard deviation;
average number is 0, standard deviation is 1.
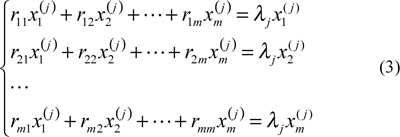
According to each sample original indicator observation value  or after standardization observation value xik, it solves coefficient bkj, establishing indicator that is transformed through standardization to express comprehensive indicator z j equation
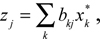
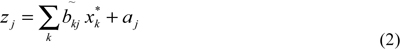
which can also establish equation that uses original indicator xk to express comprehensive indicator z j
There are two requirements for comprehensive indicators:
(1) Comprehensive indicators are completely independent of each other or uncorrelated.
(2) Every comprehensive indicator that reflected each sample gross information content is equal to corresponding feature vector (comprehensive indicator coefficient) feature values. In general, it is required that selected comprehensive indicator feature values contribution ratios sum is as mentioned above.
3.2. Principal Component Analysis General Steps
- According to observed data, calculate
and
- By correlation coefficient matrix, it can get feature value R and
 each principal component variance contribution、 contribution ratio and accumulative contribution ratio, p and define principal component reserved number with accumulative contribution ratio as evidence.
Among them, j = 1,2,...,m.
Proceeding with Schmidt orthogonalization, for every λi, solve its basic equations solution
and then let
It can be expressed by  as principal component
or input
and then can be expressed by x1, x2, ..., xm as principal component .
- (4) Input x1 , x2 , ..., xm observed values into principal component expressions, calculate each component value.
- (5) Calculate original indicator and principal component correlation coefficient that is also factor loading to explain principal component significances.
3.3. Principal Component Analysis Result
For dietary habits investigation result, it makes principal component analysis; result are shown in Fig. (1).
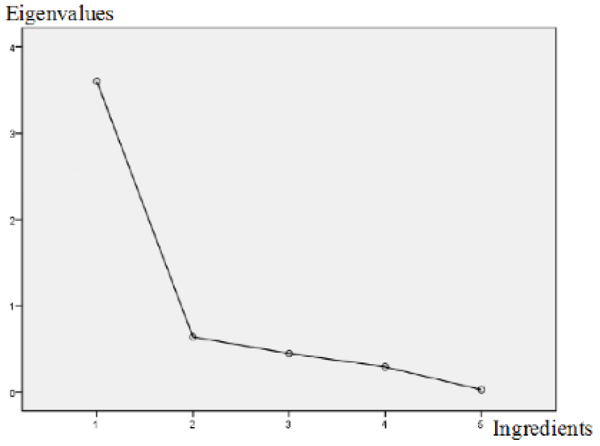
Scree plot.
In Fig. (1), “1” represents cereal intake amount,“2” represents fruit and vegetable intake amount,“3” represents protein intake amount,“4” represents fried food intake amount, and “5” represents sugared beverage intake amount. From the figure, it is clear that cereal intake amount is the principal component in dietary habits, therefore cereal intake is regarded as analysis factor.
Targeting at physical exercises, it makes principal component analysis, and can get Fig. (2).
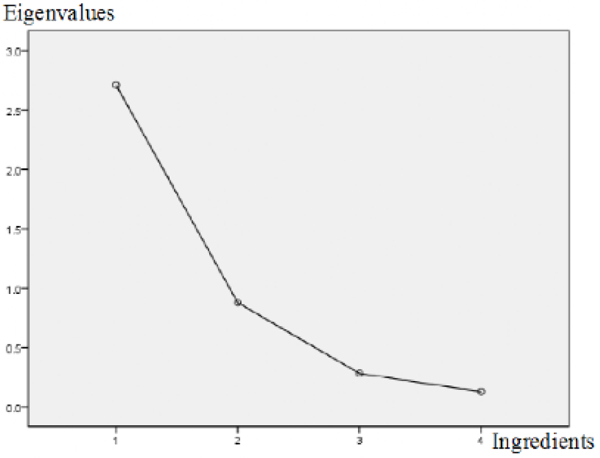
Scree plot.
In Fig. (2), “1” represents strenuous exercises,“2” represents general exercises, “3” represents physical exercises, “4” represents electronic entertainment. From Fig. (2), it is clear that strenuous exercise and general exercise are main factors that affect physical exercises.
In the following, by utilizing neural network model, an evaluation model has been established that targeted at dietary habits and physical exercises.
4. NEURAL NETWORK MODEL
4.1. Neural Network Model Concept
Neural network model is originated from neurobiology. Its computation process is similar to biology nerve cell reaction process. In neural network, lots of different nerve cells contained axon ends that could enter into the same nerve cell Dendron and form into lots of synapses. All synapses of different origins liberative neurotransmitter can exert effects on same nerve cell membrane potential. Therefore, it is clear that with nerve cell space integrated information capacity, a nerve cell can integrate information of different origins input via Dendron. Based on the capacity, people imitate nerve cell reaction process and create artificial nerve cell model as shown in Fig. (3). Symbols description in Figure is shown as Table 3.
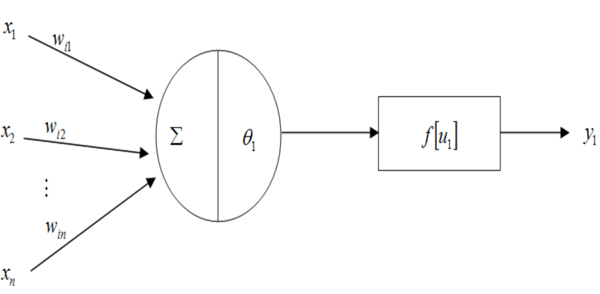
The schematic of mathematical models of neurons.
| Symbol | Definition |
|---|---|
| x1, x2, ..., xn | Nerve cell input part that is information released by previous level |
| θi | Nerve cell threshold value |
| yi | Nerve cell output |
| f[u1] | Excitation function |
f[u1] decides the output form that arrives at threshold value θi under common effects of inputting x1, x2, ..., xn. Fig. (4) shows two kinds of excitation functions images. The paper adopted models with the second kind of excitation function.
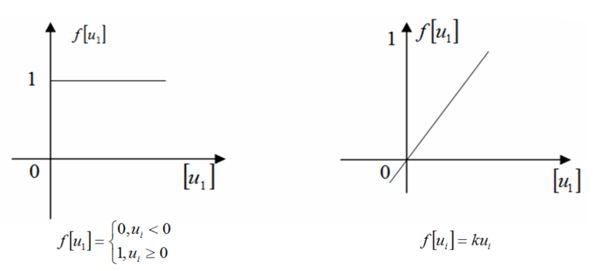
Typical excitation functions.
Among them,

Therefore
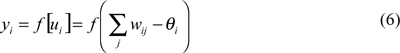
Formula (2) is individual nerve cell full mathematical model expression.
4.2. BP Neural Network Model Computational Steps
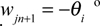
BP Neural network is a kind of multiple layer forward network, which adopts minimum mean square error computation way. In order to apply counter propagation algorithm into feed forward multiple network, utilize Sigmoid as excitation function, and use following steps to make recursion solving on wij that is network weight coefficient. In case every layer has n pieces of nerve cells, such as for the k layer the i nerve cell, then it has n pieces of weight coefficients as follows: wi1, wi2, ..., wjn. In addition, select one more wjn+1 to express θi. When input sample is x, take 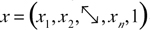 .
.
- 1. Align value to wij. To every layer of wij , align a very little non-zero random number, and meanwhile
 . As the model utilizes Matlab to operate, the alignment process is computer’s random process, and just because of that, same programming codes are used in different running processes; different results may appear.
- 2. Input sample value
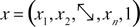 , and corresponding expected output
  .
.
- 3. Calculate each layer output, for the k layer the i nerve cell output xik, it has:

Among them,
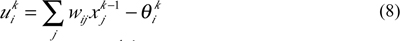
In formula 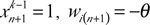
- 4. Solve each layer computation error
 , for output layer, it has k = m, then it has:

For other layers, it has
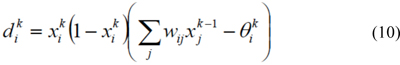
- 5. Correct w ij and θ i, it has

- 6. After solving each layer’s each weight coefficient, it can be judged whether it conforms to the established requirements. If not, then return to the step 3, otherwise, end computing.
4.3. Model Establishment
Regard dietary habits and physical exercises principal components as evaluation objects, dietary habits is taken as vertical coordinate, and physical exercises is taken as horizontal coordinate. According to experiences, set up dietary habits and physical exercises feature values; feature values distribution is shown as Fig. (5).
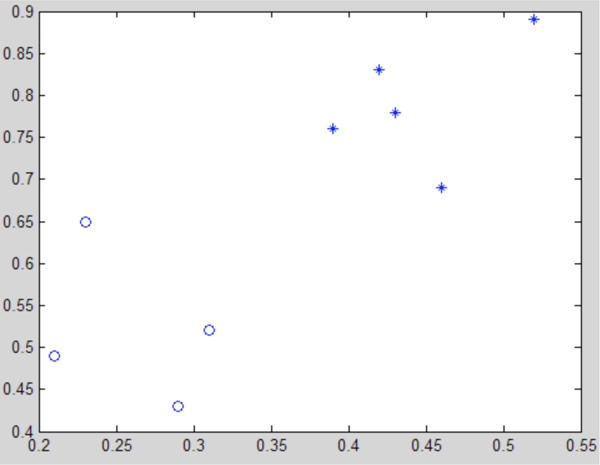
Eigen value distribution.
Input principal component analysis result factor parameters into the model, through Matlab operational calculation, and get Fig. (6).
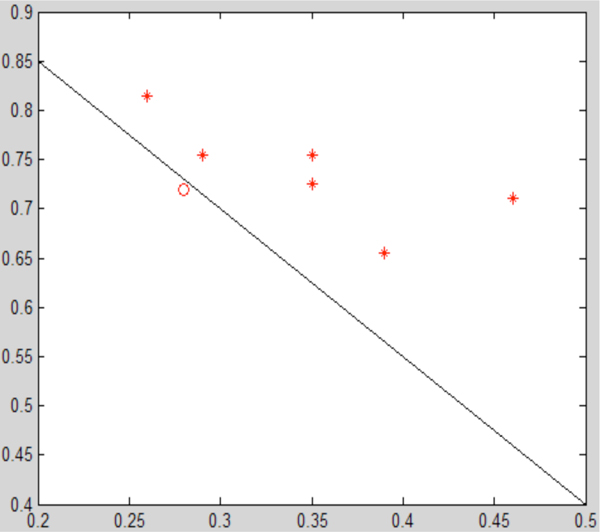
Evaluation results diagram.
CONCLUSION
It is clear from Fig. (6) that Shenzhen is a city of better physical exercises and dietary habits that lies in the lower boundary, but closely linked to the upper boundary. Except for Shenzhen, the rest of six cities- Beijing, Shanghai, Guangzhou, Shijiazhuang, Tianjin and Baotou, could not reach the standard. Therefore, it is clear that physical exercises and dietary habits of people are needed to develop in China.
The paper utilizes principal component analysis approach, takes BP neural network as theoretical basis, and establishes an evaluation model in order to theoretically state the current status of Chinese people’s physical exercises and dietary habits. As far as practical life issues are concerned, it still needs to make specific analysis and take corresponding improvement measures.
CONFLICT OF INTEREST
The authors confirm that this article content has no conflict of interest.
ACKNOWLEDGEMENTS
This work is supported by the Key Project of Guangxi Social Sciences, China (No. gxsk201424), the Education Science fund of the Education Department of Guangxi, China (No. 2014JGA268), and Guangxi Office for Education Sciences Planning, China (No. 2013C108).

