All published articles of this journal are available on ScienceDirect.

The Application of Wavelet-domain Hidden Markov Tree Model in Diabetic Retinal Image Denoising
Abstract
The wavelet-domain Hidden Markov Tree Model can properly describe the dependence and the correlation of fundus angiographic images’ wavelet coefficients among scales. Based on the construction of the fundus angiographic images from Hidden Markov Tree Models and Gaussian Mixture Models, this paper applied expectation-maximum algorithm to estimate the wavelet coefficients of original fundus angiographic images and the Bayesian estimation to achieve the goal of fundus angiographic images denoising. As is shown in the experimental result, compared with the other algorithms as mean filter and median filter, this method effectively improved the peak signal to noise ratio of fundus angiographic images after denoising and preserved the details of vascular edge in fundus angiographic images.
1. INTRODUCTION
As the incidence of diabetes has steadily increased in recent years, there are more and more patients of diabetic retinopathy (DR). DR as one of the most serious complications of diabetes, is currently one of the major causes of blindness, which has the concealed feature of irreversibility. Fluorescein fundus angiography (FFA) has an instructive significance on the early diagnosis and timely treatment of the DR [1-4]. In the collection process of fundus angiographic images, factors like the non-uniformity of light, the imaging effect of fundus camera and the severe interference of noise in the imaging process, such as the internal noise of sensitive components, optical material grain noise, thermal noise, transmission channel interference, quantization noise, caused problems like the declined contrast ratio of fundus angiographic images, the severe interference of noise and image blurring, which influenced the clinical diagnosis. Therefore, the denoising of fundus angiographic images has important practical value in the clinical appliance. Traditional image denoising methods, such as the median filter and the threshold algorithm, would lose quite a little high frequency information in the denoising, which caused the edge blur of images and the missing of detailed information [5-7]. Wavelet transform in the time domain and frequency domain also has good localization properties, Not only will the image structure and texture are represented at different resolution levels, but also it has the ability to detect edge. Wavelet transform could properly maintain the edge and features of details of images at the same time of denoising [8, 9]. Donoho [10] first proposed the wavelet shrinkage method, a method to calculate the universal threshold, which proved the asymptotic optimality of the general threshold. However, the universal threshold used by the method has the tendency of excessive killing of wavelet coefficients. The literature [11] through the establishment of wavelet coefficients Gaussian mixture model, maximized the access to images for a priori information to improve the performance of denoising. Crouse [12] analyzed the wavelet coefficients of clustering and persistence, proposed for hidden Markov tree (HMT) and Gaussian mixture model, and the model is used for one-dimensional signal denoising and classification. Because HMT model can well describe the correlation among wavelet coefficients and the maximum description image prior information, as well as to remove the image noise and maintain a good image edge and details at the same time, it can ensure the performance s(t) improvement of wavelet denoising algorithm. In this paper the wavelet-domain HMT was applied to describe the images and calculate the correlation of wavelet coefficients in neighboring scales [13]; and a Bayesian estimation was implemented to estimate image models, which can help to properly maintain the edge information for images in the process of effective fundus angiographic images denoising. As the experimental result showed, the peak signal noise ratio (PSNR) and the visual quality of FFA denoising images were obviously improved.
2. THE WAVELET TRANSFORM
The wavelet transform refers to the signal expressed with the scaling and translation of wavelet function ϕ(t) and scaling function ϕ(t) respectively as follows [14]:


The signal s(t) can be expressed as:
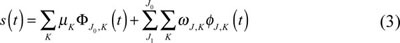
In the formula (3):


In the formula (3): J is the scale, The smaller J the higher the resolution. K is the translation factor. In the practical application, resolution of s(t) is limited. The scope of J
is: J ϵ [J1, J0], J1, J0 ϵ Z.
Fast algorithm of wavelet decomposition can use the tower algorithm, where two-dimensional wavelet transform can be adjusted respectively to one-dimensional wavelet transform rows and columns. Fig. (1) shows the various permutations of the different sub-bands of wavelet coefficients, where L and H respectively expressed low-pass filter and high-pass filter. In addition to the biggest scale and the smallest scale, under this kind of organization, each wavelet coefficients have four child nodes, a parent node, as shown in Fig. (1):
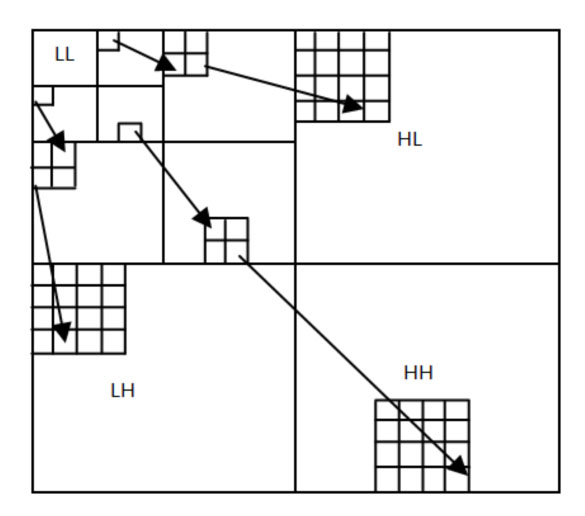
Wavelet coefficients arrangement.
3. THE WAVELET-DOMAIN HMT MODEL
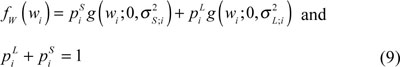
The energy compactness of wavelet transform shows that the most changed images are composed of many small coefficients and a few large coefficients. The number set of large coefficients is the product of probability density function with large variance, while the number set of small coefficients is the product of probability density function with small variance. Thus, the Probability Density Function fW(wi) of every wavelet coefficient wi could be well approximated by Gauss Mixture Model with dual density [14, 15].
Supposing the Discrete Hidden State Si of every wavelet coefficient wi is valued as m = S and L, and there is Probability Density Function pSi (m). Among which, S is the corresponding Gauss state of zero mean and small variance
 , and L is the corresponding Gauss state of zero mean and large variance
 , and
, and
 .
.
Let
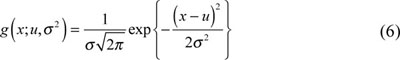
is the Gauss Probability Density Function, then,


the edge probability density function of wavelet coefficient wi can be shown as:
The HMT Model of the image is quadtree structures [16], as is shown in Fig. (2). Each black node stands for a wavelet coefficient, and the white circle connected with the black node stands for the corresponding hidden state, by both of which a node is composed. The relation between Node 1 and Nodes 2-5 is of parent nodes and child nodes, and so is the relation between Node 2 and Nodes 6-9. The link between Node 1 and Node 2 reflects the correlation across scales between wavelet coefficient 1 and Wavelet Coefficient 2, and the link between Nodes 2-5 and Node 1 reflects the correlation inside scales among wavelet coefficients 2-5. The size of wavelet coefficients is greatly dependent on the parent node size. Let the Hidden Status
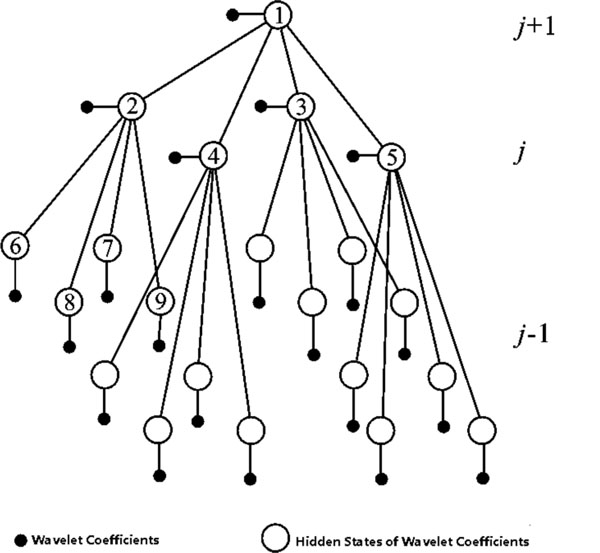
HMT model.
 be a parent-child pair, p(i) be the parent node of Node i, and

be the state transition probability from State m to State m', then the corresponding state transition matrix is:
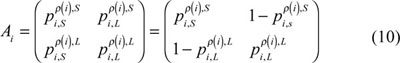
Therefore, the two dimensional HMT Model can be characterized through the mixture of
 and
and
 , the State Transition Matrix Ai, the every i corresponding to every scale, and the probability
 which keeps in a large state in root node.
The HMT Model under the State M could be parameterized through the Probability Quality Function
 of Node Si the conditional probability
 of giving State Sp(i) under the State r, that of Si, under the State m, and the Mean Value µi,m and the Variance
 of Wavelet Coefficient Wi supposing the giving state Sp(i) was under the State m.
All these parameters can be grouped into a parameter Vector as follows:

Among which, P is the number of nodes; M is the state number.
4. THE REALIZATION OF HMT ALGORITHM
In HMT Model, State Si is hidden and the expectation maximization (EM) algorithm is usually adopted to observe wavelet coefficients. EM Algorithm is a kind of iterative algorithm, which can not only estimate the parameter vector, but also the probability of the Hidden State Si [15, 17].
4.1. Model Training
Given a set or more sets of the observed wavelet coefficients
 , the best features of the wavelet coefficients of the wavelet-domain HMT parameter vector υ can be determined. EM algorithm can observe the wavelet coefficients w, and estimate model parameters vector υ and the probability of hidden state S. The EM algorithm for HMT iterative format is as follows:
Choose an initial model to estimate υ0 and let the iterative order l = 0, and then
⊝ Step E, to calculate the joint probability density quality function
 of hidden state variable;
⊜ Step M, to calculate the new model parameter;
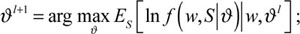
⊛ If υl = υl+1, stop; otherwise, let l = l + 1 and go back to Step E.
M step includes wavelet coefficients as a function up-grade of the mean, variance, transition probabilities, edge state probability mass function
 , and parent-child probability mass function
 .
.
E steps is used to calculate these functions.
 of Wavelet Coefficient w.
5. THE BAYESIAN ESTIMATION OF IMAGE WAVELET COEFFICIENT
Under the Gauss noise with the mean value of 0 and the variance of, the size of the image is, and N is the integer power of the two. After the wavelet transform of images with Scale is accomplished, we obtained the Tree of wavelet coefficient with noise [15, 16, 18]. Then, the relation among the Wavelet Coefficient of images with noise, the Wavelet Coefficient of original images and the Wavelet Coefficient of noises can be shown in wavelet domain as follows:

Use the EM algorithm to fit a HMT model of yi in the observed data wi. If the signal has a HMT probability density function of wavelet domain, then the signal containing noise also has a probability density function. By increasing the zero-mean independent Gaussian white noise ni, each mixture model variance
, is increased by
 while other parameters remain unchanged. Through the wavelet coefficient fitted the observed data of HMT minus the variance due to the added noise, we get the signal wavelet coefficients model.
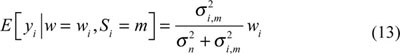
Supposing in Scale L, the distribution of all state variables and wavelet coefficients is the same and so is the state transition matrix of parent and child nodes. Then, under the condition that the State Si of Wavelet Coefficient yi had been known, the conditional mean value could be estimated as follows:
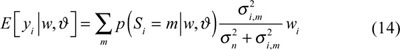
Supposing the wavelet coefficient and the model had been known, Hidden Probability
 could be measured, with which the state probability, and the conditional mean estimation of yi can be acquired as follows:
Finally, the denoised images can be completed by inverse wavelet.
RESULTS AND CONCLUSION
The experimented FFA images were collected by KAWA VX- 3 Ocular Fundus Digital Angiographic Processing System. The study was approved by the local medical ethics committee and each participant signed an informed consent form. With the combination of Gauss white noises with a mean value of 0 and a variance σ = 0.05, it was image decomposed by Daubechies8 Wavelet. The data was handled with the MATLAB2013 Software in the DELL Image Processing Station with a main frequency of 3.4GHz and a memory of 16GB [19-21]. Besides, the denoising algorithms of mean filter, median filter and wavelet soft-threshold were also adopted to perform a denoising analysis of FFA images, and the comparison of results is shown as Fig. (3).
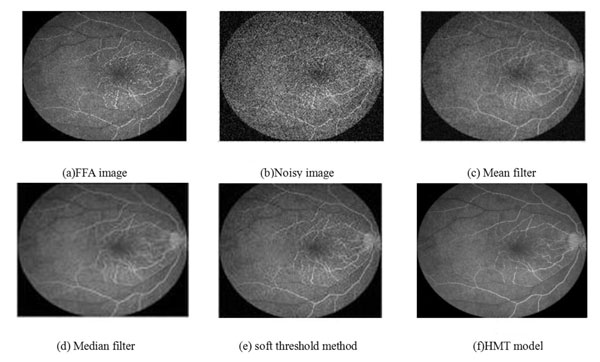
Performance comparison of various denoising methods.
| WGN σ | 0.05 | 0.1 | |
|---|---|---|---|
| Noisy image | 20.1583 | 13.9004 | |
| The traditional method | Mean filter | 23.0227 | 19.5613 |
| Median filter | 25.4856 | 22.4482 | |
| The wavelet method | Soft threshold | 25.8712 | 21.9881 |
| HMT | 28.9977 | 25.8841 | |
The PSNR was adopted to evaluate the effects of image denoising.
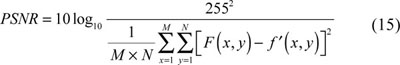
Among which, F (x, y) is the gray value of pixel point for ideal images, f'(x, y) is the gray value of pixel point for denoised images. PSNR reflects the fidelity of noised images; the bigger the value is, the better the protection of details is. Because of the randomness of noise-adding for images, for every method, the calculation was repeated ten times, and the mean PNSR of the results was adopted, as shown in Table 1.
As is shown in experimental results, the algorithm adopted in this paper considered the energy sustainability and aggregation of wavelet coefficients among and inside the scales, which is better than the mean filter and median filter of single scale in denoising medical images. Besides, since the interrelationship between pixel points of images was taken into consideration, its performance is better than wavelet soft-threshold, which can maintain the information details of FFA images to the largest extent and better assist the clinical diagnosis of doctors.
CONFLICT OF INTEREST
The authors confirm that this article content has no conflict of interest.
ACKNOWLEDGEMENTS
This research was supported by the science and technology project of the Education Department of Shandong province (Grant No. J14LK55), and the science and technology project of Taiwan City of Shandong Province (Grant No. 20132104).

