All published articles of this journal are available on ScienceDirect.

Prediction of Bodyweight and Energy Expenditure Using Point Pressure and Foot Acceleration Measurements
Abstract
Bodyweight (BW) is an essential outcome measure for weight management and is also a major predictor in the estimation of daily energy expenditure (EE). Many individuals, particularly those who are overweight, tend to underreport their BW, posing a challenge for monitors that track physical activity and estimate EE. The ability to automatically estimate BW can potentially increase the practicality and accuracy of these monitoring systems. This paper investigates the feasibility of automatically estimating BW and using this BW to estimate energy expenditure with a footwear-based, multisensor activity monitor. The SmartShoe device uses small pressure sensors embedded in key weight support locations of the insole and a heel-mounted 3D accelerometer. Bodyweight estimates for 9 subjects are computed from pressure sensor measurements when an automatic classification algorithm recognizes a standing posture. We compared the accuracy of EE prediction using estimated BW compared to that of using the measured BW. The results show that point pressure measurement is capable of providing rough estimates of body weight (root-mean squared error of 10.52 kg) which in turn provide a sufficient replacement of manually-entered bodyweight for the purpose of EE prediction (root-mean squared error of 0.7456 METs vs. 0.6972 METs). Advances in the pressure sensor technology should enable better accuracy of body weight estimation and further improvement in accuracy of EE prediction using automatic BW estimates.
1. INTRODUCTION
Accurate prediction of bodyweight (BW) and daily energy expenditure (EE) is important for researchers, clinicians and individuals interested in human performance and health, particularly weight management. Weight management programs designed to prevent and treat obesity recommend regular monitoring of BW, restricted energy intake via diet and increased energy expenditure via lifestyle alterations that increase physical activity levels [1]. Individuals who are dieting or have recently undergone bariatric surgery may have significant weekly changes in BW [2, 3]. In addition, children/adolescents who experience growth spurts [4] and pregnant women [5] may also experience significant weekly BW changes. Individuals can monitor BW with an electronic scale. However, a scale may not be well suited for repeated measurement of BW throughout the day (if they are not available at home and work), which has been shown to help prevent BW regain in obese adults [6].
The ability to measure and use BW as an input to energy expenditure prediction equations may improve the accuracy of a weight management device. Bodyweight is one of the major factors contributing to person’s daily energy expenditure [7-9]. Well-known Harris-Benedict equations [10] for basal energy expenditure (BEE) estimation define a linear correspondence between BW and BEE Second, BW affects physical activity energy expenditure (PAEE), which is equal to total energy expenditure (TEE) minus Resting Energy Expenditure (REE) [11]. For weight bearing activities it is generally accepted that there is a linear relationship between BW and PAEE [7, 8]. However, during non-weight bearing activities a body mass scaling exponent of <1.0 (0.5-0.8) more accurately estimates PAEE across individuals of varying body size. As a result, many models for estimation of total EE that use accelerometer, heart rate and other sensors as well as anthropometric characteristics [12-15] use BW to predict REE and physical activity EE. In these models it is assumed that BW is constant. As noted above, a person’s change in BW can be quite significant: with reports of up to 9 kg in a single week [16]. Weekly BW fluctuations can reflect changes in the amount of lean (e.g. muscle) and adipose tissue in the body and affect BEE as well as PAEE. These weekly BW changes may negatively affect the accuracy of within-person EE prediction if using a constant BW value.
Users of a device/system that tracks BW and estimates EE are unlikely to want/need to enter their current, self-reported BW on a regular basis. In addition, the reliability of self-reported BW is generally poor. In particular, people tend to under-report their BW, women to a greater magnitude than men and obese more than non-obese [17-20]. Thus, the incorporation of automatic, objective BW estimation into a wearable system for daily BW and EE monitoring could be very important.
The purpose of this study was two-fold: first, to develop a model for BW estimation by using pressure sensors embedded in the SmartShoe device; second, to assess the effect of replacing actual BW by the estimated BW on the accuracy of energy expenditure, i.e. to investigate the need of using actual BW measurements versus indirect BW estimations in the energy expenditure prediction using the SmartShoe device.
This paper is organized as follows. In section 2 the study protocol and data used in the analysis are described; the model for BW estimation using data from the SmartShoe device is explained; and the model for EE prediction using estimated BWs is described. Section 3 provides the results; section 4 contains the discussion; conclusions are given in section 5.
2. METHODS
2.1. Subjects
Nine adults (three male, six female) participated in the study (Table 1). All subjects were asked to perform a variety of activities while wearing shoes with sensors and a portable indirect calorimetry system. All subjects were healthy and informed written consent was obtained from each participant. The research protocol was approved by the Institutional Review Board (IRB) at Clarkson University, Potsdam, NY where the study was conducted.
Anthropometric Characteristics of Subjects (N=9)
| Variable | Mean ± std | Range |
|---|---|---|
|
|
||
| Weight, kg | 70.5 ± 15.8 | 55-100.9 |
| Height, in. | 66.1 ± 3.7 | 61-71 |
| BMI | 25.2 ± 6.5 | 18.7-39.4 |
| Age | 23.7 ± 4.3 | 18-31 |
| Shoe size | 8.7 ± 1.3 | 7-10.5 |
Four Groups of Activities Performed by Subjects
| Activity Group | Activities within Group |
|---|---|
|
|
|
| Sit | Sit motionless |
| Sit fidgeting | |
|
|
|
| Stand | Stand motionless |
| Stand fidgeting | |
|
|
|
| Walk/Jog | Walk 1.5 mph |
| Walk 2.5 mph | |
| Walk 3.5 mph | |
| Jog 4.5 mph | |
| Walk downhill | |
| Walk uphill | |
| Walk carrying 10% body weight | |
|
|
|
| Cycle | Cycling 50 rpm |
| Cycling 75 rpm | |
Energy Expenditure Prediction Models
| Model | Branch | Sample Size | RMSE, METs | 95% CI for RMSE | Bias, METs | 95% int. of Agreement |
|---|---|---|---|---|---|---|
| BACC-PS [23] | Sit | 17 | 0.2847 | (0.15, 0.42) | 0.096 | (-0.46, 0.65) |
| Stand | 18 | 0.3614 | (0.24, 0.47) | 0.1089 | (-0.60, 0.82) | |
| Walk/Jog | 54 | 0.8093 | (0.59, 1.03) | 0.0030 | (-1.63, 1.64) | |
| Cycle | 18 | 0.8192 | (0.61, 1.00) | 0.2273 | (-1.39, 1.85) | |
| Ave. | 112 | 0.6972 | (0.57, 0.82) | 0.0702 | (-1.32, 1.46) | |
| BACC-PS eWeight | Sit | 17 | 0.3028 | (0.18, 0.43) | 0.1243 | (-0.44, 0.69) |
| Stand | 18 | 0.3938 | (0.27, 0.50) | 0.1343 | (-0.63, 0.90) | |
| Walk/Jog | 59 | 0.8766 | (0.62, 1.12) | 0.1476 | (-1.60, 1.89) | |
| Cycle | 18 | 0.8358 | (0.62, 1.03) | 0.3994 | (-1.11, 1.91) | |
| Ave. | 112 | 0.7456 | (0.60, 0.89) | 0.1824 | (-1.23, 1.63) | |
| Staudenmayer, 2009 [25] | 1.22 | -- | -- | -- | ||
| Crouter, 2006 [26] | -- | -- | 0.1 | (-1.4, 1.5) | ||
| Brage, 2007 [12]* | [0.87,1.11] | -- | -- | |||
* [min,max] interval for walking/running activities from Brage, 2007, using 5th, 6th, and 7th calibration levels, originally given in J·kg-1·min-1 , converted to kcal·kg-1·hour-1 (MET).
2.2. Study Design
Each subject was asked to perform a variety of activities while wearing a portable indirect calorimetry system (Oxycon Mobile, Yorba Linde, CA; weight of 950 g) and the appropriately sized SmartShoe. There were 13 different activities from four groups (Sit, Stand, Walk/Jog and Cycle) that represent various intensities of weight-bearing and non-weight bearing activities (Table 2). Each activity was performed for six minutes and subjects were allowed to rest between activities.
During the fidgeting trials, subjects were allowed to make small, normal leg movements (e.g., crossing legs, shifting weight or turning around). Although we did not control the types of fidgeting movements, all participants were given the same instructions. As a result, fidgeting movements were similar across individuals. All walking/jogging trials were completed on a treadmill.
The actual BW of each subject was taken at the beginning of the study (prior to being equipped with Oxycon Mobile system) by an electronic floor scale (Taylor 5571) accurate up to 150kg with resolution of 0.2kg. The subjects were considered to be BW stable for the duration of 2.5 hour experiment.
2.3. EE Measurement
To determine EE during each trial, the rates of oxygen consumption (VO2) and carbon dioxide production (VCO2) were measured using a portable open circuit respirometry system (Oxycon Mobile, Viasys, Yorba Linda, CA, USA) that was calibrated with known gas concentrations and volumes. For each trial, subjects were allowed four minutes to reach steady state (no significant increase in VO2 during the final two minutes and a respiratory exchange ratio (RER) <1.0). The average VO2 and VCO2 (ml/sec) were then calculated during minutes 4-6 of each trial. Gross metabolic rate (W/kg) from VO2 and VCO2 was calculated using a standard equation [21]. Energy expenditure was then computed from VO2 and RER.
2.4. Movement and foot Pressure Measurement
SmartShoe is a wearable sensor system embedded into both shoes (Fig. 1). Each shoe incorporated five pressure-sensitive resistors (0.5” FSR, Interlink Electronics, Camarillo, CA, USA) embedded in a flexible insole and positioned under the critical points of contact: heel, 1st, 3rd and 5th metatarsal heads and the great toe (hallux) – total of 10 sensors from the two shoes. In addition to pressure sensors, a 3-dimensional ±3g MEMS accelerometer (ADXL335, Analog Devices, Norwood, MA, USA) was attached to the heel of each shoe. All sensors were sampled at 400Hz, averaged to effective rate of 25Hz and sent to the base station via a Bluetooth link implemented by using a Serial Port Profile communication module (RN-41, Roving Networks, Los Gatos, CA, USA). A detailed description of the SmartShoe hardware can be found in [22].
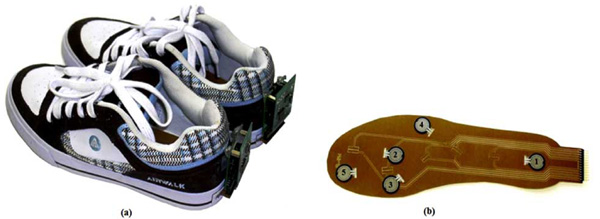
SmartShoe device: (a) Overall view of the shoe device with attached accelerometer, battery and power switch on the back; (b) Pressure-sensitive insole with 5 pressure sensors: heel (1), 3rd metatarsal head (2), 1st metatarsal head (3), 5th metatarsal head (4), hallux (5).
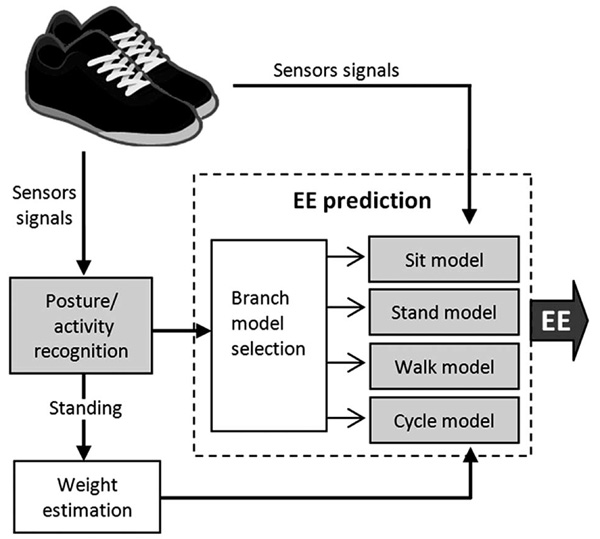
Outline of the method for energy expenditure prediction with estimated weights using Smart Shoe device.
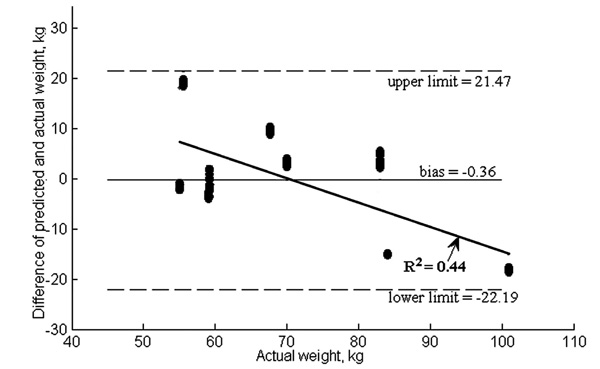
Bland-Altman plot for eWeight prediction with 95% limits of agreement (dashed).
2. 5. Models
The outline of the method for energy expenditure prediction using estimated BW is shown in Fig. (2). The method for EE prediction using estimated BW relies on two previously developed algorithms: a model for posture/activity recognition [22] and model for EE prediction using measured BW and height [23]. The proposed methodology estimated BW from pressure signals during standing episodes and uses estimated BW for EE prediction.
Specifically, each 2 second segment of sensor data is classified as belonging to one of the four activity classes: “Sit”, “Stand”, “Walk/Jog” or “Cycle” [22]. Here walking under various conditions and jogging was considered as a single activity because it is sufficient to know that the subject is performing ambulation. Segments classified as “Stand” are used for BW estimation. The estimated BW together with the sensor signals recorded over 1 minute intervals are used in a branch model for EE prediction. Branch selection is performed by the majority vote of activity classification results over each 1 minute segment.
2.5.1. Model for BW Estimation
BW estimation model relies on analysis of pressure measurements during periods of standing with minimal motion (“quiet standing”). For each subject, the data from the entire study (about 2.5 hours) was processed with a posture and activity recognition algorithm. For each 2s segment classified as “Stand” the average (from left and right shoe sensors) coefficients of variation (cv) for each sensor (including 3 accelerometer and 5 pressure sensors) were computed. Segments with cv below the experimentally determined thresholds (TP for pressure and TACC for acceleration) were considered corresponding to periods of quiet standing. To compute features for BW estimation, the mean pressure values (over each 2 second interval) were computed, after that mean metrics from left and right shoe for the same sensor location were combined as a simple average, resulting in total of 5 metrics (one for each pressure sensor). The driving hypothesis was that mean amount of pressure applied to a sensor under key support points is expected be proportional to the BW during periods of quiet standing. The most significant features were chosen by a forward selection procedure. In the forward selection we used a goodness-of-fit (adjusted coefficient of determination, R2adj) and prediction measures (root-mean squared error, RMSE) using known BW as a criterion.
The BW estimation model was constructed and validated using leave-one-out cross-validation for “Stand motionless” and “Stand fidgeting” postures. Periods of quiet standing during these postures were automatically detected as described above. The BW estimation model was trained on 8 out of 9 subjects and applied to the left-out subject to obtain BW predictions for that subject. The final value for estimated BW (eWeight) for each subject was computed by averaging 30 randomly selected BW predictions. Multiple rounds of cross-validation were performed using different partitions of the subject dataset each having a unique combination of 8 subjects chosen for training and 1 subject chosen for validation.
2.5.2. Energy Expenditure Model Using Estimated BW
A previously reported model for estimation of EE [23] using the SmartShoe device was used without modification. The regression equations can be found in [23]. For prediction of EE measured Weight and log(BMI) were replaced by eWeight and log(eWeight/Height2), respectively. Cross-validation was used to predict each excluded subject’s EE in kcal/min and METs (metabolic equivalents) with the conversion from kcal/min to METs performed by representing the energy expenditure during an activity as a multiple of resting energy expenditure. Energy expenditure during quiet sitting was used as an estimate of resting metabolic rate.
2.6. Statistics
The following performance assessment measures were computed for each prediction model (BW and EE):
RMSE, the root mean squared error of prediction. This error is computed as the square root of the average squared difference between value predicted by model and the measured value V.
- Bias, the mean difference between predicted and measured value V: bias = mean(predV - V).
- Interval of agreement for prediction of energy expenditure in METs, calculated as given in [20]: (bias ± 2·SD(bias)).
Bland-Altman plot analysis [24] was conducted to reveal any systematic pattern of the error (calculated as the difference between predicted and measured values) across the range of measurements and to assess the bias and interval of agreement for prediction.
Pearson correlation coefficient and concordance coefficient are also computed between predicted and measured values to add to the assessment of the accuracy of prediction.
3. RESULTS
3.1. Bodyweight Estimation
Out of the total of 3207 two-second segments classified as standing (with 100% accuracy) from 9 subjects, 1701 were selected as low movement segments using the following experimentally determined thresholds: TACC=0.005 and TP=0.01. This selection resulted in 119 to 257 segments of quiet standing per subject, which were then used in BW estimation model.
Analysis of significance of the pressure sensors data has shown that sensors at the heel and 1st metatarsal head have the most significant predictive power (R2 = 0.39 and R2 = 0.37 respectively). Forward selection of features computed from pressure sensors resulted in the following model: BW,kg = -11.085 + 0.027∙Pressure.heel.mean+ 0.013∙ Pressure. 1st.meta.mean. The equation provides coefficients averaged from fitting 9 models (one for each subject: model trained on 8 subjects was used in prediction of BW for the remaining subject). The model showed a relatively good linear fit, as indicated by the adjusted coefficient of determination, R2adj = 0.66. Prediction performance of BW estimation was evaluated by computing eWeight by averaging 30 randomly selected BW predictions. RMSE values varied slightly depending on a sample but were very consistent with an average value of 10.52 kg and very small standard deviation of 0.09 kg. Pearson correlation coefficient of actual and predicted eWeight was 0.71 and coefficient of concordance of the two measures was 0.65. Bland-Altman plot (Fig. 3) shows that there is a tendency to underestimate BW in the upper range of values as indicated by the increasing negative prediction errors. This fact is also demonstrated by the clear downward linear trend for both predictions (R2 for the fitted line is 0.44).
3.2. Energy Expenditure Prediction using Estimated BW
The predictive performance of model with estimated BWs (Branched model with ACCelerometer and Pressure Sensors using estimated Weight, BACC-PSeWeight) was compared to that of our original Branched model with ACCelerometer and Pressure Sensors (BACC-PS) [23] that uses actual BWs. The results (Table 3) indicate that although BACC-PSeWeight model prediction is less accurate than that of the BACC-PS model, the difference is not very significant.
The performance of the existing methods given in Table 3 is shown for comparison, however, all of these studies differed in the study protocol, characteristics of participating subjects and EE measurement devices. Thus, this comparison may be subjective, although, the fact that BACC-PS and BACC-PSeWeight models produced performance characteristics comparable to those of the existing methods, may imply that the proposed methods perform well.
4. DISCUSSION
In this study we investigated the feasibility of BW estimation using pressure sensors and inclusion of this information in the model for energy expenditure prediction. To the best of our knowledge this is the first attempt to use wearable sensors for automatic BW estimation during normal daily activities and the first attempt to evaluate impact of BW measurement accuracy on prediction of energy expenditure.
Automatic estimation of BW and energy expenditure should have most utility in individuals engaged in weight management programs. In particular, individuals attempting to lose BW may find a system that automatically measures and records BW a useful tracking application and one that promotes continued weight management success. In some individuals, the magnitude of weight loss over several weeks/months is significant. For example, BW loss the year following bariatric surgery may be as large as 67% of excess BW (equivalent to 47.6kg for population reported in [18]). Such significant changes in BW would eventually lead to large errors in EE estimation if one used a pre-surgical BW estimate or infrequently updated BW in an EE monitoring device.
Our results show that the current pressure sensor design allows estimation of BW from automatically recognized periods of quiet standing with relatively high error (root-mean squared error of 10.52 kg), however, they also show the feasibility of the suggested approach to continuous automatic BW estimation during daily activities. We believe that these results can be substantially improved by using pressure sensors that capture full area under the full plantar area rather than a few points used in this study. Extending the sensing area may substantially reduce the measurement error by capturing loading that may not fall on the current sensor locations. Future studies that aim to optimize sensor design for weight estimation are needed. In addition, these designs and estimation models require validation in free-living individuals.
Daily life is full of brief moments of quiet standing. For example, we briefly stand while opening a door, while chatting with a colleague or standing in a checkout line. Thus, given very short time interval (2s) to produce a single BW estimate, multiple measurements can be taken throughout a day and averaged to further improve the estimation accuracy. A question that is yet to be answered in a free living study is how many standing periods can be captured in a day.
The relatively high prediction error for BW estimation did not, however, significantly affect the accuracy of the EE prediction. More specifically, BACC-PSeWeight model with estimated BWs exhibits prediction performance comparable to that of the original BACC-PS model [23]: root-mean squared errors were 0.7456 METs and 0.6972 METs respectively. This may be explained by additional factors that contributed to the model performance: branching and involvement of other predictors (metrics from accelerometer signals) included into the model. Even with automatically estimated BW, the BACC-PSeWeight model is comparable with the existing methods for energy expenditure prediction in terms of the root-mean-squared error, i.e. Staudenmeyer, et al. [25] reported RMSE of 1.22 METs and Brage, et al. [12] achieved RMSE ranging between 0.87 and 1.11 in the comparable experimental settings (5th, 6th and 7th calibration levels). As was mentioned previously, due to the differences in the test conditions, study protocols, studied population and methods for measuring energy expenditure, this comparison is relative. Nevertheless, these results indicate that energy expenditure can be accurately predicted using SmartShoe device without knowledge of the actual BW using only estimates obtained from the BW pressure sensors.
CONCLUSIONS
In this study we showed the feasibility of using wearable pressure sensors for automatic BW estimation and indirect measurement of energy expenditure. Automatic BW estimation can potentially reduce the error of energy expenditure prediction due to underreporting, BW and significant BW changes in certain populations. The results of the study show feasibility of using brief periods of automatically recognized standing posture to estimate BW and use such BW estimates, although BW estimates need an improvement in accuracy. Further improvement of the wearable system will include improved sensor design and free living validation.
ACKNOWLEDGEMENTS
This research was partially supported by University of Colorado Technology Transfer Office Proof of Concept Grant and NIH grant 1R43DK083229.
CONFLICT OF INTEREST
None declared.

