All published articles of this journal are available on ScienceDirect.

Recognizing Anxiety Disorder in Healthy Individuals using ECG and Gait Parameters: Machine Learning Approaches
Abstract
Introduction
The prevalence of mental health disorders such as anxiety, depression, and stress is on the rise. Persistent anxiety adversely affects individuals' quality of life and overall productivity. Early detection employing novel methodologies can enhance the effectiveness of intervention strategies. This study utilized cardio-spatiotemporal features to accurately identify anxiety states.
Methods
Based on the dataset, 22 participants were continuously monitored over a 24-hour period to collect cardiac and locomotor data. Variables such as heart rate, R-R intervals, and step-related metrics were recorded. Subsequently, machine learning techniques—including K-Nearest Neighbors (KNN), Linear Discriminant Analysis (LDA), and Support Vector Machines (SVM) were employed to classify anxiety levels, and the performance of these models was evaluated using cross-validation methods.
Results
In the Fine Tree and Boosted Tree methods, the area under the curve (AUC) outputs were 76% and 80%, respectively, while the other algorithms demonstrated significantly lower accuracy.
Discussion
The findings of this study demonstrated an association between cardio-spatiotemporal features and anxiety states. Furthermore, the application of machine learning techniques provided a robust, balanced approach to classifying anxiety.
Conclusion
This study used machine learning to classify and diagnose anxiety by analyzing both muscle and heart characteristics together. Results showed that both traits indicate anxiety behaviors, with certain models achieving up to 76% accuracy. Future research should check anxiety levels beforehand and improve data collection to distinguish normal heart rate changes from those related to anxiety.
1. INTRODUCTION
In recent years, mental health has become one of the crucial factors in evaluating each person's quality of life. According to the World Health Organization, mental health is a state of well-being in which an individual understands, copes with, and seeks to resolve life’s challenges [1, 2]. Essential topics to consider in mental health include emotions, finances, social relationships, and physical health. If any of these issues arise, it will negatively impact people's mental health. Mental health issues pose a significant threat to individuals’ well-being. Conditions such as stress, sadness, depression, anxiety, and fear can cause harm [3]. Problems may arise at any time in a person’s life and endanger their mental health.
Identifying mental states is a common challenge in enhancing individuals' mental health. Life conditions shape mental states, and the potential for their occurrence can recur repeatedly over many years. Incorrect and delayed identification of mental states leads to a decrease in the quality of life and effectiveness in individuals, making the prospect of their return to normal life less likely. Evaluating anxiety is a crucial factor in early diagnosis, which helps expedite the treatment process [4, 5]. In many cases, the diagnosis of anxiety and stress is not performed correctly, and people are treated inconsistently. Non-standard questionnaires can lead to a misunderstanding of people’s levels of anxiety and stress. Due to the lack of correct and timely diagnosis of chronic stress and anxiety, and the influence of therapists' opinions and cognitive biases, there is an increasing need to develop more up-to-date solutions in the field of diagnosing and classifying mental health issues [6]. Machine learning and supervised learning methods have enabled timely, innovative advances in anxiety recognition. These methods can analyze large amounts of data. Also, according to the relationship between the neuromuscular system and mental states, some data include gait parameters, number of steps, number of long steps, cadence, heart parameters such as heartbeat, the time interval between two R waves, and some no longer used [7, 8].
Recent advances in wearable technologies and machine learning have enabled the examination of physiological and behavioral signals to detect mental states. Electrocardiogram (ECG) and gait parameters have emerged as promising biomarkers that reflect autonomic nervous system activity and motor behavior, respectively. Several studies have demonstrated the potential of ECG-based features, such as Heart Rate Variability (HRV), in the detection of stress and anxiety. Similarly, gait analysis has also been shown to be sensitive to changes in mental states, with parameters such as stride time, rhythm, and acceleration reflecting emotional and cognitive fluctuations [9]. Despite these advances, most existing approaches focus on unimodal data, which limits their robustness and generalizability [10]. Furthermore, there is a lack of comprehensive studies that integrate ECG and gait features for anxiety detection in healthy individuals, especially in real-world settings. Integrating multimodal data at the feature level offers a unique opportunity to improve classification accuracy and reliability, compensating for the limitations of individual methods.
The primary motivation for this research is the critical need to diagnose anxiety using methods that rely on physiological and motor indicators. Traditional approaches typically use questionnaires to evaluate anxiety, stress, and other mental health conditions. However, these methods depend on completing surveys, and sometimes the results can be subjective or inconsistent. In contrast, employing new diagnostic technologies and combining various features and tools enhances diagnostic accuracy and supports more confident decision-making by experts in the field. Given the challenges and limitations of existing diagnostic methods, novel approaches for assessing mental states have been introduced. This study focuses on simultaneously utilizing motor and cardiac data and integrating them at the feature level. Such integration improves the performance of machine learning models and removes the reliance on standard clinical evaluations. Additionally, this approach can serve as a system to assist in accurately assessing the condition of individuals experiencing anxiety.
2. RELATED WORK
In most of the previous studies, researchers have focused on detecting mental disorders such as anxiety and stress, particularly from biological signals. Electroencephalography (EEG) and Electrocardiogram (ECG) are common approaches used to discuss mental disorders. Also, Electromyography (EMG) studies on muscles have demonstrated a significant relationship between the movement systems and neural systems in humans. Pourmohammadi et al. have demonstrated the strong ability of EMG signals to detect multi-level stress. Also, stress detection accuracy at four levels was reported as 100%, 97.6%, and 96.2% using machine learning approaches [11]. Can et al. experimentally investigated stress detection during physical activity and relaxed states using smart bands and machine learning approaches. This study demonstrated that heart rate variability (HRV) and acceleration signals are essential for feature extraction and classification methods. Additionally, the issues related to signal artifacts and low data quality due to tension during physical activity were discussed [12].
Liu et al. [13] have presented a hybrid dimension-reduction feature-extraction approach using 14 methods for emotion detection from EEG signals. The study investigated supervised and unsupervised dimension reduction and compared the two approaches. Nivedtia Patel et al. proposed a compact audio representation using autoencoders for emotion detection. The study used various classifiers, including SVM, decision trees, and CNNs. Also, it has been proven that the autoencoder method enhances overall classification accuracy and ultimately aids in emotion detection [14]. Dalmeida et al. focused on features that can detect stress levels using wearable devices. The study also focused on HRV features.
Additionally, machine-learning approaches have been used for stress detection. The method can be used in all applications that require monitoring stress and anxiety levels in a non-invasive way [15]. In a separate study, researchers investigated the recognition of negative emotions using physiological measures, including electrocardiography (ECG), skin temperature, and galvanic skin response, as objective indicators. Utilizing compression features derived from an auto-encoder approach in conjunction with a Long Short-Term Memory (LSTM) network, the study achieved a notable accuracy rate of 99.4% in identifying negative emotional state [16].
In the study by Sun et al. [17], researchers investigated gait parameters and how mental diseases influence them. They stated that stress, anxiety, and the reduction of self-esteem may reduce gait speed. Also, it has caused variability in step length in humans by amplifying the impact of mental disorders. In studies by Summa et al. and Jun et al. [18, 19], the effectiveness of anxiety, stress, and depression on the walking patterns of physically healthy individuals was investigated. They stated that observing gait parameters with optical and advanced instruments, such as Microsoft Kinect and wearable devices, can help identify mental disorders that affect the musculoskeletal and neuroglial systems. Said Can et al. worked on stress detection in daily life using smartphones and wearable sensors. Indeed, the study has focused on various machine learning algorithms, such as SVM and CNN, to classify and recognize stress levels across environments, including the office, home, and other areas [20]. In another research, Suhaimi et al. focused on emotion detection (happy, calm, scared, and bored) using EEG brainwave signals. They used a low-cost wearable EEG headset to collect data. Virtual reality devices are also used to evoke emotions. Machine learning algorithms such as SVM, K-nearest neighbors, and Neural Networks have been implemented to classify four mental states. They achieve approximately 85% accuracy and demonstrate greater efficiency compared to other studies and similar EEG headsets. They achieve approximately 85% accuracy and demonstrate greater efficiency compared to other works and similar EEG headsets [21].
Machine learning approaches and audio features have been utilized to diagnose mental disorders such as depression, bipolar disorder, schizophrenia, and general anxiety [22]. This research has emphasized that individuals with various mental disorders exhibit distinct voice characteristics, facilitating the low-cost, non-invasive, and remote diagnosis of mental disorders. Another study has focused on the effect of depression, sleep disorders, and anxiety on fall risk factors in older women. They examined gait speed, gait balance, and functional mobility [23]. This research has concluded that depression and anxiety directly affect walking speed and functional mobility. Nemesure et al. have predicted depression and anxiety using electronic health records (EHRs) and machine learning approaches. Subjects were about 1,484, and 59 key extracted features from EHRs. They reached 73% AUC in modeling depression and anxiety, respectively [24]. The study by Al kurdi et al. [25] quantitatively investigates whether machine learning models trained on wearable data collected in controlled settings can effectively operate in real-world environments. Multisensory data, including ECG, EDA, accelerometer, and temperature readings, were collected from students and medical groups in both laboratory and real-world settings. Various machine learning algorithms, including XGBoost, decision trees, and random forests, were evaluated. Results indicated that models such as XGBoost and decision trees maintained high accuracy even under noisy real-world conditions, with features derived from multiple sensors playing a crucial role in their success. Additionally, transfer learning experiments showed that models exhibiting a more balanced distribution of feature importance demonstrated better generalization across diverse environmental conditions. In a separate investigation by Panda et al. [26], a novel fuzzy deep learning method for anxiety detection using ECG signals collected from wearable devices. The method uses a custom VGG-16 neural network that incorporates fuzzy logic in its classification layers to improve accuracy and enable more accurate identification of anxiety levels. After preprocessing the ECG data and converting it into images, the approach uses a publicly available database and achieves its best results with images containing 250 ECG beats, outperforming conventional models with performance metrics including accuracy of 0.95, F1 score of 0.94, and specificity of 0.96. Compared with existing techniques, the VGG-16 fuzzy model shows greater robustness and reliability in automatic anxiety detection.
This study aims to identify anxiety states in individuals by analyzing their motor and cardiac movements. The innovative aspect of this research lies in combining data at the feature level. It includes motion parameters such as step length, step time, and step speed, among others. Previous studies have shown that mental health issues can influence motor movements [27, 28], and there is a consensus that these factors affect stress and treatment outcomes. Therefore, incorporating both cardiac and motor features enhances diagnostic accuracy, making diagnoses comparable to clinical assessments. By integrating data at the feature level, the model can be evaluated more reliably and applied in clinical environments or remote medical diagnostics. In other words, each type of feature compensates for the limitations of the other, which is the key novelty of this research.
3. METHODS
Figure 1 presents the overview of the research.
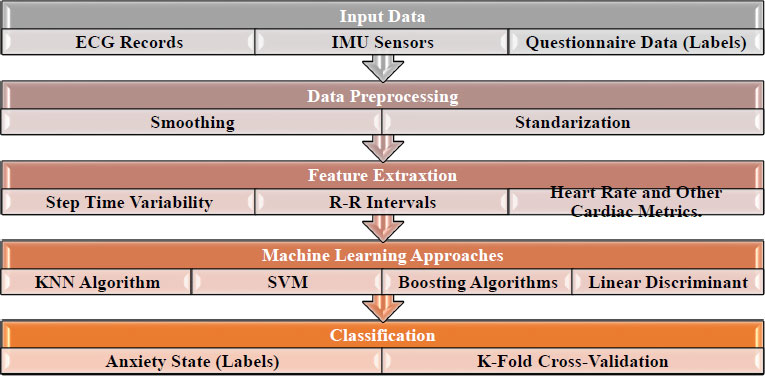
Framework of the study.
3.1. Dataset
This research proposes a new method based on ECG motion features for recognizing anxiety levels. Rossi et al. collected the dataset in the Department of Computer Science at the University of Pisa [3]. It is a public dataset of 24-hour multi-level psycho-physiological responses in young, healthy adults. The multi-level monitoring of activity and sleep in healthy people dataset is used in this paper. The dataset provides inter-beat interval data, heart rate data, wrist accelerometry data, sleep quality index, physical activity, psychological characteristics (e.g., anxiety status, stressful events, and emotion declaration), and sleep hormone levels for 22 participants. The MMASH dataset was released under the Open Database License (ODbL) v1.0 and is publicly available on PhysioNet (https://physionet.org/content/mmash/1.0.0/). The data consists of seven files for each participant, including user_info.csv, which contains the participant’s anthropometric characteristics; sleep.csv, which contains sleep duration and quality; .RR.csv, which contains beat-to-beat data; questionnaire.csv, which contains scores for all questionnaires; activity.csv, which records daily activity; actigraph.csv, which contains wrist triaxial accelerometer data; and saliva.csv, which records cortisol and melatonin concentrations before sleeping and immediately after waking. So, this research has identified specific parameters for recognizing anxiety and stress within this dataset. The research focuses on beat-to-beat data, functional activity data, and scores and questionnaires. The dataset in question included an inadequate number of subjects.
Nevertheless, data collection occurred continuously over 24 hours. From the perspective of the volume of observations, this was adequate to mitigate the risk of overfitting in the machine learning algorithms employed. Furthermore, anxiety levels were assessed throughout the day rather than at a singular time point, thereby providing a more accurate representation of the subjects’ genuine states of anxiety.
3.2. Data Pre-processing
The dataset should be sorted and adjusted before starting the classification of anxiety models, since the recorded data of the subjects spans 24 hours. It is impossible to model mental states with two Motion-ECG factors during sleep because people experience involuntary, brief movements. This issue requires a different approach to data recording. Hence, the participants’ sleep duration is not considered during the feature extraction process. Most subjects also woke up and went to sleep at specific times. The time between 9 a.m. and 9 p.m. is considered the criterion for extracting new features. This dataset was recorded over 24 hours. For example, heart rate data or the number of steps per second were recorded. This has resulted in a large number of observations. To model anxiety, it is unnecessary to examine all observations; the data must be categorized by wakefulness and alertness. This is because the person cannot complete the corresponding anxiety questionnaire while sleeping, and these feelings were measured when the person was awake. Therefore, observations were collected according to a specific pattern, and a new data-collection method was employed to implement machine learning techniques.
3.3. Feature Extraction
Feature selection is a critical component of this study, with features playing a significant role in classifying and identifying stress and anxiety models. The feature selection process was carried out directly without utilizing a specific feature extraction method. Features were chosen based on a pattern, followed by subsequent observations. The table provided outlines the selected features, with a particular focus on anxiety.
In Table 1, the diagnostic features for stress include the time interval between consecutive heart signal waves (R to R) within a one-minute timeframe and the variability in the number of steps this feature undergoes based on individual conditions and physical activity levels. SDNN and RMSDD features were derived from RR data, and each was assigned a weight of 1 for classification and identification of mental states, alongside other pertinent features. A significant concern in the feature extraction phase is data standardization. For instance, the mean step duration across all participants was recorded as under 1 second, while the minimum step frequency was 40 steps per minute. Additionally, there is no correlation between step length and heart rate, which contributes to ambiguity in the dataset. Consequently, data standardization plays a crucial role in the classification and diagnosis of anxiety and is incorporated into the algorithms employed.
| Feature | Time Domain Approach |
|---|---|
| HR | Heart rate number |
| R-R Time | Successive RR intervals |
| Steps | Step per second |
| Average acceleration | Average acceleration in one gait cycle |
| SDNN | Standard Deviation of Average R-R |
| RMSSD | Square Root of Mean Squared Different of Successive R-R intervals |
| Step time | The time between two successive steps |
| Mean of heart rate | The mean of each pair of heart rates |
| Mean of IBI | Mean of R-R intervals |
| Cadence | Cadence = (Step Number*60)/2* Step Time |
3.4. Machine Learning Approaches
3.4.1. K-nearest Neighbors Algorithm
The K-nearest neighbors (KNN) algorithm is a popular and commonly utilized method for recognizing and predicting labeled data. This algorithm falls under supervised learning and is considered non-parametric. In a recent study, anxiety data were used for classification, with the results compared with those of other machine learning techniques. It is important to note that the KNN algorithm can be applied to both regression and classification tasks, though it is primarily recommended for classification. In this investigation, the dataset was normalized before employing machine learning algorithms to identify anxiety and stress patterns.
3.4.2. Support Vector Machine
The SVM technique is a supervised learning approach commonly employed for data classification and regression tasks. It functions as a binary linear classifier that utilizes kernels, such as one-versus-one, one-versus-rest, and Crammer-Singer SVM, to classify non-linear data effectively [29]. This study utilizes multiple variables to categorize anxiety. Specifically, the linear support vector method incorporates a linear kernel function, automatic kernel scaling, standardized size, and the one-on-one approach. Additionally, quadratic SVM, cubic SVM, and all SVMs, as well as optimizable SVM methods, are employed to identify anxiety in the research. The kernel parameters remain consistent across all analyses to ensure standardized data evaluation.
3.4.3. Decision Tree
The decision tree method is a non-parametric approach for modeling the given data. Its purpose is to create a model that predicts a specific value or category based on decision rules and the characteristics of the input data. The rules create a set of paths that resemble a tree with branches, enabling the prediction or classification of data. Some researchers have introduced new methods to optimize the decision tree algorithm, improving the quality of diagnosis. In this research, the decision tree and optimization methods were used. In the Optimizable Tree method, the optimizer automatically selects the maximum number of splits and split criteria. The optimizer used was Bayesian, which specified ten iterations to solve the optimization problem.
3.4.4. Discriminant Analysis
The discriminant analysis approach is a multivariate method used to differentiate between two or more groups of diverse observations. This method involves sharing between groups based on the variable K. Two types of discriminant analysis, Quadratic Discriminant Analysis (QDA) and Linear Discriminant Analysis (LDA), have been utilized in the classification with the DA method. The method has generated a covariance matrix for each class, enhancing flexibility compared to the LAD method. Of course, this research found no significant difference in output between the QAD and LAD methods, which may be attributed to the limited number of classes available for classification. In both techniques, the covariance structure was fully scaled to achieve optimal results in classification [30].
3.5. Ensemble Approaches
The ensemble method is a combined approach to machine learning and data classification. This approach yields multiple models and improves results by integrating multiple methods of the same type. Hybrid methods typically outperform deep learning in terms of complexity, increasing the system's order and modeling time compared to other conventional classification methods. Also, combining methods may be less efficient than one method, which should be checked and evaluated for each problem. This research used SVM and Random Forest ensembles, yielding results similar to those of separate or identical methods.
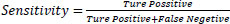
3.6. Performance Metrics
The labels have been specified based on the daily anxiety questionnaires to evaluate the dataset and verify its validity. There are three categories for anxiety states. Certain criteria have been considered to evaluate the proposed method's classification performance. Sensitivity, specificity, and accuracy are the most crucial parameters for evaluating the outcomes of machine learning algorithms (Eqs. 1-4).
 (1)
(1)
 (2)
(2)
 (3)
(3)
 (4)
(4)
4. RESULTS
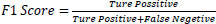
The results of machine learning methods are presented. All the algorithms described in the method section have been implemented, and the best-performing one of each has been reported. Some existing methods do not apply to our problem; however, their stress and anxiety classification results have been determined. Each method is explained, including the confusion matrix, ROC, and error detection diagram. It should be noted that the chosen evaluation method was cross-validation and was consistent across all algorithms. The method is selected with the number 10. This number has been chosen empirically and based on similar studies. Initially, the KNN algorithm was trained on the original dataset. The hyperparameter was constant and set to the default value in the machine learning approach. This means the algorithm had to be trained multiple times, and the best result from each training session had to be selected. Some parameters, such as root mean square error (RMSE), mean square error (MSE), and R-squared, are calculated for each method. Additionally, accuracy and ROC scale were discussed in the Results section. Our classification method achieves an accuracy of about 64.1% using the KNN algorithm for anxiety. Figure 2 presents the confusion matrix and ROC curve for the average label.
Each panel shows the ROC and AUC for anxiety classification. Fine tree algorithm curve, linear discriminant ROC, kernel naive Bayes, Kernel Naive Bayes, and the Boosted Tree AUC figure.
In Fig. (2), several classifications used in the research have been identified, which have contributed to the classification of adjectives. The ROC diagram was determined for the low anxiety category. In Model 1.1, the Fine Tree algorithm was implemented, achieving an accuracy of 76%. It is emphasized that the model's accuracy was evaluated using the cross-validation method and does not reflect the accuracy of the test and training data. It is clearly indicated in Table 2 of the AUC.
| Classifier | Class | Precision (PPV) (%) | FNR (%) | Recall (%) | F1-score (%) | Overall Accuracy (%) |
|---|---|---|---|---|---|---|
| Fine Tree | High | 74.2 | 25.8 | 74.2 | 74.2 | 68 |
| Average | 61.6 | 38.2 | 61.8 | 61.7 | ||
| Low | 56.5 | 43.5 | 56.5 | 56.5 | ||
| Medium Tree | High | 73.2 | 26.8 | 73.2 | 73.2 | 69 |
| Average | 62.7 | 37.3 | 62.7 | 62.7 | ||
| Low | 60.2 | 39.8 | 60.2 | 60.2 | ||
| Linear Discriminant | High | 62.5 | 37.5 | 62.5 | 62.5 | 69 |
| Average | 35.8 | 64.2 | 35.8 | 35.8 | ||
| Low | 43.2 | 56.8 | 43.2 | 43.2 | ||
| Kernel Naive Bayes | High | 70.6 | 29.4 | 70.6 | 70.6 | 75 |
| Average | 53.6 | 46.4 | 53.6 | 53.6 | ||
| Low | 54.9 | 45.1 | 54.9 | 54.9 | ||
| Quadratic SVM | High | 61.5 | 38.5 | 61.5 | 61.5 | 63 |
| Average | 52.9 | 47.1 | 52.9 | 52.9 | ||
| Low | 34.7 | 65.3 | 34.7 | 34.7 | ||
| Boosted Tree | High | 73.3 | 26.7 | 73.3 | 73.3 | 80 |
| Average | 64.2 | 35.8 | 64.2 | 64.2 | ||
| Low | 64.3 | 35.7 | 64.3 | 64.3 |
The Linear Discriminant Analysis method attained an accuracy of approximately 69%. The True Positive Rate (TPR) was 0.95, and the False Positive Rate (FPR) was 0.54. In contrast, the Kernel Naive Bayesian approach achieved 75% accuracy, with a TPR of 0.88 and FPR of 0.53. Using the SVM technique yielded an accuracy of 63%, with a TPR of 0.90 and a notably high FPR of 0.96. The Medium K-Nearest Neighbors (KNN) method in Model 5.2 yielded an accuracy of 68%, with a TPR of 0.68 and an FPR of 0.66. Finally, Model 6.1, which implemented the Boosted Tree method, achieved the highest accuracy rate of 80%, with a TPR of 0.89 and an FPR of 0.48, thereby indicating superior performance relative to the other methods assessed. Figure 3 presents the confusion matrices for the various methods used to classify anxiety.
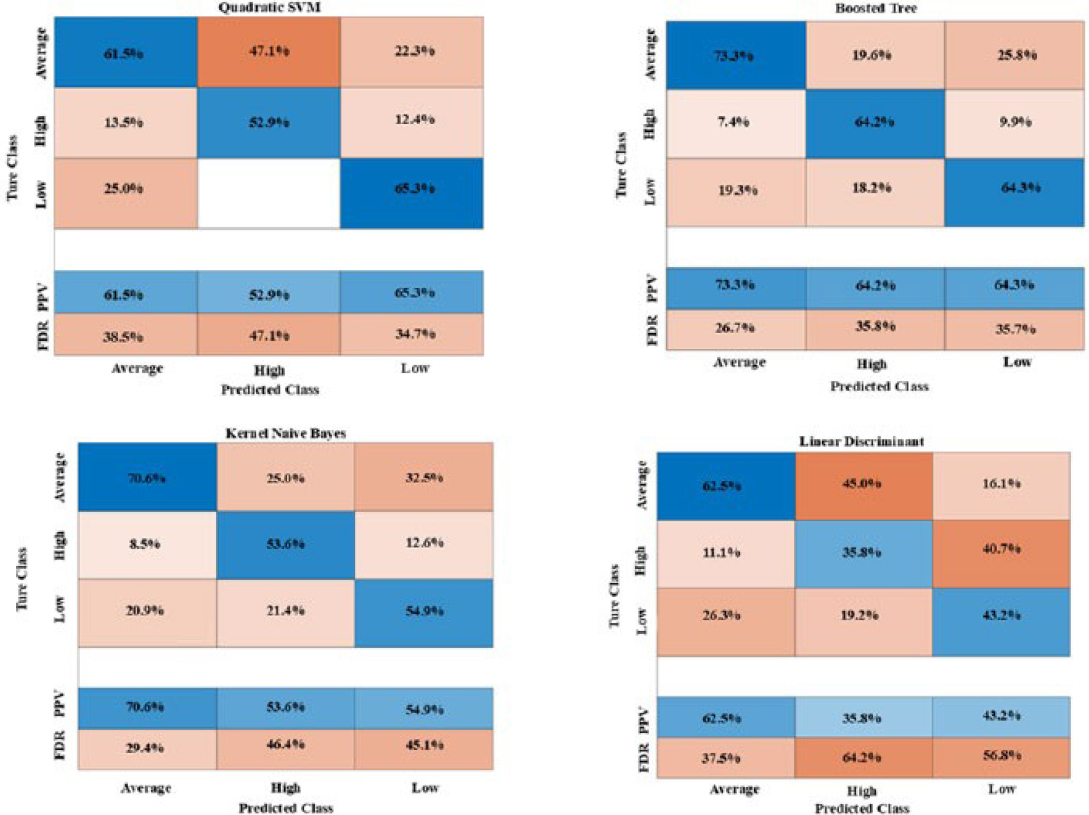
Confusion matrices of the machine learning algorithms for anxiety classification.
Figure (3) represents six classification algorithms are specified. Model 1.1, the Fine Tree algorithm, has achieved 74.2%, 61.8%, and 58.5% accuracy in the medium, high, and low categories, respectively. In the Linear Discriminant algorithm, the average category accuracy is 62%, the high anxiety category accuracy is 35.5%, and the low anxiety category accuracy is 43.5%. In the best-case scenario, the Boosted Tree Algorithm achieved an average score of 73.3, a high score of 64.2, and a low score of 64.3.
Although the current study included a relatively small set of participants, each was continuously monitored for 24 hours, yielding tens of thousands of time-series observations encompassing physiological and behavioral variables. This high temporal resolution generated a comprehensive dataset, enabling the machine learning algorithms to identify patterns from a vast array of independent data points rather than relying solely on a limited number of subjects. As a result, the large volume of observations reduces, albeit does not eliminate, the potential for overfitting commonly associated with studies involving small sample sizes. To further enhance model generalizability and minimize bias toward particular participants or recording sessions, cross-validation and feature selection techniques were employed.
5. DISCUSSION
This investigation employed machine learning techniques and hybrid models to categorize anxiety and stress. Furthermore, these models underwent a cross-validation process to verify their outcomes. The study utilized a 24-hour dataset containing crucial parameters of 10 individuals with no health issues. The dataset aimed to assess psychological conditions like anxiety, stress, and depression, with participants self-evaluating multiple times within a single day. Previous studies have established a correlation between mental states and movement attributes such as walking speed, acceleration, step count, and cadence. According to the available data and the recording of cardiac-motor parameters, the thought of investigating the relationship between anxiety and stress disorders with motor and cardiac parameters was born. Characteristics such as heart rate, time interval between two R waves, time of each heart cycle, and movement parameters were evaluated together in this research.
In machine learning research, the significance of features in enhancing the performance of algorithms is well recognized. This study incorporated gait steps, heart rate, IBI, cadence, and step time. The data underwent standardization and balancing processes. Unusual data points, likely indicative of recording errors, were identified and removed. Through iterative experimentation with various features, it was observed that the inclusion of cadence led to a decrease in accuracy and diminished the model's predictive capabilities across all methods. This insight was gained through a trial-and-error approach, and consequently, the cadence feature was eliminated from the feature vector [31].
According to results from machine learning models for anxiety classification, the Boosted Tree algorithm has achieved the best performance, with an accuracy of approximately 77%. Typically, in cases related to mental disorders collected in the field, there is a possibility of imbalance in a specific category. For example, in this research, 45% of the subjects had average anxiety. Therefore, there is a possibility of overfitting in some models. This method performs anxiety classification effectively, resulting in lower detection errors than other algorithms. In the average category, the proposed model has incorrectly diagnosed 19% of high anxiety and 25% of low anxiety. In the high anxiety category, 9.9% of individuals with low anxiety and 7.4% of those with average anxiety have been diagnosed. In general, the appropriate detection error has been reported based on the number of subjects and the low variance of the features.
Regarding the best classification, the algorithms did not give us all the answers or perform optimally. The quadratic SVM method is one technique that yields poor classification results with high error rates. In this method, classification was performed in a pseudo-binary manner, and the method completely misclassified the low-anxiety category. The wrong diagnosis is evident in this method. For example, in the average anxiety category, about 47% mistakenly classified it as high anxiety. The algorithm in question was not particularly effective in distinguishing between high and moderate anxiety levels. This may depend on the nature of the SVM method and the nonlinearity of the features.
Combined methods have yielded superior outcomes. It should be noted that the dataset was recorded without considering the participants’ prior characteristics or whether they had similar mental states. This similarity has caused the categories to be closely related in the classification of anxiety. A significant finding of this research concerns the ambiguity in the database regarding the subject's engagement in physical activities or movements that may influence cardiac characteristics. Activities such as sports and brisk walking, as well as lifestyle factors like smoking and caffeine consumption, can directly affect cardiac parameters. Therefore, it is advisable to incorporate all of these variables into the data collection process.
Figure (4), represents feature scales were constructed, with the alterations in parameters being assessed through linear estimation. It was observed that the feature of step time exhibited an increase corresponding to a rise in the anxiety scale, while the Cadence scale demonstrated a decrease in relation to the same anxiety scale. Both diagrams illustrate the influence of variations in movement parameters on anxiety disorders to a certain degree. Furthermore, it is important to note that not all relevant features were selected; rather, a limited subset was identified to elucidate the relationship between anxiety and movement parameters. Table 3 shows the relationship between cardio-gait features and anxiety state.
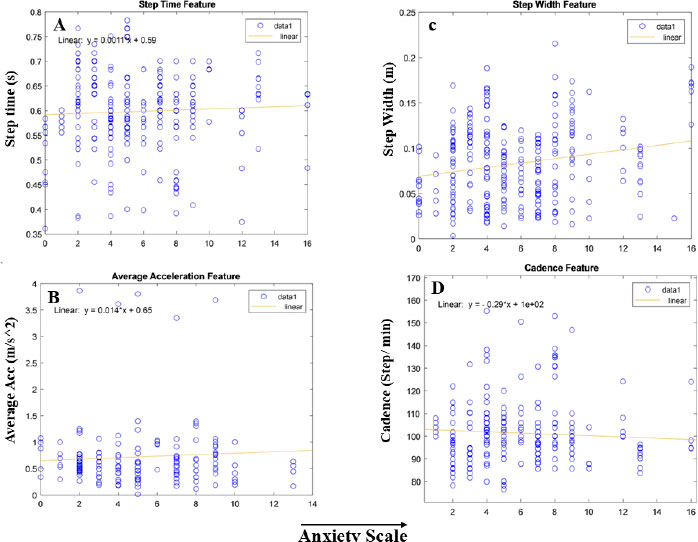
The Feature graph of the anxiety scale is presented. Graph A) illustrates the relationship between Cadence and anxiety, while Graph B) depicts the relationship between Step Width and anxiety. Graph C) shows the relationship between gait acceleration and anxiety features. Graph D) illustrates the step time feature.
| Features | Increasing Anxiety Level |
|---|---|
| Step time | Has increased |
| Cadence | Has decreased |
| Step width | Has increased |
| Average acceleration | Has increased |
| R-R interval time | Has decreased |
| Heart rate | Has increased |
| Average heart rate | Has increased |
Based on the machine learning methods used in this research and their results, we can achieve higher accuracy with the combined and optimal models. This has reduced data dispersion, and the algorithms require less time to process data with numerous observations. This research includes more than 60,000 observations, with certain features, such as cadence, removed to enable algorithms to process the data more efficiently and accurately. When the features are of different types, such as heart rate and step length, one related to the cardiac system and the other to the skeletal system, this introduces more complexity to the model. On the other hand, before selecting the subjects, it is necessary to complete a questionnaire about people's mental states. This prevents the accumulation of subjects in a specific anxiety category, and machine learning methods will have fewer errors when classifying categories.
The study does not elucidate how the proposed approach integrates into real-world monitoring, diagnostic processes, or clinical decision-making frameworks. Nonetheless, the methodology presented holds considerable promise for clinical application through the deployment of wearable devices capable of continuous monitoring of electrocardiogram (ECG) and gait parameters in everyday settings. These devices can unobtrusively capture physiological and motor data, which can then be securely transmitted to healthcare professionals or decision support systems for real-time evaluation of anxiety status. By providing continuous, objective measurements, this system has the potential to complement conventional clinical assessments, facilitating early detection, individualized monitoring, and timely intervention beyond traditional clinical settings. Practical implementation would involve patient-worn sensors, automated data analysis employing machine learning algorithms, and clinician-facing dashboards to aid diagnostic and management decisions. Although further validation across diverse clinical populations and comprehensive usability assessments are requisite, this framework presents a scalable strategy to advance mental health care delivery through minimally invasive, data-driven methodologies.
CONCLUSION
This study utilized machine learning techniques to categorize and diagnose anxiety states, with a focus on examining both skeletal-muscular and cardiac characteristics concurrently for anxiety identification. Previous models typically assessed motor and cardiac behaviors independently. Results indicated that both cardiac and skeletal-muscular traits serve as indicators of anxiety behaviors. The Boosted and Fine Tree models achieved 75% and 76% accuracy, respectively, while the SVM method showed suitable but inconsistent accuracy due to a high error detection rate. Machine learning models demonstrated balanced performance with a substantial dataset. However, as the number of anxiety categories increased, overall accuracy might decrease due to greater difficulty in differentiating between them. To address this, future studies should pre-test subjects for anxiety categorization to prevent database imbalance.
Additionally, deep neural networks have been employed to handle data complexity. When databases are unbalanced, data augmentation or generation methods are recommended to balance the dataset before applying machine learning algorithms. Conversely, a significant limitation of this study is the selection of influential features, which should not be overlooked. For example, if a person performs their daily tasks faster or suddenly engages in normal activity, their heart rate may change. This factor might not be adequately accounted for when analyzing features and combining them with movement data. If the heart rate change is normal and solely due to physical activity, it should not be considered a strong biomarker of anxiety. To address this limitation, future research is recommended to collect data more meticulously, distinguishing between sudden behaviors and stress responses that do not cause genuine anxiety but do affect cardiac parameters. This approach would allow researchers to isolate the true impact of stress on cardiac features. Consequently, machine learning models would be provided with more relevant features, enhancing the study’s realism and facilitating its clinical application.
FUTURE DIRECTIONS AND CLINICAL RELEVANCE
Machine learning models for diagnosing anxiety show promise but need further validation in real-world clinical settings. Future work should focus on testing these models with diverse populations, improving their interpretability, and integrating wearable biosensors for continuous monitoring. Addressing data privacy, environmental noise, and ethical concerns is crucial for successful clinical adoption. On the other hand, there is a clinical relationship between physiological variables and anxiety. According to Figure 4, the biomarker of step time increased slightly with increasing anxiety scale. This means that there is an approximate clinical relationship between increasing step speed and anxiety state. Step width also increased with increasing anxiety scale, indicating heterogeneous gait in subjects. Caution should be exercised in interpreting these results, as the database is relatively small and may not be generalizable to all populations or ethnic groups.
Therefore, a relative clinical relationship can be established between biomarkers and anxiety states. To improve the classification conditions and their accuracy, deep learning and reinforcement learning methods can be used. Networks such as CNN-LSTM seem to be useful. Therefore, this will be considered in future research and continuation of this work.
AUTHORS’ CONTRIBUTIONS
The authors confirm their contribution to the paper as follows: M.S.: Methodology; Y.H.: Investigation; N.M.: Writing - reviewing and editing. All authors reviewed the results and approved the final version of the manuscript.
LIST OF ABBREVIATIONS
| AUC | = Area Under the Curve |
| ECG | = Electrocardiogram |
| HRV | = Heart Rate Variability |
| EEG | = Electroencephalography |
| EMG | = Electromyography |
| LSTM | = Long Short-Term Memory |
| EHRs | = Electronic Health Records |
AVAILABILITY OF DATA AND MATERIALS
All data generated or analyzed during this study are included in this published article.
ACKNOWLEDGEMENTS
Declared none.

