All published articles of this journal are available on ScienceDirect.

Post-Traumatic Stress Disorder Diagnosis using Brain Cellular Resting-State Functional Magnetic Resonance Imaging with Stacked Deep Learning Framework
Abstract
Background
Post-traumatic stress disorder (PTSD) is caused by depression and stress affecting the brain's emotional, memory, and sensory processes.
Materials and Methods
This study investigates a stacked deep learning model for trauma-based PTSD disorder diagnosis using rs-fMRI scans. Twenty-eight individual subjects, fourteen PTSD, and fourteen healthy controls were used, and each subject had 140 Resting-State Functional MRI (rs-fMRI) scans. The selected subjects were assessed to obtain brain activation from twelve brain regions of interest.
Results
The boxplot was used to check the performance of twelve ROI brain regions. Different deep learning algorithms were used for classification through a 10-fold cross-validation approach. This study examines the efficacy of employing a stacked deep approach with two models in the realm of predictive modeling.
Discussion
The objective of the proposed tacking model is to enhance the overall prediction accuracy and durability by using the complementary attributes of each model. The stacked model achieved a 98.30% accuracy rate on the training dataset and 96.60% on the test dataset.
Conclusion
Using the proposed approach, we could detect PTSD at an early stage. The selected ROI regions could also discriminate healthy PTSD from infected regions due to trauma events such as violence, accidents, and terrorism.
1. INTRODUCTION
PTSD is a brain disorder that occurs due to traumatic events. There could be different types of traumatic events in an individual’s life. A person can face traumatic events due to sexual abuse, war, domestic violence, school violence, severe accidents, terrorist attacks, etc., that could continually remind the traumatic events. For example, traumatized children may develop mental health issues such as depression, anxiety disorders, post-traumatic stress disorder, disruptive behavior disorders, obsessive-compulsive disorders, and insomnia [1-3]. It is also directly associated with fear, mental health, and cognitive disabilities. COVID-19 is also a traumatic event that distressed millions of people's mental health. COVID-19 is considered a big traumatic event of the current decade. It also lead to PTSD disorder in humans because traumatic events eventually lead to PTSD disorder. There are many sources that physicians utilize to check brain disorders, such as CT (computerized tomography) scans of the brain, PET (Positron Emission tomography) scans, MRI (Magnetic Resonance Imaging) scans, and fMRI (functional Magnetic Resonance Imaging) scans. These scans can help diagnose the brain disorder, the stage, and the relationship between the brain regions. The fMRI scan type is the best solution to collect or detect the brain activation pattern or activations, such as voxel-wise or region-wise, during PTSD diagnostics [4, 5]. fMRI tracked individuals' brain activity by tracking the changes in cerebral blood oxygenation. It is used for brain regions localizing in cognitive tasks due to its high spatial resolution. It is also used to identify the neural mechanisms of the brain while different activities and mental activities are mediated by the brain [6]. The fMRI also allows the assessment of brain function recovery and guides personalized training in different situations such as traumatic brain injury, rehabilitation of stroke, and neurodegenerative disease.
Similarly, it provides non-invasiveness, repeatability, whole-brain imaging, and a relatively balanced spatial and temporal resolution [7]. The rs-fMRI scans are useful for measuring the relationship between the brain regions and mental status [8]. We used rs-fMRI scans to obtain the brain activation pattern of PTSD and healthy control subjects. Furthermore, using the rs-fMRI scans, we observed the activation pattern in PTSD subjects' brains and healthy control subjects using the most affected brain regions. Literature reports that PTSD affects the hippocampus (HC), Medial frontal cortex (MedFC), insula (INS), Para-hippocampus (PHC), Amygdala (AM), thalamus, anterior cingulate cortex, precuneus brain. However, these brain regions are not affected equally in PTSD patients because the infection or intensity level varies from region to region in PTSD subjects.
1.1. Research Hypothesis
This research aims to ascertain whether the implementation of stacking, which is a learning technique, can enhance the precision of predictions in a stacked model. It is thought that different learning methods can work better together when multiple two models are added to a stacking framework. This makes the system more accurate and resilient while still handling deep, complex connections in the dataset. Stacking is the process of training numerous fundamental models and employing a meta-learner to determine the optimal combinations of their predictions.
As suggested, using methods might help fix the problems with single models, especially when dealing with data that shows complicated or non-linear trends. Moreover, by integrating numerous models, stacking potentially offers a more refined and adaptable methodology for addressing classification challenges. The objective of this empirical study is to ascertain whether stacking with layering exhibits superior performance compared to independent models. This will provide insight into the efficacy of methodologies when applied to predictive modeling. The theory could help classification methods move forward by providing a useful and complex way to make the model more accurate and useful in a wide range of real-life situations if it is true.
Further, this research is divided into four main sections. Section 2 presents the research background, objectives of this research, and main contributions. Section 3 details the proposed methodology, and section 4 presents results, analysis, and comparisons of the recent discoveries in the field. Lastly, section 5 summarizes the research.
2. BACKGROUND
Literature reports several studies that have employed fMRI data using conventional methods to identify the existence of PTSD. However, they have not achieved high accuracy rates. Therefore, the first objective of this study is to determine the brain activation performance level of PTSD in healthy control subjects using the rs-fMRI dataset. Comparing the activation will help determine the performance level or severity of the PTSD disorder in brain regions [9]. The Hippocampus, Para-hippocampus, Medial frontal cortex, and insula exhibited decreased activation patterns in PTSD compared to healthy control subjects. The reduced activation means that the oxygen level decreases in regions, which decreases the performance level of brain activity. PTSD disorder is caused by depression and stress, affects the emotional and memory process, and disturbs the sensory and motor signal transmission process to the cerebral and behavioral effects [10].
Based on the literature reviewed, we observed that HC, PaHC, MPFC, and INS had decreased activation patterns in PTSD than healthy control subjects. In contrast, an increased activation pattern was reported in the thalamus and AM brain regions [11]. Similarly, the precuneus, inferior parietal cortex, and anterior cingulate cortex were the brain regions that showed a decreased activation pattern in PTSD subjects than in healthy control subjects. The amygdala includes information about depression and emotions, and the insula consists of emotional processing. The hippocampus and Para-hippocampus control the memory process. The precuneus provides mental representation for the event, and the thalamus transmits sensory and motor signals to the cerebral system [12, 13]. The MedFC controls the behavioral effects and stress. These are all activity processes controlled by HC, PHC, AM, INS, and MedFC. These activity performances affect PTSD disease due to PTSD disorder more than healthy control subjects. In this research, we focused on six brain regions, such as the hippocampus, Medial prefrontal cortex, insula, Para-hippocampus, Amygdala, and thalamus, to observe the activation pattern and classify the brain regions related to PTSD and healthy control subjects. The classification rate to diagnose PTSD patients from healthy control subjects was not observed precisely in the reported state of the art. Therefore, it is challenging for researchers and surgeons to differentiate brain activation between PTSD and healthy control subjects precisely. In other words, brain regions show negative activation or decreased, and brain regions show a positive activation or an increased activation pattern in PTSD disease than healthy control subjects [14, 15].
PTSD patients were diagnosed using pretreatment and posttreatment scans with 72.5% accuracy using a Support Vector Machine (SVM) [16]. A deep belief network model was created, and a transfer learning technique was used to compare with SVM, and PTSD detection accuracies were attained at 61.53 percent, 74.9 percent, and 57.68 percent, respectively [17]. Different deep learning models were applied to identify post‐traumatic stress disorder from rs-fMRI. They reported the highest accuracy attained by KNN and SVM with radial base function [18]. The brain-sensitive areas in the right, left, and both hemispheres identified post‐traumatic stress disorder from rs-fMRI using three ANN models and attained a classification accuracy of 79%, 93.5%, and 94.5% for each model [19]. The correlation and pre-whitened rs-fMRI data were used to identify PTSD patients and reported a sensitivity and specificity of 93.3% and 95.5%, respectively [20].
The 20 PTSD and 20 HC subjects were used with their rs-fMRI dataset for the classification process. The SVM model obtained a 92.50% accuracy rate, 90% sensitivity rate, and 95% specificity rate [21]. Similarly, the SVM + deep learning model was used to assess the accuracy rate between 91 PTSD subjects and 126 healthy control subjects using the rs-fMRI dataset.The model achieved an 80% accuracy rate of classification with an 80.9% sensitivity rate and a 79.2% specificity rate [22]. Similarly, the relevance vector machine model was also used to access the accuracy rate of 57 PTSD subjects and 59 HC subjects using the rs-fMRI dataset. The model achieved an 89% accuracy rate of classification, 86.5% sensitivity rate and 92% specificity rate [23].
Furthermore, to assess the effectiveness of the models, a combination of VGG16 and EfficientNet was used to diagnose Alzheimer's disease on both balanced and imbalanced datasets. A composite model was created by amalgamating the forecasts of many models; this model extracteddetailed and subtle patterns from the data. A model was created by concatenating the output and input of both models. This model was then enhanced by adding more layers to improve its robustness. In this research attempt, we included a combination of EfficientNet-B2 and VGG-16 to enhance the detection of diseases in their early stages. The studies made use of two datasets that were available to the public. The experimental results showed that the proposed approach obtained a 97.35% accuracy and a 99.64% area under the curve (AUC) for multiclass datasets. For binary-class datasets, the accuracy was 97.09% and the AUC was 99.59%. The suggested solution demonstrated significant efficacy compared to previous methodologies and achieved excellent performance on both datasets [24].
PTSD is predominantly treated with psychotherapy owing to its notable efficacy, nevertheless, medication may be employed singly or in combination with psychotherapy. Furthermore, to reduce the incidence and consequences of the condition, multilevel preventive strategies have been developed to detect the issue during its initial phases and alleviate the adverse health effects on individuals who are already afflicted. While clinical criteria are commonly used for diagnosis, there is an increasing emphasis on identifying reliable biomarkers that can potentially aid in prognosis, diagnosis, or evaluate treatment efficacy. Numerous potential biomarkers have been linked to pathophysiological changes associated with PTSD, which has prompted further research to identify actionable targets [14].
The first objective of this study was to identify the brain region performance of twelve selected ROI of Post-Traumatic Stress Disorder (PTSD) and healthy control subjects using their rs-fMRI scans. The second objective was to build a stacked model to identify the PTSD subjects from healthy control using rs-fMRI scans.
2.1. Objectives of Study
The first objective of this study was to identify which brain region was the most affected by PTSD compared to healthy control subjects using their rs-fMRI scans. We studied the thalamus, Insula (INS), Hippocampus (HC), Amygdala (AM), Para hippocampus (PaHC), and medial frontal cortex (MedFC) brain regions with both hemispheres of the PTSD and healthy control subjects were used as regions of interest (ROI) shown in Fig. (1). The ROI-based region performance checked which brain region shows increased /decreased activation patterns in PTSD subjects than healthy control subjects.
The second objective of this study was to develop a prediction model to classify PTSD subjects from healthy control subjects. In this experiment, we studied the thalamus, Insula, Hippocampus, Amygdala, Para hippo-campus (PaHC), and medial frontal cortex (MedFC) brain regions of the PTSD and healthy control subjects.
The thalamus is in the forebrain and handles sensory information before sending it to the cerebral cortex. It acts as a transfer station. The insula, which is deep in the cerebral cortex, is involved in understanding feelings,
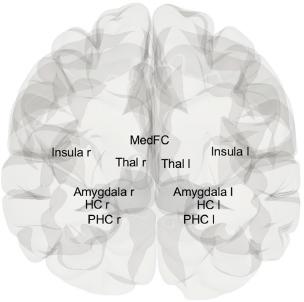
Brain view of selected ROI.
being aware of oneself, and tasting. In the middle temporal lobe, the hippocampus is an important part of the brain for memory development, especially for combining short-term and long-term memories. As it processes emotions and fear reactions, the amygdala in the temporal lobe affects how we remember our feelings. The par hippocampal cortex (PaHC), which is a large part of the hippocampus, helps the brain handle spatial and contextual memories. As part of the executive control network, the medial frontal cortex (MedFC), which is in the frontal brain, also controls how people act in social situations, set goals, and make decisions.
2.2. Main Contributions
The detailed study of rs-fMRI data led to the creation of the suggested model. It used a layered stacked classifier to correctly group PTSD disorders caused by trauma. This approach illustrated the potential of advanced neuroimaging techniques to aid in the early detection and monitoring of PTSD, particularly in times of global pandemic-induced stress.
Hence, this research has the following main contributions.
- This article proposed a novel stacked model to early assist people with post-traumatic stress disorder (PTSD) by looking at specific areas of interest (ROIs) taken from resting-state functional magnetic resonance imaging (rs-fMRI) scans.
- The proposed model could detect PTSD early via selected ROI from rs-fMRI scans.
- The identified ROIs could be utilized as quantitative markers for assessing the severity of PTSD in individuals who have undergone traumatic experiences, especially those associated with the COVID-19 pandemic.
3. PROPOSED METHODOLOGY
This study aims to present an accurate method for detecting post-traumatic stress disorder by employing a comprehensive methodology that includes data collection, preprocessing, model construction, and subsequent performance evaluation. Based on the criteria that were established beforehand, this study included fourteen individuals who had been diagnosed with post-traumatic stress disorder (PTSD) and fourteen healthy controls. The company GE Medical Systems makes axial-RS-fMRI scans, which can be told apart from other scans by their field strength of 3.0 tesla and flip angle of 90 degrees. The matrices 'X' and 'Y' each contain 64 pixels in their respective dimensions. A discovery MR750 MGF and an EP/GR pulse sequence are utilized to execute this process. A width of 3.2813 millimeters is assigned to each individual pixel. Additionally, because each slice has a thickness of 3.299 millimeters, the total measurement of the slices is 5952.0 millimeters. A repeat time of 2900.0 milliseconds and an echo time of 30.0 milliseconds are both present. The dataset was divided into two subsets, training and testing, allowing the model to be trained on many different datasets. A fresh dataset was used to evaluate the model's generalizability by computing the variance values with the Linear Discriminant Analysis (LDA) function. Furthermore, using many key performance indicators is the best way to obtain a comprehensive view of the model's performance. Therefore, the model's effectiveness was evaluated using several key performance indicators, including accuracy, F1 score, precision, recall, area under the curve, and specificity. Fig. (2) shows the flow of work for the proposed methodology.
3.1. fMRI Data Acquisition
The proposed study data consists of two groups, PTSD and a healthy control group, which were obtained from the Department of Defense and Alzheimer’s disease Neuro-imaging Initiative [25]. The data were retrieved after taking access from the DODADNI site on request. The samples of both groups related to axial-rs-fMRI were downloaded for study. PTSD and healthy control subjects (fourteen each) were selected based on the desired criteria for this study. Axial rs-fMRI scans have various properties, including a flip angle of 90 degrees, a field strength of 3.0 tesla, and they are produced by GE Medical Systems.. The Matrix ‘X’ and ‘Y’ are 64 pixels, the mgf model is discovery mr750, and the pulse sequence is EP/GR. The pixel spacing of ‘X’ and ‘Y’ are 3.2813mm, slices= 5952.0, slice thickness is 3.299mm, TE is 30.0 ms, and TR is 2900.0 ms. Each PTSD and healthy control group has 140 scans, and each scan has 48 axial view slices. The ratios of training and testing datasets are presented in Table 1.
3.2. fMRI Data Preprocessing
The raw fMRI data contain various types of noise; therefore, several preprocessing steps are necessary to address these issues.The preprocessing steps, such as slice-timing correction, realignment, normalization, and smoothing, were conducted in MATLAB (2018) using the SPM-12 package. Since the raw fMRI scan slices are not acquired sequentially, a slice-timing correction was performed to address this issue [26]. The head motion of each subject is corrected in the realignment step. The human brain size varies from person to person in our scans, so each brain size scan is normalized with the normalization step. In the last step, smoothing was applied to increase the signal-to-noise ratio or signal sensitivity. The preprocessed scans were further used to model first-level analysis. The first-level analysis categorized the brain activation pattern into PTSD and healthy control groups. The Regions of Interest (ROI) based thalamus, Insula, Hippocampus, Amygdala, Para hippocampus (PHC), and medial frontal cortex (MedFC) brain regions of the PTSD and healthy control subjects were used for the region of interest detection [27]. The brain-activated voxels of ROI were extracted using the “labels_Neuromorphometrics” from SPM-12. The ROI base activation pattern of PTSD and healthy control with an axial-slice view is shown in Fig. (3).
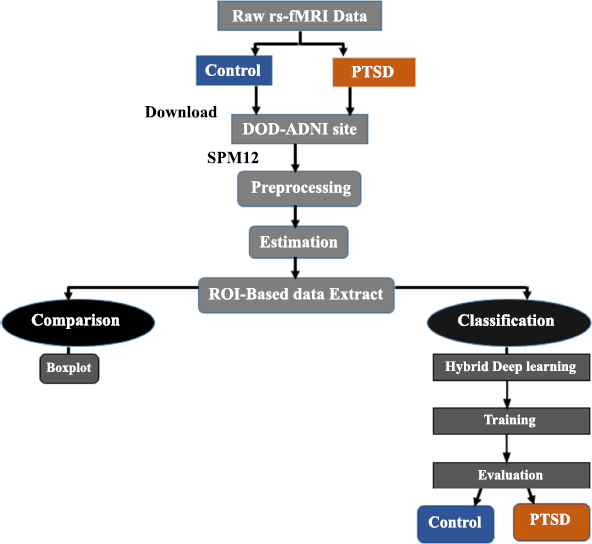
A proposed deep research framework.
| Datasets | PTSD | Control | Total |
|---|---|---|---|
| Training | 1396 | 1348 | 2744 |
| Testing | 611 | 565 | 1176 |
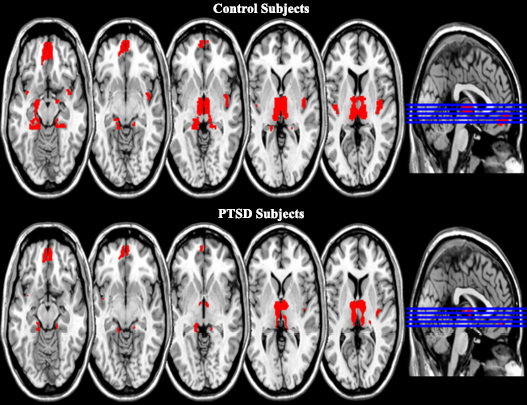
ROI-based brain activation pattern of PTSD and control subjects.
The visual activation pattern alone cannot determine whether a specific brain activation pattern is associated with PTSD or a healthy control subject. In this context, it is necessary to develop an advanced intelligence system to differentiate between the two using voxel values from their rs-fMRI scans. To distinguish PTSD from healthy control subjects, we proposed a stacked deep learning model. Additionally, to discriminate PTSD from healthy control subjects, we proposed a stacked deep model.
3.4. Proposed Research Framework
The LDA is widely used for classification purposes. LDA operates through the calculation of the variance values. The variance values are calculated within and between the classes [28]. The stacked deep model is one of the best approaches for classification and regression problems.
Algorithm 1: Proposed Methodology
Input: PTSD dataset
Start:
Step 1: Data pertaining to PTSD, ensuring that it possesses consistent attributes and labels.
Step 2: Handle missing values and scale features to clean up the data.
Step 3: Choose basic DL models for stacking
Step 4: Choose VGG-16 and DenseNet-121 model to create stake model
Step 5: Extract features from the VGG-16 model
Step 6: Extract features from the DenseNet-121 model
Step 7: Concatenate the extracted features
Step 8: Develop meta model
Step 9: Add a dense layer with 256 units and the ‘Relu’ activation layer
Step 10: Add a 20% dropout rate
Step 11: Add a final dense layer with the ‘sigmoid’ function
Step 12: Train the stacked model
Step 13: Test the trained stacked model
Step 14: Predictions using test data
Step 15: Evaluation
Output: Prediction
End
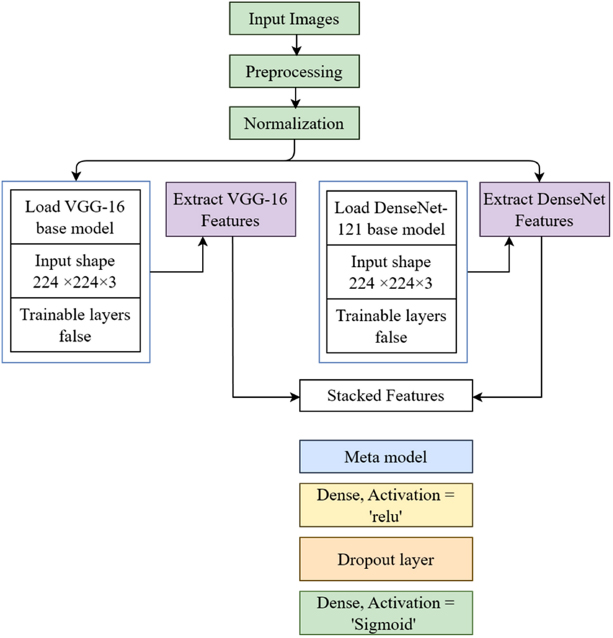
Proposed stacked classifier model.
A stacked model is created by constructing an ensemble that leverages the advantages of DenseNet-121 and VGG-16. In addition, by employing this methodology, many models collaborate to enhance performance. Ensembles typically yield outcomes that exhibit superior accuracy, resilience, and generalizability in comparison to individual models. This article provides a detailed explanation of the principles and procedures involved in model ensemble. Moreover, due to the fact that both VGG-16 and DenseNet-121 are convolutional neural networks, the stacked model that incorporates both of them requires a major integration of their respective designs. The calculation of the average, the arrangement of the features in separate layers, or the combination of features are all methods to accomplish this goal [29]. Fig. (4) presents the proposed model architecture.
The VGG16 is based on 13 convolutional blocks and 3 associated layers, and is considered a highly effective classification network in the field of data science. The proposed dataset samples are utilized for efficient classification. DenseNet121 is based on the same structure as DenseNet, featuring a transition layer and consisting of 6, 12, 16, and 24 layers across four dense blocks. The integration of DenseNet with VGG16 improves accuracy, increases reliability, and enhances feature extraction for classification. Other models may not offer these advantages in our proposed approach.
Model layering is a method in ensemble learning where the forecasts of several base models are combined using a meta-model at a higher level. It makes predictions more accurate when combined with VGG-16 and DenseNet-121 by using the unique features that each architecture gives. Prior to any other considerations, VGG-16 and DenseNet-121 undergo training for a particular objective, such as picture categorization, with a designated dataset. The predictions or outputs generated by these models are then fed into the meta-model. The meta-model, also known as the layering model, is trained using the derived features. This model aggregates or assigns weights to the predictions generated by the underlying models. In order to improve the accuracy and reliability of its forecasts, the sophisticated model evaluates the strengths and weaknesses of each underlying model and makes appropriate adjustments to its parameters. The layering model improves performance and generalization by effectively utilizing predictions from both models. It decreases the probability of overfitting and enhances the precision of forecasts. The utilization of the meta-model as a regularization strategy reduces the impact of noise and inconsistencies that arise from the core models in their separate predictions.
4. RESULTS
The first objective was fulfilled through a boxplot to check the comparison of the selected ROI of PTSD and healthy control subjects. The boxplot visually compares the ROI of PTSD and healthy control subjects. The performance of the ROI-based regions was assessed to identify which brain regions exhibited increased activation patterns, and it showed decreased activation patterns in PTSD subjects compared to healthy control subjects, as shown in Fig. (5). The HC, PHC, MPFC, and INS were the brain regions that showed decreased activation patterns in PTSD than healthy control subjects. In contrast, the increased activation pattern was found in the thalamus and AM brain regions in PTSD subjects compared to healthy control subjects using the rs-fMRI scans.
The second objective was to build a model that can identify PTSD subjects from healthy control using rs-fMRI scans. For classification, we split the data into training and testing parts. The 70% (2744) scan voxels data were used as the training part, and 30% (1176) was used as the testing part. First, selected DL models were individually applied to training data with a 10-fold cross-validation method to check the performance and obtain suitable models for the stacking process. The numerical and mean accuracy rates of 10-fold deep learning are given in Table 2. The mean accuracy rates were found to be 0.932, 0.929, 0.941, 0.498, 0.933, and 0.713 for training data for deep learning.
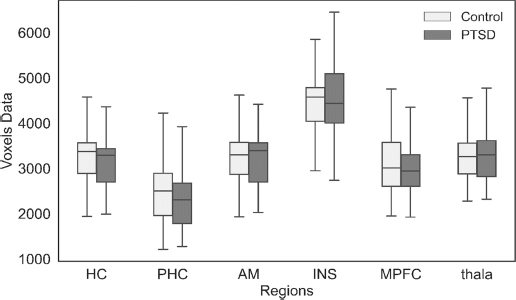
The boxplot compares ROI based on PTSD and healthy control subjects.
|
Models Accuracy |
Folds | - | |||||||||
|---|---|---|---|---|---|---|---|---|---|---|---|
| 1 | 2 | 3 | 4 | 5 | 6 | 7 | 8 | 9 | 10 | Mean | |
| VGG-16 | 0.934 | 0.945 | 0.93 | 0.952 | 0.956 | 0.959 | 0.897 | 0.919 | 0.901 | 0.934 | 0.932 |
| CNN | 0.923 | 0.949 | 0.923 | 0.945 | 0.97 | 0.952 | 0.894 | 0.923 | 0.886 | 0.934 | 0.929 |
| DenseNet-121 | 0.934 | 0.945 | 0.96 | 0.963 | 0.952 | 0.948 | 0.941 | 0.93 | 0.908 | 0.934 | 0.941 |
| MLP | 0.509 | 0.487 | 0.516 | 0.472 | 0.481 | 0.501 | 0.463 | 0.514 | 0.496 | 0.547 | 0.498 |
| MobileNet-V1 | 0.909 | 0.934 | 0.938 | 0.934 | 0.941 | 0.945 | 0.905 | 0.905 | 0.916 | 0.927 | 0.933 |
| NasNetLarge | 0.730 | 0.716 | 0.73 | 0.694 | 0.715 | 0.708 | 0.74 | 0.722 | 0.656 | 0.715 | 0.713 |
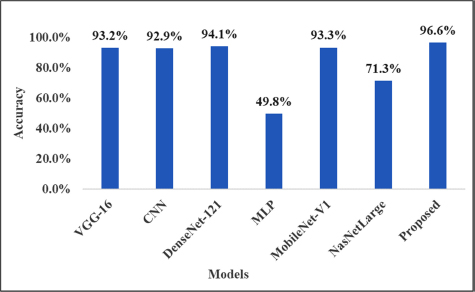
The column graph shows the performance of individual DEEP models and the stacked approach.
| Datasets | Accuracy | Sensitivity | Specificity | FPR | FNR |
|---|---|---|---|---|---|
| Training | 98.30% | 97.60% | 97.10% | 0.043 | 0.028 |
| Testing | 96.60% | 95.10% | 96.20% | 0.058 | 0.047 |
In addition, before stacking, the models did not provide a high accuracy prediction rate with the 10-fold cross-validation method. However, after building the stacked model as a meta-classifier with other classifiers, we obtained the high prediction rate present in Fig. (6). It is clear from the results that the stacked model is best for the experiments to predict PTSD cases using rs-fMRI.
The stacked model was further used to measure the accuracy rate, sensitivity, specificity, FPR, and FNR for training and testing data shown in Table 3. The stacked model achieved a 98.30% accuracy rate for training data and 96.60% for testing data. It was observed that there was no problem of overfitting and underfitting present in the proposed stacked model. Similarly, the model achieved a 97.60% and 97.10% sensitivity rate and 95.10% and 96.20% specificity rate for the training and testing datasets, respectively. The FPR values were reported to be 0.043 and 0.058 for the training and testing datasets, respectively. Similarly, the FNR values were found to be 0.028 and 0.047 for the training and testing datasets, respectively.
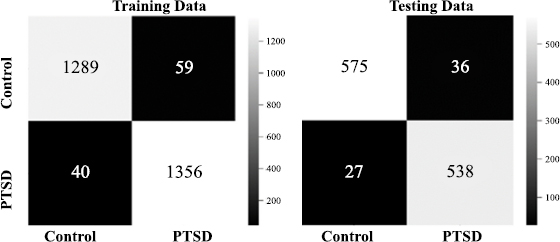
2x2 confusion matrix.
Fig. (7) presents the confusion matrix of the stacked model that was built to check the right prediction and wrong prediction decision of PTSD and healthy control subjects using their rs-fMRI scan’s voxels values. In the 2x2 confusion matrix, the diagonal values indicate the correct prediction, and the off-diagonal values show the wrong prediction through stacking for both the training and testing datasets. An increase in the black-to-white color indicates an increase in classification accuracy. The stacked model correctly predicted the 1289 scans of control and 1356 scans of PTSD subjects out of 2744 rs-fMRI scans from the training dataset. Similarly, the model correctly predicted the 575 scans of control and 538 scans of PTSD subjects out of 1176 rs-fMRI scans from the testing dataset. However, a total of 99 rs-fMRI scan values from training data and 63 from the testing dataset were incorrectly classified.
The receiver Operation Characteristic (ROC) curve presents a high degree rate of sensitivity and specificity. The value of the ROC curve was found to be higher than 0.80, i.e., considered excellent; however, higher than 0.90 was rarely observed. The Roc curve with AUC is presented in Fig. (8). The AUC with the stacking model for the training dataset was found to be 0.99 and 0.97 for the testing dataset. Overall, the AUC of ROC is high and very close to 1.
5. DISCUSSION
Initially, a boxplot was used for the visual comparison of the selected ROI of PTSD and healthy control subjects [31]. The ROI-based region performance examined which brain region exhibited an increased activation pattern or a decreased activation pattern in PTSD subjects compared to healthy control subjects, as shown in Fig. (5). The HC, PHC, MPFC, and INS displayed decreased activation patterns in PTSD than healthy control subjects. In contrast, an increased activation pattern was found in the thalamus and AM brain regions. Decreased activation indicates a reduction in oxygen levels in regions that lower brain activity performance, while increased activation signifies an elevation in oxygen levels in regions that enhance brain activity. PTSD disorder is caused by depression and stress, which affects the emotional and memory process, and disrupts the sensory and motor signals' transmission process to the cerebral and behavioral effects [19, 32]. Notably, the amygdala includes information related to depression and emotions, and the insula includes emotional processing. The hippocampus and Para-hippocampus control the memory process. The precuneus provides mental representation of the event, and the thalamus transmits sensory and motor signals to the cerebral system. The MedFC controls the behavioral effects and stress. The second objective was to build a model that can identify the PTSD subjects from healthy control using rs-fMRI scans. For classification, we split the data into training and testing parts. The 70% (2744) scan voxels data was used as the training part, and 30% (1176) was used as the testing part.
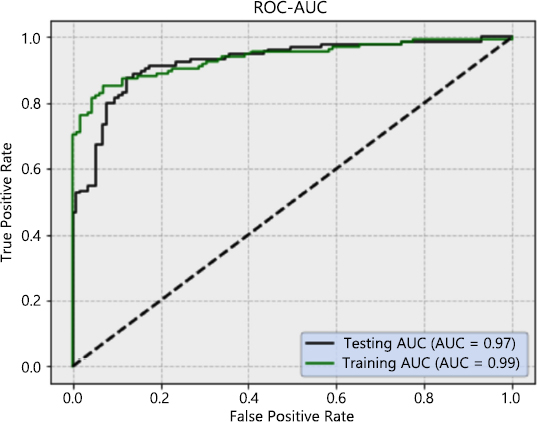
The ROC curves for sensitivity analysis of the stacked deep model.
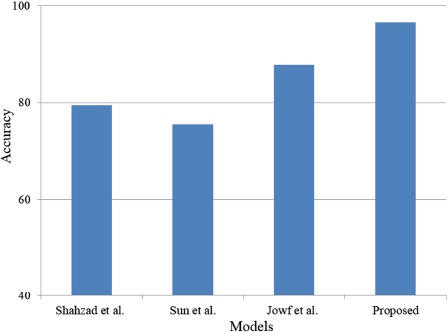
Comparison with state-of-the-art studies.
Overall, the AUC of ROC is very close to 1 and high. The proposed stacked classifier will help detect trauma-based PTSD disorder using the rs-fMRI subjects. Furthermore, by comparing the activation, it will help in determining the severity of the PTSD disorder in brain regions. Finally, the proposed approach can identify PTSD early through ROI detection from rs-fMRI scans. Table 4 illustrates the comparison with state-of-the-art studies. A comparison with state-of-the-art studies is shown in Fig. (9).
5.1. Limitations and Future Directions
A relatively small sample size of twenty-eight volunteersout of which thirteen were PTSD patients and fourteen were healthy controls provided the data for the study. This could potentially impede the generalizability of the findings to a more extensive population. The potential for bias exists in the designation of Regions of Interest (ROIs) from twelve distinct brain regions due to the subjectivity inherent in the selection process.
Concerns exist about the model's generalizability to new and unseen data because it lacks external validation on an independent dataset.Additionally, to ensure that the stacked classifier performs effectively and reliably, future studies should utilize an external dataset collected from a different demographic or clinical context.This will allow the model to be tested in a variety of situations. Further research is needed in various areas, such as enhancing the diversity of datasets, automating the selection of regions of interest (ROI), and integrating multi-modal data.
CONCLUSION
The boxplot provides a visual comparison between the selected region of interest (ROI) in individuals with post-traumatic stress disorder (PTSD) and those who are healthy controls. The ROI-based area performance assessed the differential activation patterns between PTSD individuals and healthy control subjects, identifying brain regions with elevated or decreased activation. In individuals with PTSD, there was a decrease in activation patterns observed in the HC, PHC, MPFC, and INS brain areas, while an increase in activation patterns was detected in the thalamus and AM brain regions, compared to healthy control subjects. Post-Traumatic Stress Disorder (PTSD) is a condition that arises from depression and stress. It impacts the emotional and memory processes and disrupts the transmission of sensory and motor impulses, leading to brain and behavioral repercussions. The DL models, including VGG-16, CNN, DenseNet, MobileNet, and NasNetLarge, were individually utilized for classification. They were applied to the training data using a 10-fold cross-validation approach. The Stacked model which was used as a meta-classifier along with other classifiers, achieves a high prediction rate using the 10-fold cross-validation approach. The experimental findings demonstrated that the stacked model is the most effective approach in our experiment for predicting individuals with PTSD from control subjects based on their rs-fMRI scans. The stacked model attained an accuracy rate of 98.30% on the training dataset and 96.60% on the test dataset. Furthermore, by employing the suggested approach, we would be capable of detecting post-traumatic stress disorder (PTSD) at a more initial phase. The selected regions of interest (ROIs) were capable of differentiating between regions exhibiting healthy post-traumatic stress disorder (PTSD) and those that had deteriorated. Similarly, the sensitivity and specificity rates were also high, and a reduced FNR and FPR from the Stacked model was reported. The AUC with stacking for the training data was found to be 0.98 and 0.97 for testing data. Overall, the AUC of ROC is very close to 1 and high. The stacked classifier will help detect trauma-based PTSD disorder using the rs-fMRI subjects. The comparison of the activation will help to determine the performance level or severity of the PTSD disorder in brain regions. Additionally, the hippocampus (HC), Para-hippocampus (PHC), Medial prefrontal cortex (MPFC), and insula (INS) tests showed decreased activation patterns, and an increased activation pattern was found in the thalamus and Amygdala brain regions in PTSD compared to healthy control subjects.
AUTHOR’S CONTRIBUTION
T.J.A., H.A., A.A., N.A.: Study conception and design; AR: Data analysis and interpretation of results; B.A.G: Draft manuscript.
LIST OF ABBREVIATIONS
| PTSD | = Post-traumatic stress disorder |
| rs-fMRI | = Resting-State Functional MRI |
| HC | = Hippocampus |
| MedFC | = Medial frontal cortex |
| INS | = Insula |
| PHC | = Para-hippocampus |
DATA AVAILABILITY STATEMENT
Data used in preparation of this article were obtained from the Alzheimer’s Disease Neuroimaging Initiative (ADNI) database (adni.loni.usc.edu). As such, the investigators within the ADNI contributed to the design and implementation of ADNI and/or provided data but did not participate in the analysis or writing of this report. A complete listing of ADNI investigators can be found at: http://adni.loni.usc.edu/wp-content/uploads/how_to_apply/ADNI_Acknowledgement_List.pdf
FUNDING
This research is funded by Princess Nourah bint Abdulrahman University Researchers Supporting Project number (PNURSP2024R513), Princess Nourah bint Abdulrahman University, Riyadh, Saudi Arabia.
ACKNOWLEDGEMENTS
This research is supported by Princess Nourah bint Abdulrahman University Researchers Supporting Project number (PNURSP2024R513), Princess Nourah bint Abdulrahman University, Riyadh, Saudi Arabia.
The authors would also like to acknowledge the support of Prince Sultan University, Riyadh, Saudi Arabia, for supporting this publication.

