All published articles of this journal are available on ScienceDirect.

MRI Brain Tumor Segmentation using Cuckoo-based Dimensionality Reduction and Ensemble Convolutional Neural Network
Abstract
Background
Brain tumor identification at an early stage is a challenging task that increases the lifetime of patients. Specialists' conclusions on recognizing brain tumors are difficult, as they are based on their theoretical knowledge. It takes a huge amount of time to diagnose the patient. Recently, research has suggested an automated technique that is dependent on convolutional neural networks. Medical pictures are a set of accumulations of data that are hard to store and process, expending broad registering time. The decreased infiltrated systems are normally utilized as an information pre-preparing venture to make the picture information less mind-boggling with the goal that high-dimensional information may be recognized by a fitting and apt low-dimensional portrayal.
Objective
This study proposes an optimization-based dimensionality reduction and brain tumor segmentation using ensemble convolutional neural networks in MRI images to enhance disease diagnosis and extend healthcare accessibility.
Methods
Cuckoo-based dimensionality reduction and Ensemble CNN are proposed to segment the tumor region . The cuckoo-based optimization search technique is used to reduce the dimensionality of MRI Brain Images to perform better segmentation. The proposed technique is evaluated on the BRATS database, which contains two datasets: the Leaderboard and Challenge datasets. The outcomes are estimated utilizing the Dice Similarity Coefficient (DSC), Positive Predictive Value (PPV), and Sensitivity.
Results
The Experimental analysis shows promising results on the leaderboard dataset and the BRATS Challenge dataset. The proposed method outperformed the leaderboard dataset with a greater 91% Dice Similarity Coefficient (DCE), 95% Positive Predictive Value, and 87% Sensitivity of High-Grade Glioma (HGG). Seventy-two percent Dice Similarity Coefficient (DCE), 70% Positive Predictive Value, and 93% Sensitivity of Low-Grade Glioma (LGG). 88% Dice Similarity Coefficient (DCE), 90% Positive Predictive Value, and 91% Sensitivity of combined High-Grade glioma and Low-Grade glioma. For the BRATS Challenge dataset, the proposed method provides a 92% Dice Similarity Coefficient (DCE), 93% Positive Predictive Value, and 95% Sensitivity of High-Grade Glioma (HGG). 86% Dice Similarity Coefficient (DCE), 88% Positive Predictive Value and 93% Sensitivity of Low-Grade glioma (LGG). 85% Dice Similarity Coefficient (DCE), 89% Positive Predictive Value, and 92% Sensitivity of combined High-Grade glioma and Low-Grade glioma.
Conclusion
In this study, MRI Brain tumor segmentation using Cuckoo-based dimensionality reduction and Ensemble Convolutional Neural Network is proposed. The cuckoo search algorithm used for dimensionality reduction is performed in MRI images to reduce the dimensions. We also compared two of the existing methods with our proposed method. The leaderboard dataset and challenge dataset have been discussed. The challenge dataset for HGG provided good results in terms of dice similarity coefficient and positive predictive value. The sensitivity alone gets reduced when compared with the CNN and random forest methods. Experimental analysis shows promising results on the leaderboard dataset and the BRATS Challenge dataset.
1. INTRODUCTION
A growth or expansion of abnormal tissue that can be distinguished from the surrounding tissues by its structure is referred to as a tumor or neoplasm. A tumor is a mass of tissue whose growth becomes nearly completely uncontrolled, especially regarding the forces that direct and oversee its progression. The development of a tumor within the skull frequently interferes with mental function. Malignant growth, which accounts for about 13% of all fatalities worldwide, may be brought on by a tumor. It is a notable cause of death. A significant fraction of the existing standard conclusion procedure relies on human involvement in interpreting an MRI test for the judgment; undoubtedly, this increases the risk of incorrect recognition and the identifying evidence of a brain tumor [1].
Brain tumors are one of the foundations for the expansion of analyzing mortality amongst youngsters and grown-ups. It is fundamentally a deformed development of cells inside the brain that are likely to be destructive. Brain tumors are one of the most life-threatening diseases in humans; hence, tumor prediction must be accurate and efficient. This can be accomplished by the execution of robotized tumor recognition procedures in pictures. Gliomas are very diffusely infiltrative tumors that affect the surrounding brain tissue. Glioblastoma is the most malignant type, while pilocytic astrocytomas are the least malignant brain tumors [2].
In general, the standard system for determining brain tumors is through the process of reverberation imaging. MRIs are essentially a non-obtrusive system, which provides the basis to analyze and study tissue differentiating and is generally accessible in facilities. MRIs make it conceivable to deliver particularly unique kinds of tissue-based differentiating by shifting excitations as well as through reiteration times, making it a form of flexible apparatus for distinctively determining intriguing imaging structures. The brain's architecture, the tumor's size, and its area were all visible on an X-ray. MRI and X-rays utilize radio frequency, and aspects of magnetic-based qualities, resulting in the identification of pictures of the human body without ionized radiations. Imaging assumes a focal role while concluding brain tumors. Currently, there are several clinical diagnoses, and distinctive MRI groupings are utilized for the analysis and outline of tumor compartments [3]. Furthermore, MRI is classified into various tissues such as White Matter (WM), Gray Matter (GM), and Cerebrospinal Fluid (CSF). In managing MRI pictures, a standout amongst the most difficult issues is to fragment tumors since tumor shows up in various sizes and in various forces. Furthermore, due to the complexity of the brain's structure, brain tumor segmentation is challenging. Image restoration addressed rebuilding, including mathematic morphology, watershed segmentation, consolidated grouping, and characterization components, which were used in this case. It has also been suggested that an information model of the MRI images should be created. It was performed at the cuboid level to determine the various pieces of information. These arrangement techniques allow for greater support and allow for the proper treatment of MRI images. To change or identify tumors from images, the Multi-Modality Framework consists of a few components and then examines the MRI and CT filter images. The problem of brain regions being influenced by various knowledge techniques is addressed by the half-and-half algorithm. With 110 anomalous and 62 typical key MRI images under examination, the various leveled self-organizing map achieves a precision of 92.41. The global thresholding of the images is performed using Scalp EEG and Modified Wavelet-ICA. Moreover, tumors and related issues are identified from MRI Images. The PCA or Principal Component Analysis Reconstruction strategy has been deployed for CT Scans and MRI databases, which takes care of the issues related to the assessment and investigation of information and the basic leadership process. The information gathered from the information conveyed forms the basis for the study and provides coordinated information, which is utilized with other information for examination reasons at that point and helps in the process of obtaining substantial and pertinent data from databases [1].
In addition, to take care of this issue, as of late, tumors can be divided as being those that are either engendered physically or naturally. Manual segmentation is a costly, tedious, and dull task. Programmed identification of tumors encourages doctors to discover injuries more precisely [4]. In this article, the programmed segmentation is performed, dependent on ECNNs, also known as Ensemble Convolutional Neural Networks. The decrease in dimensionality for the MRI pictures depends on the cuckoo seek calculation. At a point wherein the measurement diminishes, the segmentation expands. The proposed technique was evaluated on the BRATS database, which contains two datasets: the Leaderboard and Challenge datasets. The outcomes are estimated utilizing the Dice Similarity Coefficient (DSC), Positive Predictive Value (PPV), and Sensitivity. This work is organized as follows: a literature review is detailed in Section 2, the proposed philosophy is clarified in Section 3, results and discussion are analyzed in Section 4, and lastly, the conclusion is examined in Section 5.
2. LITERATURE REVIEW
Lisboa et al. [5] examined the blend of an Artificial Neural Network (ANN) classifier, a component choice process, and an innovative approach to a strategy of dimensionality that gives an information projection to representation and safeguards the class separation accomplished by the classifier, is connected to the examination of a global, multi-focus 1H-Management Research Services (MRS) database of brain tumors. When combined, it results in both instinctively interpretable and extremely exact results. The strategy overall remains sufficiently straightforward to permit its simple mix in existing medicinally-based supportive networks.
Zacharaki et al. [6] examined the utilization of example-based arrangement strategies for recognizing distinctive sorts of brain tumors, for example, essential gliomas from metastases, and to review gliomas. The proposed plan comprises of a few stages, including defining the region of interest and highlighting extraction, choices, and grouping. The highlighted aspects incorporate tumor shape and power qualities, just as pivot invariant surface highlights. Feature subset determination is carried out by utilizing bolster vector machines with a recursive component end.
According to Kharrat et al. [7], brain tumors can be successfully identified from cerebral MRI images. Their approach comprises three stages: improvement, segmentation, and order. To enhance the nature of pictures and limit the danger of particular areas, a combination of the segmentation stage and an upgraded procedure is connected. Additionally, numerical morphology has been deployed here to draw the difference in MRI pictures. At that point, the Wavelet Transform is connected to the segmentation procedure to break down the MRI pictures. Finally, the k-implies calculation is executed to separate the suspicious locales or tumors. Some of the trial results on brain pictures demonstrate the achievability and the execution of the suggested technique here.
Ratan et al. [8] developed a brain tumor segmentation-based strategy and approved the segmentation based on the 2D and 3D MRI Data. The segmentation results are represented and subjected to quantitative evaluations, which demonstrate the suitability of this methodology. After identifying the tumor manually, it was examined if it would be possible to use MRI data to improve mental tumor shape guesses as well as a 2D and 3D perception for meticulously arranging and inspecting the tumor. Currently, careful arrangement uses both 2D and 3D models to coordinate data from diverse imaging modalities, each containing at least one aspect of morphology or a unique set of capabilities. Initially, the focus of the study was on configuring the tumor's territory for a single cut of the MRI data collection. Later, the work was broadened to include determining the tumor's volume using several picture MRI informational indexes.
Badran et al. [9] suggested a PC-based method to identify brain tumors using Brain MRI images. Before further putting order into those tumors that are either benign or threatening, the brain is first grouped into a healthy brain or a brain that has a tumor. The NN approach combines pre-handling, picture segmentation, highlight extraction, and picture order projects. Finally, the locality of curiosity method is used as an affirmation stage to designate the tumor zone. To test and review the suggested calculation, a MATLAB GUI, or Graphical User Interface program has been constructed that is simple to comprehend and analyze.
El-Dahshan et al. [10] have briefly exhibited a half-breed strategy for the characterization of attractive resonance-based images and pictures (MRI). The proposed method has three phases: highlight extraction, reduction in dimensionality, and characterization. An important phase of the proposed method is to identify the tumor region-based Discrete Wavelet Transformation (DWT). In the next phase, the highlighted attractive resonance-based images and pictures have been reduced by deploying PCA. In the order organized, two classifiers have been created. The resultant outcome here clearly indicates that the proposed procedure optimizes its robust features and is effective in contrast to the recent work and studies conducted here.
Karpagam and Gowri [11] examined and presented an approach that helps in distinguishing the volume of brain tumors by deploying the breadth and chart-based strategy used to calculate the volume. The chart is dependent on pixel esteem, taking into consideration different concentrates from the tumor cells that are in the affected area's first position. Then, the influenced locale is considered oval, and the volumes are based on the same. In this framework, the mean is found from the volumes that have been developed in the influenced area. The trial results demonstrate that brain tumor development and volume may be estimated using a diagram and distance across the deployment of the effective strategy here.
Kharat et al. [12] suggested two Neural Networks know the characterization of the Brian MRI Images. The strategy used here that deploys the Neural Network comprises three phases, specifically feature extraction, reduction in dimensionality, and order. During the primary stage, acquired highlights related to MRI pictures are examined by deploying the DWT. The second stage highlights of the MRI have been diminished by deploying the PCA to address the more essential highlights. The acknowledgment of the related objects and picture grouping is increasingly vital as it forms the basis for abnormal state handling, such as brain tumor characterization for picture segmentation. Both feed-forward (cooperative) and input (auto-affiliated) systems can be created using these technologies.
Madhusudhana Reddy and Prabha [13] presented a Brain tumor discovery and characterization framework. The framework utilizes picture handling and neural system strategies to identify tumors and to order the sort of tumor. The histogram balance, picture change, and thresholding capacities are utilized for the identification of tumors. BW mark work is utilized to ensure the centroid of the tumor is protected. The expanded administrator is additionally used to determine the limits of the tumor look proceeds. Neural system techniques are utilized to arrange tumors in MR pictures. In the neural system, the back engendering technique is utilized. Preparation and pre-processing of the two-layer feed-forward system are carried out using backpropagation to facilitate the process of characterization of tumors.
Introduced in a very novel and innovative manner in their study, Rameshwar et al. [14] introduced effective procedures for the grouping of attractive reverberation mind pictures. Their strategy comprised two phases. In the principal stage arrangement, distinct wavelet change is utilized to decrease dimensionality and highlight extraction. The characterization is performed during the second stage while utilizing the probabilistic neural system. The deployment of the classifier helps to order genuine MR pictures as non-cancerous or benign as well as carcinogenic or Malignant. PNN, or the Probabilistic neural system, along with the picture and information handling technique, has been utilized to execute a robotized brain tumor order. The utilization of procedure deploying artificial intelligence has appeared to be quite productive and potentially effective for this particular study.
A key and specific programmed segmentation strategy dependent on CNN was suggested by Pereira et al. [15] that deploys the investigation of parts that are little and are 3 ×3. Gliomas are mostly well-known and known to be aggressive among brain tumors, which results in a comparatively short lifespan. Here, the vast spatial and auxiliary inconstancy amidst brain tumors makes programmed segmentation an issue that pertains to testing.
Chithambaram and Perumal [16], to facilitate further research and study, presented one programmed brain tumor location strategy to expand the exactness and yield, which diminishes the finding time. The proposed strategy can be utilized effectively and connected to distinguish the shape of the tumor and its geometrical measurements. Finding vector quantization with that picture and information examination is researched even though a control method is intended to make a mechanized brain tumor arrangement utilizing MRI filters. This examination presents two methods for recognition reason: the initial one is edge identification, and the segmentation moment is artificial neural network capability. The pointed Neural Network method includes a few phases, specifically highlight extraction, dimensionality decrease, location, segmentation, and grouping. In this examination, the proposed technique is increasingly precise and viable for mind tumor identification and segmentation.
Chenji Zhao., Shun Xiang., Yuanquan Wang., and Zhaoxi Cai [17] proposed the method CA-Net, a Trans-V module coined from both Transformers and V-Net, which can learn contextual information in 3D MRI for segmentation.
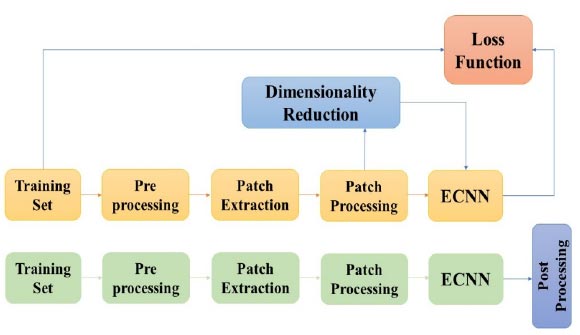
Overview of the proposed method.
3. PROPOSED METHODOLOGY
The proposed work is dependent on convolutional neural networks and the Cuckoo search algorithm. The decrease in the dimensionality for the MRI pictures depends on the cuckoo search algorithm. At whatever point the measurement diminishes, the segmentation expands. The proposed technique was evaluated using the BRATS database, which contains two datasets: Leaderboard and Challenge dataset. The outcomes are estimated utilizing measurements like the Dice Similarity Coefficient, Positive PPV, or the Predictive Value and Sensitivity. Fig. (1) displays an outline of the proposed methodology. Three fundamental stages that have been proposed here are pre-preparing, grouping using ECNN, and post-handling.
3.1. Pre-processing
In the pre-processing phase, MRI and X-ray images are preprocessed by twisting the predisposition field, due to this, the variance in the MRI Image is highlighted by the related tissues and their intensity within them based on the N4ITK technique [18-21]. Therefore, to make the power and complexity of the force standardization techniques, the patients and acquisitions are more comparable. In the force standardization strategy, a lot of power tourist spots PL= {cpu1, f10, f20... f90, cpu2} are taken in for each grouping from the preparation set. Cpu1 and cpu2 are picked for every MRI arrangement, as portrayed in a study [21]. F1 represents the force at the lth percentile. After preparation, the force standardization is cultivated by directly changing the first powers between two tourist spots and comparing learned milestones. In this way, each group's histogram becomes more comparable among participants.
3.2. Dimensionality Reduction Method
A method known as dimensionality decrease is typically used for the segmentation of an MRI image. In this method, a subset of the patches visible in the image is selected to help divide the image. The best subset eliminates the remaining irrelevant measurements from it since it has the fewest measurements and hence is the most precise.
3.3. Cuckoo Search
An epic CS, or the commonly known Cuckoo Search, has been utilized to determine the perfect tumor segmentation rate. CS parameters assume a vital job in diminishing the components of patches in MRI mind tumor pictures. Cuckoo Search calculation execution profoundly relies upon the bones’ similitude esteems, and finding the measurement decreases esteem, necessitates learning of the issue explanation. In this work, the decrease in measurements is observed, and it is utilized to discover the CS parameters. As a result, finding the decrease in dimensional estimation of the tumor segmentation rate of BPTT or Back Propagation Through Time is utilized. CS is more or less a heuristic search calculation and algorithm propelled by the process of reproduction of cuckoos. Fundamentally, cuckoos lay their eggs in other host flying creatures' homes of various species. Here, the host fowl may feel that the eggs may not belong to it or its own and either annihilate the egg or forsake it completely. Three glorified standards for Cuckoo Search are:
1. Every cuckoo lays a single egg, which is then placed in an arbitrary house;
2. The best houses continue to provide the next generations with eggs of extraordinary quality;
3. Here, the number of host residences that are reachable is assessed, and host poultry is likely to find a cuckoo egg laid by the bird. ∈ [0, 1].
The pseudo-code for the CS algorithm is given:
Begin
Function g(x)=dice similarity, x = (xab,.....xnm) T
(a=1 to n number of patches, b =1 to m number of images)
1. Generating initial population of n host patches xab
(a=1 to n number of patches, b =1 to m number of images)
2. While (t < Max Generations)
2.1. Move patches randomly via Lévy voyages
2.2. Evaluate its fitness Fi (segmentation accuracy)
2.3. Select nest k at random from the available n nests
2.4. If (Ga>Gk)
2.4.1. Substitute the new, dimensionality-reduced vector for k.
2.4.2. A fraction of the worst nests are being abandoned, and new nests are being constructed.
2.4.3. Hold the top suggestions or nests with the highest dice value.
2.4.4. Sort the answers and determine the current top feature vector
3. End the while loop
4. Post Processing Results
End
For generating a newly generated feature vector, Levy flight is used and given by the following equation:
xi (t + 1) = xi (t) + α ∧ Levy (λ)
where α is step size and ∧ is entry-wise multiplication. The Levy flight step lengths are distributed by Levy u = t −λ, 1< λ≤3 [22].
The flowchart describes the cuckoo search dimensionality reduction,
3.4. Ensemble Convolutional Neural Networks
Rotating layers of convolution and pooling make up an established convolutional arrangement. The first convolutional layer is used to differentiate samples found within close information picture districts. This is accomplished by converging channels across the information picture, calculating the channel's internal result at each position in the image, and producing the results as highlight maps. Then, each element outline is associated with a non-direct capacity g() as follows: a = g(c). The outcome enactments are applied to the pooling/subsampling layers. All such layers and entire data inside a lot of little neighborhood districts,[{Rj}] (j=1)^n, deliver a pooled highlight delineate of a small size as yield. Pooling function sj = pool(f(ci)) ∀i∈Rj .
The two basic decisions are to perform normal and max-pooling. The main takes the number-crunching mean of the components in each pooling locale, while max-pooling chooses the biggest component of the pooling district. There are a variety of capacities g() that can be used as non-linearities; the most well-known options are tanh, computed, softmax, and ReLu.
In a convolutional organized display, the convolutional layers would be able to extract highlights that are gradually invariant to neighborhood changes of the information picture since they take the pooled maps as information. A fully linked layer with one yield unit for each class in the acknowledgment undertaking always makes up the final layer . The most well-known choice for the last layer is the implementation work softmax, which allows each neuron's yield initiation to be translated as the chance of a particular information picture fitting into that class.
3.5. Ensembles of CNNs
Here, the blend enhances the execution of machine learning models. Averaging the forecasts of a few models is most useful when the individual models are not the same as one another, at the end of the day, to make them diverse, they should have distinctive hyper-parameters or be prepared based on various information.
In that display, the info picture is pre-processed by squares. The dataset is pre-processed before preparing, at that point, toward the start of each age, the pictures are contorted (square). A subjective number of CNNs can be prepared on sources of info pre-processed in various ways. The last forecasts are obtained by averaging the singular expectations of each CNN.
In this proposed method, 4 CNN classifiers are implemented as an ensemble. Each CNN architecture consists of the following layers,
| • Input Layer: Input Shape: (128, 128, 1) No. of Parameters: 0 • Convolutional Layer 1: Filters: 32 Filter Size: (3, 3) Activation: ReLU Output Shape: (126, 126, 32) • Max Pooling Layer: Pool Size: (2, 2) Output Shape: (63, 63, 32) • Convolutional Layer 2: Filters: 64 Filter Size: (3, 3) Activation: ReLU Output Shape: (61, 61, 64) • Max Pooling Layer 2: Pool Size: (2, 2) Output Shape: (30, 30, 64) • Flatten Layer: Output Shape: 30 * 30 * 64 = 57,600 • Fully Connected Layer (Dense Layer): Neurons: 128 Activation: ReLU Output Shape: 128 • Output Layer: Neurons: Number of classes (2) Activation: Softmax Output Shape: Number of classes |
3.6. Regularization
Recently, DropOut [23] and DropConnect [24]—two novel methods for regularising CNNs—have been presented. Sub-inspecting a neural network by eliminating units while using DropOut and DropConnect sums. The combination of a couple of these methods can result in gains because each of these techniques uniquely exhibits overfitting control. This will be demonstrated in the following.
DropOut is related to the yields of a completely associated layer, where each yield layer component is maintained with likelihood p and often set to 0 with likelihood (1 - p). The output of a layer can be built as follows if we further anticipate a neural enactment work with a (0) = 0, for instance, tanh and ReLu:
 |
(1) |
where x is a paired veil vector of size d with every component j coming freely from a Bernoulli dispersion xj∼ Bernoulli(p), N is a network with loads of a completely associated layer, and w is the completely associated layer inputs.
DropConnect is like DropOut, yet connected to the loads N. The associations are chosen haphazardly amid the preparation. For a DropConnect layer, the yield is given as:
 |
(2) |
where Q is weight paired cover, and Qij∼ Bernoulli(p). Every component of the cover Q is drawn autonomously for every model amid preparation (Fig. 2).
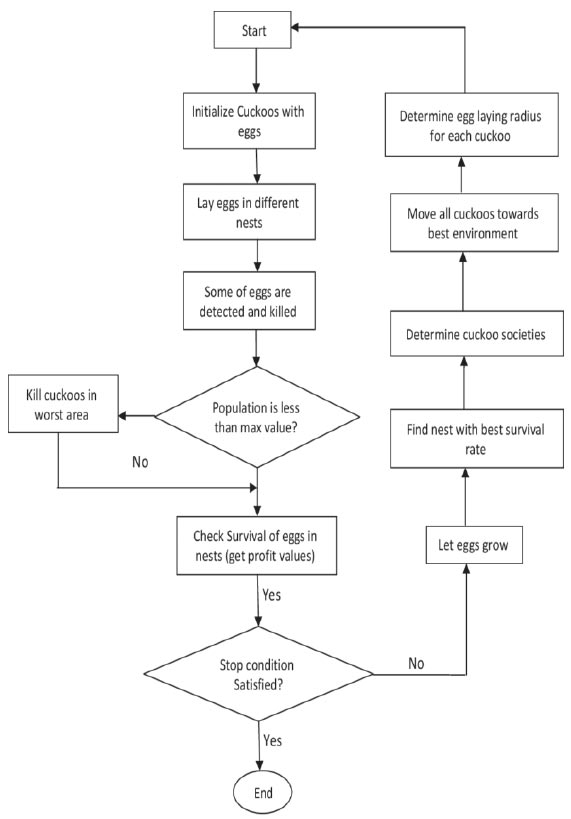
Cuckoo search optimization.
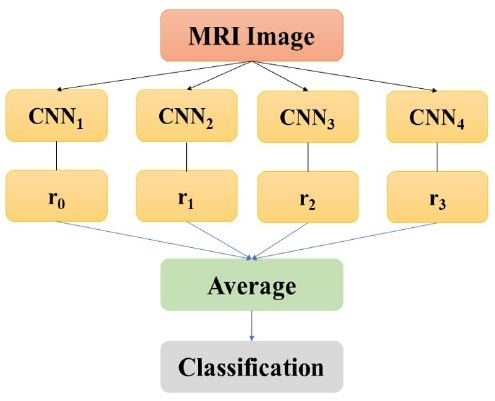
Ensemble convolutional neural networks.
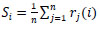
Given some info design, the yield probabilities from all CNN are arrived at the midpoint before making an expectation (Fig. 3). For yield I, the normal yield Si is given by:
 |
(3) |
where rj(i) is the yield I of system j for a given information design.
The methodology comprises applying an alternate load for each system. In the approval set, arranges that had a lower order mistake will have a bigger weight when joining the outcomes. Given some information design, the yield probabilities from all CNNs are increased by a load α before the expectation:
 |
(4) |
We utilize two unique ways to deal with the figure of load α. The principal technique comprises a weighted mean:
 |
(5) |
where Ak is the precision in the approval set for the system k, and I keeps running over the n systems.
In the second strategy, the load αk is picked by rank. The loads depend on the request for exactness in the approval set. This implies the loads are settled, freely on the estimation of the blunder:
 |
(6) |
where R() is a capacity that gives the system a condition dependent on the approval precision arranged in expanding requests. For instance, the system with the biggest precision will have an R() estimation of n, the system with the next biggest exactness, a capacity estimation of n−1, etc, until the system with the most minimal precision gets 1 [25-27].
4. EXPERIMENTAL RESULT ANALYSIS AND DISCUSSION
The experimental analysis of the proposed method was based on the BRATS database of Leaderboard and Challenge dataset. The assessment of the proposed method is evaluated using the Dice Similarity Coefficient (DSC), Positive Predictive Value (PPV), and Sensitivity. The DSC estimates the cover between the manual and the programmed segmentation. It is characterized as,
 |
(7) |
where TP, FP, and FN are the quantities of genuine positive, false positive, and false negative recognitions individually. PPV is a proportion of the measure of FP and TP, characterized as,
 |
(8) |
Sensitivity helps assess the quantity of TP and FN identifications, being characterized as
 |
(9) |
4.1. Computational Efficiency of the Proposed Method
Table 1 shows the computational efficiency of the proposed Ensemble CNN in terms of Training and testing accuracy and computation time.
| Ensemble CNN | Kernels | Training Accuracy (%) | Testing Accuracy (%) | Training Time (s) | Testing Time (s) |
|---|---|---|---|---|---|
| CNN 1 | 32 | 89.72 | 96.74 | 64 | 0.45 |
| 64 | 92.35 | 98.23 | 86 | 0.6 | |
| CNN 2 | 32 – 32 | 90.12 | 97.2 | 104.3 | 0.9 |
| 64 - 64 | 93.45 | 98.87 | 126 | 1.1 | |
| CNN 3 | 32 – 32 – 32 | 91.23 | 97.89 | 173.8 | 1.35 |
| 64 – 64 - 64 | 95.67 | 99.23 | 198.2 | 1.68 | |
| CNN 4 | 32 – 32 – 32 – 32 | 94.23 | 98.23 | 231.5 | 2.65 |
| 64 – 64 – 64 - 64 | 97.87 | 99.5 | 273.2 | 3.4 |
| Data set | Method | Grade | DSC | PPV | Sensitivity |
|---|---|---|---|---|---|
| Leaderboard | ECNN | HGG | 0.91 | 0.95 | 0.87 |
| LGG | 0.72 | 0.70 | 0.93 | ||
| Combined | 0.88 | 0.90 | 0.91 | ||
| CNN | HGG | 0.89 | 0.92 | 0.87 | |
| LGG | 0.66 | 0.55 | 0.865 | ||
| Combined | 0.85 | 0.86 | 0.88 | ||
| Random Forest | HGG | 0.88 | 0.90 | 0.87 | |
| LGG | 0.35 | 0.30 | 0.64 | ||
| Combined | 0.79 | 0.80 | 0.83 |
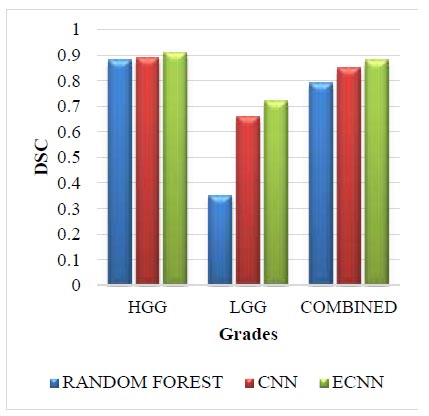
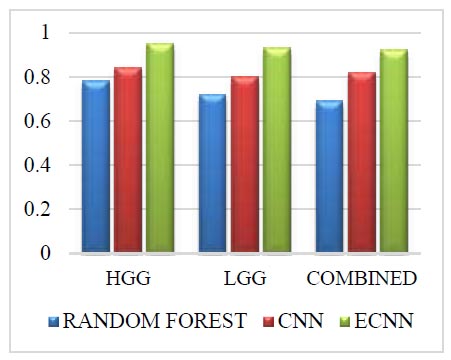
Leaderboard dataset for DSC.
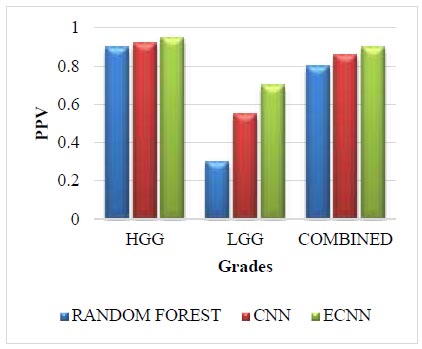
Leaderboard dataset for PPV.
4.2. Leaderboard Dataset
The Leaderboard dataset for the methods such as random forest, CNN, and ECNN with grades HGG, LGG, and Combined have been listed in Table 2.
The Leaderboard dataset for DSC is given in Fig. (4). The leaderboard dataset in DSC for the grade HGG in the proposed method ECNN is 0.03 greater than the random forest and 0.02 greater than the CNN. The leaderboard dataset in DSC for the grade LGG in the proposed method ECNN is 0.37 greater than the random forest and 0.06 greater than the CNN. The leaderboard dataset in DSC for the combined grade in the proposed method ECNN is 0.09 greater than the random forest and 0.03 greater than the CNN. The proposed method ECNN has higher values than the CNN and random forest method for all the three grades HGG, LGG, and Combined.
The Leaderboard dataset for PPV is given in Fig. (5). The leaderboard dataset in PPV for the grade HGG in the proposed method ECNN is 0.05 greater than the random forest and 0.03 greater than the CNN. The leaderboard dataset in PPV for the grade LGG in the proposed method ECNN is 0.40 greater than the random forest and 0.15 greater than the CNN. The leaderboard dataset in PPV for the combined grade in the proposed method ECNN is 0.10 greater than the random forest and 0.04 greater than the CNN. The proposed method ECNN has higher values than the CNN and random forest method for all three grades: HGG, LGG, and Combined.
The Leaderboard dataset for Sensitivity is shown in Fig. (6). The leaderboard dataset in sensitivity for the grade HGG is the same as 0.87 for all three methods. The leaderboard dataset in sensitivity for the grade LGG in the proposed method ECNN is 0.29 greater than the random forest and 0.065 greater than the CNN. The leaderboard dataset in sensitivity for the combined grade in the proposed method ECNN is 0.08 greater than the random forest and 0.03 greater than the CNN. The proposed method ECNN has higher values than the CNN and random forest method for the grades LGG and Combined, whereas, for the grade HGG, all three methods have the same value.
| Data Set | Method | Grade | DSC | PPV | Sensitivity |
|---|---|---|---|---|---|
| Challenge | ECNN | HGG | 0.92 | 0.93 | 0.95 |
| LGG | 0.86 | 0.88 | 0.93 | ||
| Combined | 0.85 | 0.89 | 0.92 | ||
| CNN | HGG | 0.72 | 0.79 | 0.84 | |
| LGG | 0.59 | 0.63 | 0.8 | ||
| Combined | 0.56 | 0.82 | 0.82 | ||
| Random Forest | HGG | 0.70 | 0.75 | 0.78 | |
| LGG | 0.63 | 0.66 | 0.72 | ||
| Combined | 0.53 | 0.62 | 0.69 |
4.3. Challenge Dataset
The CHALLENGE dataset for the methods such as random forest, CNN, and ECNN for the grade HGG are listed in Table 3.
The Challenge dataset for DSC is given in Fig. (7). The Challenge dataset in DSC for the grade HGG in the proposed method ECNN is 0.22 greater than the random forest and 0.20 greater than the CNN. The Challenge dataset in DSC for the grade LGG in the proposed method ECNN is 0.23 greater than the random forest and 0.37 greater than the CNN. The challenge dataset in DSC for the combined grade in the proposed method ECNN is 0.32 greater than the random forest and 0.26 greater than the CNN. The proposed method ECNN has higher values than the CNN and random forest method for all three grades: HGG, LGG, and Combined.
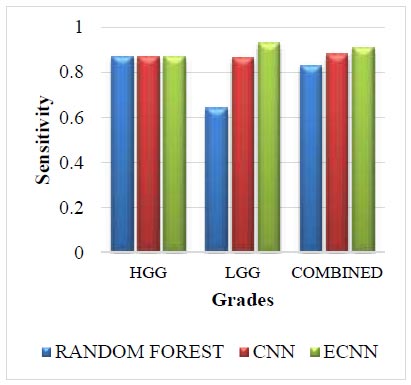
Leaderboard dataset for sensitivity.
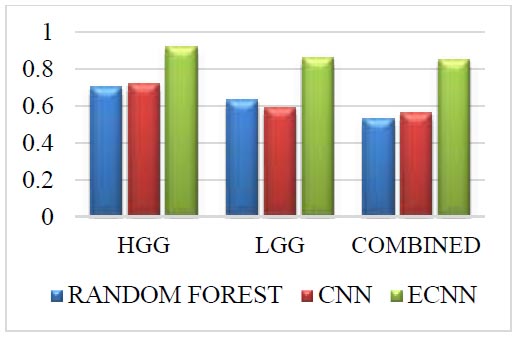
Challenge dataset for DSC.
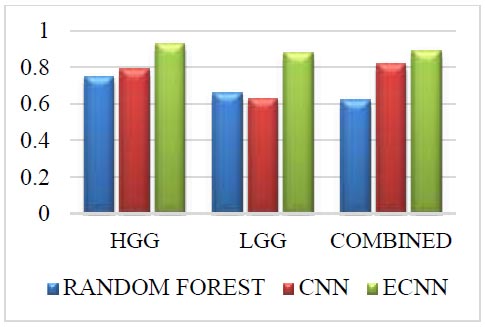
Challenge dataset for PPV.
The Challenge dataset for PPV is given in Fig. (8). The Challenge dataset in PPV for the grade HGG in the proposed method ECNN is 0.18 greater than the random forest and 0.14 greater than the CNN. The Challenge dataset in PPV for the grade LGG in the proposed method ECNN is 0.22 greater than the random forest and 0.25 greater than the CNN. The challenge dataset in PPV for the combined grade in the proposed method ECNN is 0.27 greater than the random forest and 0.07 greater than the CNN. The proposed method ECNN has higher values than the CNN and random forest method for all three grades: HGG, LGG, and Combined.
The Challenge dataset for sensitivity is shown in Fig. (9). The Challenge dataset in sensitivity for the grade HGG in the proposed method ECNN is 0.17 greater than the random forest and 0.11 greater than the CNN. The Challenge dataset in sensitivity for the grade LGG in the proposed method ECNN is 0.20 greater than the random forest and 0.13 greater than the CNN. The challenge dataset in sensitivity for the combined grade in the proposed method ECNN is 0.22 greater than the random forest and 0.10 greater than the CNN. The proposed method ECNN has higher values than the CNN and random forest method for all three grades: HGG, LGG, and Combined.
Challenge dataset for sensitivity.
CONCLUSION
In this work, an optimization-based dimensionality reduction and brain tumor segmentation using ensemble convolutional neural networks in MRI images are proposed. The cuckoo search algorithm used for dimensionality reduction is performed in MRI images to reduce the dimensions. We also compared two of the existing methods with our proposed method. The leaderboard dataset and challenge dataset have been discussed. The challenge dataset for HGG gave good results in terms of dice similarity coefficient and positive predictive value. The sensitivity alone gets reduced when compared with the CNN and random forest methods. Experimental analysis shows promising results on the leaderboard dataset and the BRATS Challenge dataset. The proposed method outperformed the leaderboard dataset with a greater 91% Dice Similarity Coefficient (DCE), 95% Positive Predictive Value, and 87% Sensitivity of High-Grade Glioma (HGG). 72% Dice Similarity Coefficient (DCE), 70% Positive Predictive Value and 93% Sensitivity of Low-Grade glioma (LGG). 88% Dice Similarity Coefficient (DCE), 90% Positive Predictive Value, and 91% Sensitivity of combined High-Grade glioma and Low-Grade glioma. For the BRATS Challenge dataset, the proposed method provides a 92% Dice Similarity Coefficient (DCE), 93% Positive Predictive Value, and 95% Sensitivity of High-Grade Glioma (HGG). 86% Dice Similarity Coefficient (DCE), 88% Positive Predictive Value and 93% Sensitivity of Low-Grade glioma (LGG). 85% Dice Similarity Coefficient (DCE), 89% Positive Predictive Value, and 92% Sensitivity of combined High-Grade glioma and Low-Grade glioma.
AUTHORS' CONTRIBUTIONS
It is hereby acknowledged that all authors have accepted responsibility for the manuscript's content and consented to itssubmission. They have meticulously reviewed all results and unanimously approved the final version of the manuscript.
LIST OF ABBREVIATIONS
| DSC | = Dice Similarity Coefficient |
| PPV | = Positive Predictive Value |
| HGG | = High-Grade Glioma |
| LGG | = Low-Grade glioma |
| DCE | = Dice Similarity Coefficient |
| GM | = Gray Matter |
| WM | = White Matter |
| PPV | = Positive Predictive Value |
AVAILABILITY OF DATA AND MATERIALS
The data supporting the findings of the article is available in the Kaggle dataset website at Brats Challenge Dataset: https://www.kaggle.com/datasets/dschettler8845/
brats-2021 -task1.
Leaderboard Dataset: https://paperswithcode.com/sota/br
ain-tumor-segmentation-on-brats-2013-1.

