All published articles of this journal are available on ScienceDirect.

GSM and Arduino Based Vital Sign Monitoring System
Abstract
Aims:
Analysis of the vital signs of patients can aid in early disease diagnosis and care. There are many illnesses which can be diagnosed and managed by monitoring this medical information periodically.
Background:
Detection of various early-stage medical diseases can be simply done by monitoring Human vital signs, as they show the standard body's essential functions, indicating the status of an individual's health condition.
Objective:
In many cases it so happens that patients do not receive appropriate medical treatment on time, as a result of which unexpected incidents happen due to ignorance of one’s health status. Since pulse rate and vital sign area unit are the foremost crucial parameters, an affordable device to detect such parameters is useful for human health.
Methods:
Photoplethysmography (PPG) is a photosensitive technique that measures difference in blood volume of the pulse (usually in the body's soft tissues) by specifically interfering with the differences in the photo-emitter's absorption, reflection, volume and dispersion of light, and then it is registered by the photoreceptor. Then, the PPG waveform reflects shifts in arterial blood supply. The waveform obtained with a pulse oximeter illuminates skin and processes variations in the absorption of light.
Results:
The embedded systems-Arduino, GSM module and the various sensors used in this research provide a simple monitoring method which does not require a smartphone or internet connectivity.
Conclusion:
This paper aims at illustrating the significance of constantly monitoring vital signs. The device proposed has been developed as an Arduino program that is straightforward and inexpensive, a conveyable system that acquires the vital signs data and sends a text message as warning messages during a health emergency.
1. INTRODUCTION
Detection of various early-stage medical diseases 'can sim- ply be done' by monitoring Human vital signs, as they show the standard body's essential functions, indicating the status of an individual's health condition. Human vital signs can vary depending on numerous factors such as gender, age, medical history, weight, lifestyle, geographical region, etc [1].
In many cases it so happens that patients do not receive appropriate medical treatment on time, as a result of which unexpected incidents happen due to ignorance of one’s health status. Since pulse rate and vital sign area unit are the foremost crucial parameters, an affordable device to detect such parameters is useful for human health. Therefore, an automatic system for continuous measurement of pulse rate, vital signs is incredibly and abundantly essential [2].
Hence the main vital signs are considered to be blood heat also known as normal BT, as well as the pulse rate, also known as vital sign HR, which tends to be a prerequisite for continuous monitoring. The normal BT range and mean for adult males and females. The average skin level blood heat reported for adults is around 36.5 oC (and 37 oC young children and babies). It is considered that the value between 36.5 oC and 37.5 oC is common for adults.
The BT measurement is fairly easy, inexpensive, and often needs no continuous monitoring. Breath Rate (BR) or breath frequency measures an individual's number of respiration cycles in one minute, while the HR denotes to the amount of times the heart beats per minute. A healthy adult's standard BR and HR ranges from 12–20 breaths per minute and 60–100 beats per minute, respectively. These levels in children change to 17–40 breaths per minute for, and 70–190 beats per minute for BR and HR, respectively. Any irregularity of cardiopulmonary average levels can indicate any mental or physical stress [3,4].
Table 1 shows the ranges for normal HR, Tachycardia and Bradycardia based on the information collected from American Heart Association [5]. The set standard for resting pulse in adults ranges from 60 to 100bpm. HR, which represents the heart processes from oxygen rich blood circulation to deoxygenated blood withdrawal in the body, is commonly used to evaluate human physical and mental conditions. Estimating these two parameters HR and BT are essential to tracking vital signs [6-8].
| HR | Condition |
|---|---|
| 60 – 100 bpm | Normal HR |
| >100 bpm | Tachycardia |
| <60 bpm | Bradycardia |
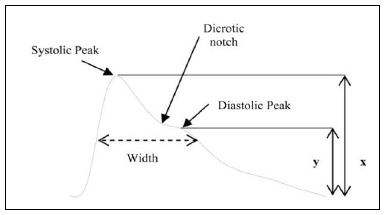
Photoplethysmography (PPG) is a photosensitive technique that measures difference in blood volume of the pulse (usually in the body's soft tissues) by specifically interfering with the differences in the photo-emitter's absorption, reflection, volume and dispersion of light, and then it is registered by the photoreceptor. Then, the PPG waveform reflects shifts in arterial blood supply. The waveform obtained with a pulse oximeter illuminates skin and processes variations in the absorption of light [9].
In Fig. (1), ‘x’ represents the systolic peaks amplitude while ‘y’ represents the amplitude of diastolic peaks in a PPG waveform [10]. The systolic amplitude indicates pulsating changes in a person's blood volume, arising due to the blood flow around measuring site. The DC portion of a PPG is linked to bulk absorption of skin tissue, whereas the signal’s AC component is attributed to change in blood volume in skin which is caused by the cardiac cycle's pressure pulse.
The height of the PPG signal’s AC component is directly proportional to the pulse pressure, the difference between the arteries' systolic and diastolic pressure. The PPG pulse for the PVC cardiac cycle results in lower Blood Pressure (BP) amplitude and a PPG. It is also possible to detect ventricular tachycardia, and ventricular fibrillation [11].
A slight variability in blood volume during cardiac activity that is expressed in the PPG signal morphology appears to be linked to BP. The relationship between BP and PPG is well defined when the PPG is used to test blood flow speed, commonly referred to as pulse wave velocity (PWV) [12]. While the time taken by a blood pulse that originates from the heart to reach a peripheral point of the body is termed as pulse transit time (PTT) [13]. These are important parameters which can be useful in determining BP from PPG signals.
From a PPG waveform the following results may be interpreted,
Case 1: Regular heart rhythm may be indicated when consecutive peaks have approximately equal distance between each other.
Case 2: Regular heart rhythm with elevated heart rate variability is indicated as a small cyclic variation in a regular heart rhythm.
Case 3: A regular rhythm with recurring additional systoles is indicated when the peaks of the PPG waveform are followed by a premature peak.
Case 4: Bradycardia episodes can be observed when there is a prolonged RR rate along with regular beats.
Case 5: A tachycardia episode can be observed when the PPG waveform shows a regular heart rhythm at the beginning and then increases after 15 seconds (short RR intervals) [14]. Therefore, PPG signal is used in this development to analyze the rhythmic activity of a patient’s heart to report in case of a cardiac arrest.
GSR, which stands for galvanic skin response, is a way of calculating skin's electrical conductance. Strong emotion may make the sensitive nervous system activate, resulting in increased sweat secreted by the sweat glands. Grove–GSR helps recognizing these intense emotions simply by adding two electrodes to two digits on the one side, a fascinating gear that build emotional programs, such as sleep quality monitor [15].
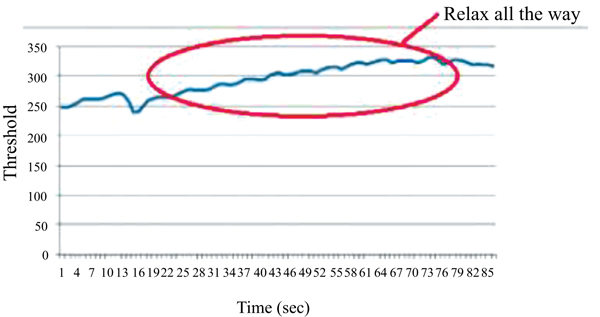
Fig. (2) is a reference graph that shows the threshold variation when the individual is relaxed. (Exhaling).
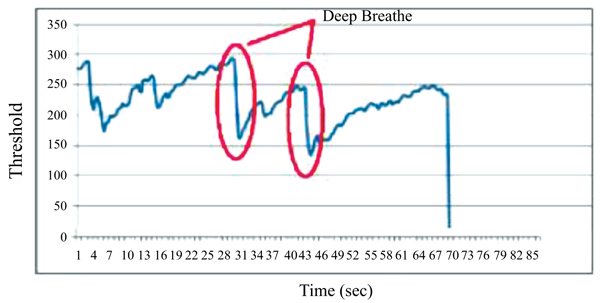
Fig. (3) is a reference graph which depicts the deep breaths taken by an individual. The threshold for peak amplification is considered to determine which value (often set at 0.05 μS) the peak should cross after its onset, to track a peak and not just a substantial increase in the data. The signal jump threshold acts as a constraint to the amount of peak amplification–all values that exceed this threshold (e.g., 0.1 μS) from one sample to another are considered to be increasing quite rapidly to represent a true physiological mechanism and are thus discarded. With these limits set, a data point count will represent the number of GSR peaks within the results. For example, comparing the number of GSR peaks can indicate which group saw a decrease in emotional arousal in response to a stimulus overall. Considering these graphs as an example, graphs were plotted using a Grove-GSR sensor in an Arduino serial plotter as output in results section [15].
Remote healthcare monitoring enables individuals to stay home and monitor their vital signs rather than visiting costly health-care facilities. Therefore, providing an effective and economical alternative to on-site clinical surveillance [16, 17].
For programming these devices Arduino coding is implemented. Arduino is an open source electronic gear meaning the hardware, and the microcontroller software is free to run. GSM commonly used in communication purposes [18, 19].
The objective of the proposed development is to create a functional low cost, low power, efficient, nonintrusive and non-invasive health surveillance system, currently vital signs like pulse rate, BT, SpO2 and GSR can be monitored in the design proposed. The modern way to measure physiological tension is examining the skin behaviour. GSR is a tool used to assess changes in skin behaviour, generally providing an estimation of the range of emotional stress [20]. The issue at hand is the determination of accurate HR readings and the inexpensive control of the effect of stress (as demonstrated by skin conductance) on HR. The design proposed in this development is capable of processing signals from the PPG and GSR, and then extracting statistical features from the processed signals. The goal of this investigation is to precisely calculate parameters, and the analysed data can be transmitted wirelessly to the doctor using GSM anywhere in the world. Such objectives will be attained in a low-cost home care system that consumes less power and is economical to use [21].
This paper further describes the Arduino and GSM based solution being proposed to monitor the vital signs of humans to detect signs of illness in the investigation method. The findings will be discussed in the results and discussion section.
2. MATERIALS AND METHODS
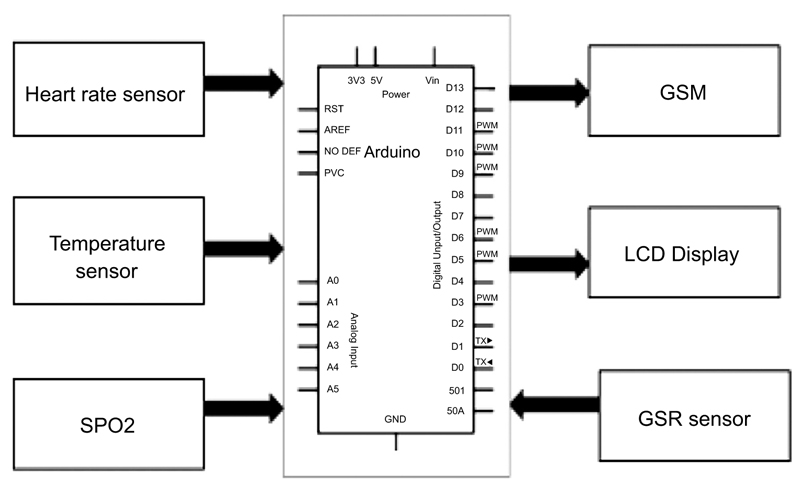
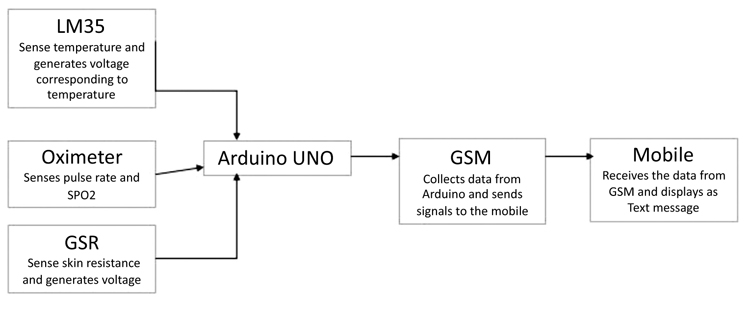
Fig. (4) describes the Arduino based health monitoring system, it makes use of the Arduino Uno module and gathers information from pulse or HR sensor, temperature sensor and, sends a text message (SMS) via GSM module. The collected data then enables the device to send the derived results to the patients phone as an alert message that informs them whether their vitals fall in the normal range or not.
The sections below show the components used in the circuit:
2.1. Arduino Uno
Fig. (5) shows Arduino Uno which is an ATmega328 Microcontroller Module. It consists of 20 I/O digital pins, an ICSP header, a 16 MHz resonator, USB interface, a power jack, and reset button. This microcontroller comes with its own USB bootloader, which helps users to reprogram it [22].

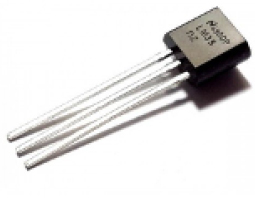
2.2. Temperature Sensor
Fig. (6) shows the biomedical sensor LM35 [23]. The output voltage of this sensor is calibrated in Celsius or Centigrade and it can measure temperatures ranging between -55°C and 150°C. With a 10mV increase in the sensor output, the temperature value increases by 1 degree. The same is true for interpreting negative temperatures. LM35 is at an advantage over thermistor as it does not require any further external calibration. The LM35 sensor is inexpensive, easy to implement in design and provides the required accuracy [24].
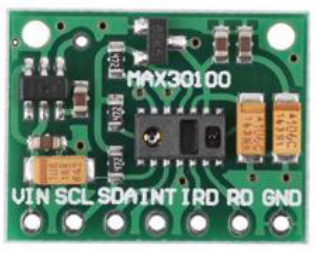
2.3. Pulse Rate and SpO2 Sensor
Fig. (7) shows sensor MAX30100 which is an integrated sensor for HR monitoring and pulse oximetry [25]. The system has two LEDs, one emits infrared (IR) light, the other emits red light. To obtain pulse rate, it makes use of only infrared light. Oxygen levels in the blood are measured with infrared as well as red light. It works on the principle that oxygenated hemoglobin (oxy Hb) and deoxygenated hemoglobin (deoxy Hb) absorb light at different wavelengths. Such that oxy Hb absorbs red light (650nm) and allows IR (950nm) to pass through, whereas deoxy Hb absorbs IR rays and allows only red to pass through it [26]. Similarly, PPG waveform is also obtained. Pulse rate is determined by the time between increase and decrease in oxygenated blood because when the heart pumps SP02 levels increase and when it relaxes, SP02 levels decrease [27].
2.4. GSR Sensor
Fig. (8) shows a GSR sensor. GSR or galvanic skin reaction, is a skin electrical conductivity measuring tool. By connecting two electrodes to two fingers of one hand, GSR identifies intense emotions. The input signal is in the form of resistance and not conductivity while the output signal is calibrated as an analog reading of voltage. The sensitivity of GSR is adjustable via potentiometer [28].


2.5. GSM
Fig. (9) demonstrates GSM which was used to communicate between a GSM or GPRS network and a mobile device in the circuit [29]. Such modules are comprised of a GSM module or a GPRS modem with communication interfaces (such as RS-232, USB 2.0, etc.) and circuit power supply. GSM module is built-in hardware and can be combined with other devices [29, 30].
3. RESULTS AND DISCUSSION
The embedded systems-Arduino, GSM module and the various sensors used in this investigation provide a simple monitoring method which does not require a smartphone or internet connectivity. Using GSM module facilitates the sending and receiving of information regardless of distances.
Fig. (10) shows system architecture and explains how the input signals are processed through the system to give desirable outputs. The device first measures three inputs from sensors connected to the Arduino Uno microcontroller which are mainly BT, pulse rate, SP02, and GSR. The data acquired from these sensors in real time is compared with normal values stored in Arduino, the device then sends SMS with the help of GSM to the individual’s phone and indicates their health status.
Readings taken from Person 1 and the verification of the results are mentioned below.
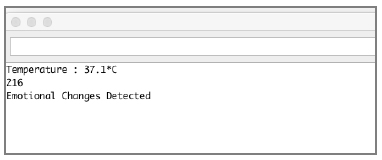
3.1. BT and GSM
The output shown in Fig. (11) indicates a text message received on a mobile phone stating the BT and GSR values measured of the individual. In Fig. (12), the serial monitor output for BT and GSR is displayed after the readings have been taken.
The graph obtained in Fig. (13) the serial plotter for GSR, shows the readings of a person when they are relaxed and taking deep breaths. The fall in threshold indicates the deep breath taken and a constant threshold indicates the person relaxing.

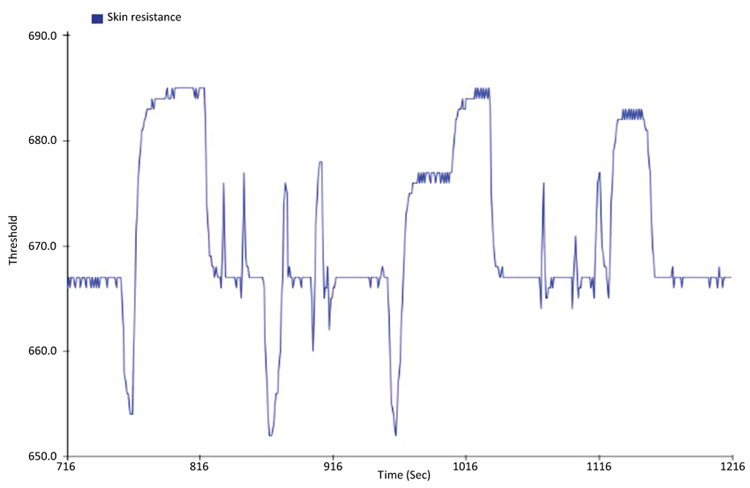
This is calculated using the formula:
Human Resistance = 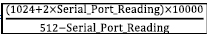
Unit: ohm
‘Serial_Port_Reading’ - value displayed on Serial Port (between 0~1023)
Threshold - Human Resistance
3.2. HR, PPG and SpO2
Fig. (14) indicates a text message received on the mobile stating the HR and SpO2 measured of the individual. Fig. (15) shows HR and SpO2 reading displayed on the Arduino Serial Monitor.
PPG waveform in Fig. (16) has been obtained through transmissive absorption i.e., at the fingertip. After observing this waveform for 60 seconds, it can be interpreted as a regular heart rhythm because in between consecutive peaks there is a +/- equal distance.
PPG has been very helpful in technologies such as telemedicine and remote monitoring especially during lockdowns in countries due to the COVID-19 pandemic wherein people especially those with underlying conditions are urged not to leave their houses.
In order to verify the results of this device proposed, simultaneously the vital signs were measured of one patient. Readings with clinically approved devices and FibriCheck, a mobile phone app and the results are as follows
From the above figures it is observed that the temperature and pulse rate observed on the serial monitor (Figs. 12 and 15) respectively as well as a clinically validated thermometer and BP monitor (Figs. 16 and 17) respectively is the same. The PPG signal observed and interpreted from the serial plotter Fig. (18) is verified by the results from the phone app FibriCheck in Fig. (19).
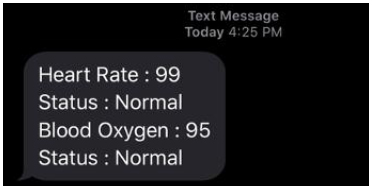
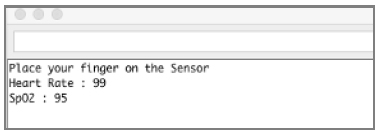
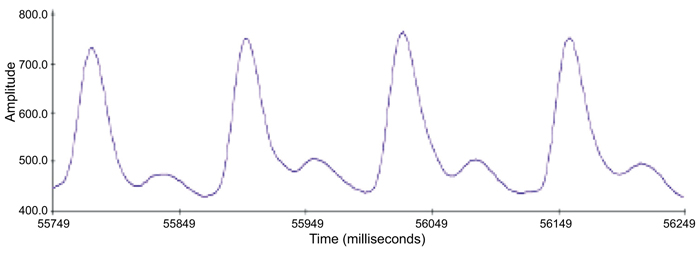
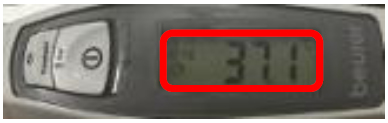
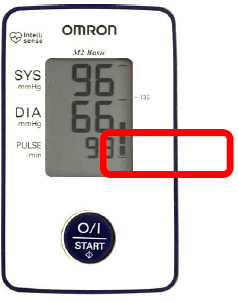

Table 2 is the set of readings measured by the device from 5 different people.
Table 3 are the readings obtained through the following devices: BP monitor, thermometer, and FibriCheck mobile app for 5 different people to check the accuracy of proposed device.
Accuracy calculation: x 100%
Table 4 shows the Accuracy of HR, SpO2, BT for 5 different people.
From Table 4, average percentage of each accuracy is calculated and hence the accuracy of the device is: 98.85%
This proves that the device designed is quite efficient and can provide quite accurate readings.
| HR | Status of HR | SpO2 | BT | |
|---|---|---|---|---|
| Person 1 | 99 | Normal | 95 | 37.1 |
| Person 2 | 84 | Normal | 94 | 36.0 |
| Person 3 | 89 | Normal | 93 | 36.6 |
| Person 4 | 90 | Normal | 97 | 35.5 |
| Person 5 | 85 | Normal | 97 | 35.7 |
| HR | Status of HR | SpO2 | BT | |
|---|---|---|---|---|
| Person 1 | 99 | Normal | 95 | 37.1 |
| Person 2 | 87 | Normal | 95 | 36.4 |
| Person 3 | 90 | Normal | 94 | 36.8 |
| Person 4 | 91 | Normal | 97 | 37.0 |
| Person 5 | 86 | Normal | 97 | 37.0 |
| Person 1 % |
Person 2 % |
Person 3 % |
Person 4 % |
Person 5 % |
Average % |
|
|---|---|---|---|---|---|---|
| Accuracy of Pulse rate | 100.00 | 96.55 | 98.88 | 98.90 | 99.83 | 98.822 |
| Accuracy of SpO2 | 100.00 | 98.94 | 98.93 | 100.00 | 100.00 | 99.574 |
| Accuracy of BT | 100.00 | 98.90 | 99.45 | 95.94 | 96.48 | 98.154 |
CONCLUSION
This paper aims at illustrating the significance of constantly monitoring vital signs. The proposed device has been developed as an Arduino program that is straightforward and inexpensive, a conveyable system that acquires the vital signs data and sends a text message as warning messages during a health emergency. Many devices/technologies at present use wearable devices to execute regular medical monitoring. However, most of the present devices worn on wrists, may not be accurate in providing PPG information.
In addition to the simple and affordable device the main advantage of this development proposed lies within its ability to generate warning signals when a vital sign reading goes beyond usual boundaries, therefore the user can take the appropriate measures very quickly, such as rest, checking with a doctor or calling for an ambulance. In future, this development can be extended by measuring blood pressure based on PPG rather than using an inflatable cuff. The blood travels faster and exerts more pressure when the vessels are more contracted or stiffer. Similarly, the blood travels slower when the vessels are more elastic or relaxed, and it exerts lesser pressure. The Pulse Transit Time (PTT) indicates a higher BP when the PTT is shorter, while a prolonged PTT suggests a lower BP. This relation is at present modelled with the help of machine learning and is a subject of ongoing investigation. Furthermore, this project can be further enhanced by sensing and measuring other vital statistics of a patient like ECG, EEG, saline level, glucose level, etc. At present the data is being monitored in Arduino IDE and since it is a development board, in future the work can be extended by storing data in web page using Internet of Thing technology.
ETHICS APPROVAL AND CONSENT TO PARTICIPATE
Not applicable.
HUMAN AND ANIMAL RIGHTS
Not applicable.
CONSENT FOR PUBLICATION
Not applicable.
AVAILABILITY OF DATA AND MATERIAL
Not applicable.
FUNDING
None.
CONFLICT OF INTEREST
The authors confirm that this article content has no conflicts of interest.
ACKNOWLEDGEMENTS
The Authors would like to thank Prof. R.N Saha, Director, BITS Pilani-Dubai for his constant encouragement and support.

