All published articles of this journal are available on ScienceDirect.

Improving Classification Accuracy of Pulmonary Nodules using Simplified Deep Neural Network
Abstract
Background:
Lung cancer is among the major causes of death in the world. Early detection of lung cancer is a major challenge. These encouraged the development of Computer-Aided Detection (CAD) system.
Objectives:
We designed a CAD system for performance improvement in detecting and classifying pulmonary nodules. Though the system will not replace radiologists, it will be helpful to them in order to accurately diagnose lung cancer.
Methods:
The architecture comprises of two steps, among which in the first step CT scans are pre-processed and the candidates are extracted using the positive and negative annotations provided along with the LUNA16 dataset, and the second step consists of three different neural networks for classifying the pulmonary nodules obtained from the first step. The models in the second step consist of 2D-Convolutional Neural Network (2D-CNN), Visual Geometry Group-16 (VGG-16) and simplified VGG-16, which independently classify pulmonary nodules.
Results:
The classification accuracies achieved for 2D-CNN, VGG-16 and simplified VGG-16 were 99.12%, 98.17% and 99.60%, respectively.
Conclusion:
The integration of deep learning techniques along with machine learning and image processing can serve as a good means of extracting pulmonary nodules and classifying them with improved accuracy. Based on these results, it can be concluded that the transfer learning concept will improve system performance. In addition, performance improves proper designing of the CAD system by considering the amount of dataset and the availability of computing power.
1. INTRODUCTION
Based on the worldwide survey, lung cancer is the most commonly diagnosed cancer (11.6 percent of total cancer cases), and the leading cause of death from cancer (18.4 percent of total cancer deaths) in both sexes combined [1-7]. Lung cancer has caused more deaths than breast, prostate, colorectal, and brain cancers combined in recent decades [7, 8]. According to cancer statistics, there were a total of 228,820 new cases of lung cancer reported in 2020 and an estimated 135,720 deaths in the US alone [8]. According to the World Health Organization (WHO) study, the projected number of new cases of lung cancer worldwide is 36,10,896 and the estimated number of deaths worldwide is 31,04,704 from 2018 to 2040 [9].
The reason for the high mortality rate is that patients appear to be diagnosed at an advanced stage and lack appropriate care. Part of the diagnostic technique is white light or fluorescence bronchoscopy combined with tissue biopsy for conclusive pathology. The problem with this technique is that it has either low sensitivity or specificity, and it is difficult to ensure the representativeness and accuracy of the biopsies during the procedure [10] .
It is a very time-consuming process to identify cancer cells at an early stage, since symptoms only appear at an advanced stage of cancer. Progression of lung cancer without symptoms is the most significant factor that makes this cancer so deadly. Almost a fifth of patients has cancer without symptoms [11]. Patient survival rates can be improved by detecting these deadly cancer cells at an early stage. Early detection of lung cancer is a critical step in raising the likelihood of survival [12]. Early-stage lung cancer can be viewed in Computed Tomography(CT) scans as visible pulmonary nodules. Such lesions can be observed even though they are just a few millimeters in diameter on CT scans. Studies have also shown that radiologists are still unable to recognize all the nodules because of their very small size and their heterogeneity [13].
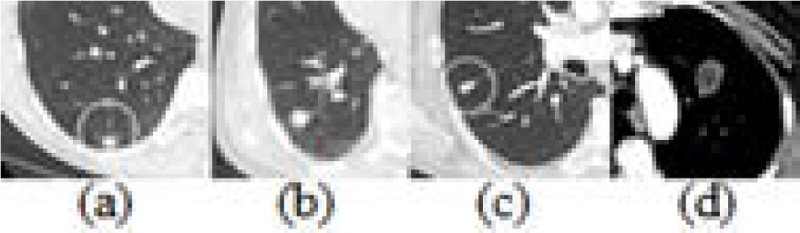
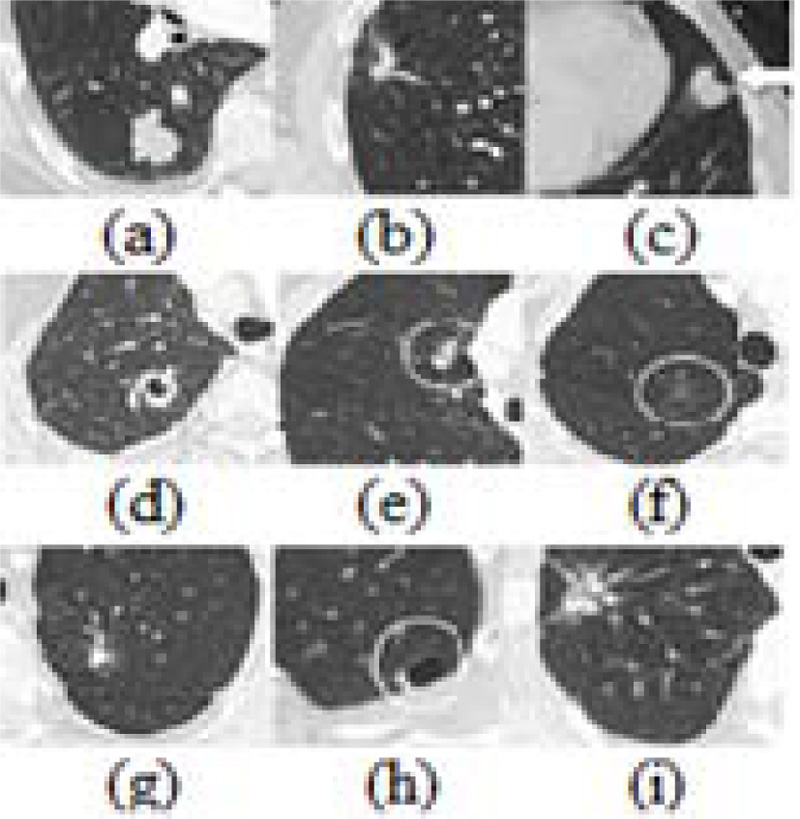
Pulmonary nodules come in a wide range of sizes, forms, and locations. In addition, the contextual conditions around them are often diversified and many pathological lesions seen in CT are not nodulous. Some false positive candidates have a morphological appearance very similar to the actual pulmonary nodules [14]. Figs. (1 and 2) represent the various forms of benign nodules and malignant nodules.
Manual analysis of large CT scans is becoming a time-consuming process. Therefore, an effective Computer-Aided Diagnosis (CAD) system is required to promote the process of automatically analyzing large quantities of CT scans in order to reduce the workload of the radiologist. A specific CAD system's performance can be calculated in terms of diagnostic precision, speed, and level of automation. It is very important to design efficient CAD systems for lung cancer, as early diagnosis will enhance the efficacy of care and increase the survival rate of the patient. In order to improve the accuracy and sensitivity of nodule detection and classification tasks, the proposed CNN-based algorithms have been applied, thereby substantially improving the effectiveness of CAD systems for the early diagnosis of lung cancer.
Despite increasingly intelligent CAD systems emerging with the popularization of CT scanning methods and deep learning approaches, problems still remain. For the training of an effective deep-learning model for medical image analysis, a large amount of high-quality labelled data is important. However, there is no structured labelling of the existing public lung CT scanning datasets, which results in messy annotated information between different datasets. It remains a major challenge to obtain mass lung CT data with proper labelling. In order to assist radiologists in making clinical decisions correctly when facing unexpected samples, an efficient CAD system for pulmonary nodule diagnosis is typically required [15]. The continuous learning capability of a CAD system for the recognition of new medical image samples is therefore critical.
The characteristics of nodules are difficult to detect and requires many complex steps. These have motivated the development of CAD solutions to annotate lung nodules on CT scans. Therefore, researchers have focused on designing a lung nodule detector at a very high sensitivity and train a classification model to reduce false positives to determine the improvement in the performance.
CAD uses two approaches machine learning and deep learning. Machine learning algorithms consist of complex processes which involve separation of the lung region in CT, nodules selection, finding distinguishing characteristics and reduction in the false positives during classification. This process is time-consuming to design, execute and to tune the hyper-parameters requires expertise. Deep learning has great potential to remove these subcomponents, such that the algorithm acquires knowledge indirectly from the data.
Many researchers have worked to establish an efficient and effective method for reducing false positive pulmonary nodules. Experts extract features in conventional machine learning methods that can characterize lung nodules for distinguishing false positive nodules. For example, Ciompi et al. [14] proposed a system that processes raw CT data containing a nodule without the need for additional details, such as nodule segmentation or nodule size, and learns how to interpret 3D data by analyzing an arbitrary number of 2D views of a given nodule. Ye et al. [16] proposed a CAD method consisting of the segmentation of lung region using a fuzzy thresholding method, preprocessing by anti-geometric diffusion. Adaptive thresholding and modified expectation-maximization methods are employed to segment potential nodule objects. Rule-based filtering is used to remove easily dismissible non-nodule objects. Choi et al. [17] used the preliminary stage lung volume segmentation and multi-scale dot enhancement filtering to detect nodule candidates. Feature descriptors are extracted from the detected nodule candidates, and these are optimized using an iterative wall elimination process. Dehmeshki et al. [18] proposed a shape-based genetic algorithm template-matching (GATM) method where pre-processing was done using a spherical-oriented convolution-based enhancement filtering scheme. An adaptive thresholding method was used to isolate the lung region. Rules-based filtering is used for reducing false positives. Sousa et al. [19] proposed an automated lung nodule detection scheme consisting of six stages: extraction of thorax, lung extraction, lung reconstruction, extraction of structures, elimination of tubular structures and false positive reduction. Cascio et al. [20] proposed a method consisting of an initial selection of nodule candidates, segmentation of each candidate nodule and classification of features calculated for each segmented candidate. For proper lung parenchyma volume segmentation, the system uses a region-growing (RG) algorithm and an opening process to include juxtapleural nodules. Setio et al. [21] proposed pre-processing detection pipeline to mask structures outside pleural space to ensure similar appearance of pleural and parenchymal nodules. Multi-stage thresholding and morphological operations are used to identify both larger and smaller candidates. A set of 24 features are determined which are dependent on intensity, shape, blobness, and spatial context. To classify candidates, Support Vector Machine (SVM) classifier is used. Messay et al. [22] used a fully automated lung segmentation algorithm consisting of intensity thresholding with morphological processing to detect and segment candidates. For each segmented candidate, a set of 245 features is calculated. A selection process is used to identify the optimal feature sub-set for two independent classifiers namely Quadratic Classifier and a Fisher Linear Discriminant (FLD) classifier. Liao et al. [23] used a platform consisting of two modules. The first is a 3-D region proposal nodule detection network, which outputs all suspected nodules for the subject. The second one selects the top five nodules on the basis of confidence detection, tests their cancer probabilities, and combines them with a leaky noise-OR gate to obtain the likelihood of lung cancer for the subject. Shen et al. [24] proposed a Multi-crop Convolutional Neural Network (MC-CNN) to automatically extract information from nodules by the use of a novel multi-crop pooling strategy that produces different regions from convolutional feature maps. Xie et al. [25] suggested a new automated pulmonary nodule detection system with a 2D-CNN to assist the CT reading process. First, they modified the structure of the faster R-CNN with two regional proposed networks and a deconvolutional layer to identify nodule candidates and then three models were prepared for three forms of subsequent merging. Second, a 2D-CNN-based boosting architecture is designed for a false positive reduction, which is a classifier that separates true nodules from candidates. Shin et al. [26] exploited three important CAD problems. They investigated architectures of the most studied seven-layer AlexNet-CNN, a shallower Cifar-CNN, and a much deeper version of GoogLeNet-CNN. Setio et al. [27] have developed a new CAD system. The nodule candidates are provided as input to the network. The architecture includes several 2D-CNN whose outputs are combined by the fusion method. Dou et al. [28] proposed a novel approach using 3D-CNNs for a false-positive reduction in automatic pulmonary nodule detection from volumetric CT scans. Shen et al. [29] suggested a Multi-scale network to fetch nodule complexity by removing distinct features.
Our proposed CAD system uses both machine learning and deep learning concept. The machine learning approach is used to extract pulmonary nodules that are fed in the form of input into deep neural networks for classification. We save computational cost and time by using patches as input instead of full-size CT images. Our contributions in this paper are as follows: (i) the usefulness of the combined conventional method and neural network for CAD system. The neural network eliminates the need for some hand-crafted engineering work. (ii) Proposed a simple but successful strategy for extracting nodules from images. Our neural networks take raw nodule patches instead of segmented regions, thus proving that surrounding information obtained from nodule is important (iii) patch size effect on improvement in classification (iv) incorporating the use of independently classifying neural networks (v) transfer learning efficiency [30, 31]. The remainder of this paper is organized as follows. We described the dataset in Section-2, our proposed method in Section-3 and report the implementation and simulation results in Section-4. The paper ends with conclusions and suggestions for future work.
2. DATA SET
We applied the proposed method on the dataset available in the LUNA16 challenge. The dataset consists of 888 CT scans. The volumes have a resolution of 512 × 512, spacing of 0.74 × 0.74 mm2 and variable slice thickness up to 2.5 mm. Lung nodule annotations were compiled using a two-step labeling procedure by four radiologists. Each radiologist classified lesions as non-nodule, nodule < 3 mm and nodules > = 3 mm. The challenge then considered 1186 nodules > = 3 mm approved as reference norm by three or four radiologists. Annotations not considered i.e. non-nodules, nodules < 3 mm and nodules which are annotated by one or two radiologists were referred to as insignificant in challenge but we considered them for gaining malignancy information [32].
3. METHODOLOGY
The proposed CAD system design consists of two stages: 1) the extraction of pulmonary nodules and 2) the classification. The technique proposed to limit the high-dimensional image to a few areas of interest, which are further classified.
3.1. Pulmonary Nodules Extraction
To minimize complexity and computing power, the amount of information is reduced by the extraction of pulmonary nodules. Different operations were executed for the extraction of the nodules from the CT scan. The LUNA16 dataset are provided with annotations of each nodule and non-nodule in a scan. These annotations have information of the location and diameter of the candidate, which helps to extract nodules. Nodules those were annotated by fewer than three doctors were considered irrelevant but they provide valuable malignancy information and thus, we considered them in our work. The information of such nodules is available in candidates (v2) label set of LUNA16 [21, 33].
The process for extraction of pulmonary nodules is shown by the block diagram in Fig. (3). The CT scans are formed by different settings of CT scanners, which create a variation in the spacing of slices. Therefore, they are rendered homogeneous by pre-processing the scans. To do this, all CT scans were rescaled considering target voxel of 1 mm and resized using interpolation operation. The raw data are represented into the Hounsfield unit (HU), which is used to describe radio density. There can be a difference in HU value for tissues among people. Because of the biological structure of lung, the CT image shows various other tissues and organs along with the lung. These will create a challenge during detection and to a solution to it is extracting the mask of the lung while ignoring the rest, which creates challenge in the detection stage. So, first, Intensity Normalization is carried out, to convert the image from HU to UINT8. The data array is first clipped within [−1000, 400], and finally scaled in range of 0 and 255 [23].
During the nodule segmentation, global context was overlooked thus many false positives were produced, which were considered in further stages. We used a machine learning approach for lung segmentation method to address this issue. Segmentation starts with binarized using − 400 as the threshold on which the following processes are performed. Blobs connected to border of the lung are removed by clearing them, then region proportional operation is performed to sort the largest area. Due to the morphological structure of the lung, many a time nodules are attached to the edges of the lungs, vessels and airways. These voxels are removed using a morphological erosion operation using a spherical structure with a radius of 2 mm. Thereby, a morphological dilation operation using the same structure as used in erosion operation is applied on radius of 10 mm; this is done in order to consider the pleural nodules which are attached to lung walls. The small structures which cannot be considered as nodules are filled using masking technique [34]. Finally, positive and negative candidates are extracted from candidate location provided in annotations files where annotations.csv and annota- tions_excluded.csv contain locations and diameter for 1187 and 35,193 number of candidates and candidates_V2.csv contains locations, diameter and malignancy score for 7,54,976 candidates. Thereby using swapping and data augmentation in nearby slices total of 1,85,000 nodules and non-nodules patches of size 64 x 64 are obtained and fed as inputs to train the classifying network [19, 20, 22, 24, 25, 27].
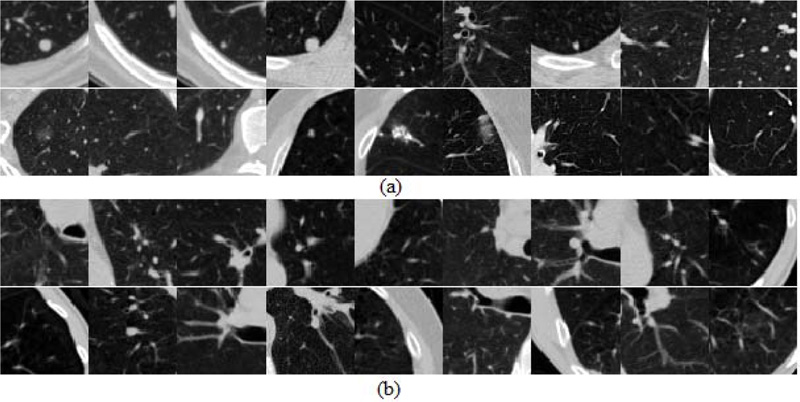
Fig. (4) shows some of the patches which show the heterogeneity in positive and negative categories and which may be the source of false predictions leading to a challenge in improvement of accuracy.


3.2. Classification
The final step to classify lung cancer is done by training the neural networks to predict the malignancy of the nodules. The network will process each nodule in a sliding window pattern. This formed pattern having malignancy information in each layer is covered by the sliding window. This will help to calculate the probability that the patch being cancerous or non-cancerous. In view of the CT image lung nodule classification, our aim is to extract a collection of challenging features with the help of the various models that capture the essence of class-specific nodule details. For this study, we have trained three deep neural networks to classify nodules.
3.2.1. 2D-CNN
In 2D-CNNs for pulmonary nodule classifiers, interested candidates are used by networks to train for developing discriminative capability. The size of the candidate, i.e., the surrounding area covered, is referred to as the receptive area. This plays an important role in the visualization capability for the model’s performance. Thus, the contextual environment provided to the model will indirectly yet significantly affect the distribution of the predictability generated and, therefore, the accuracy [15, 27, 29].
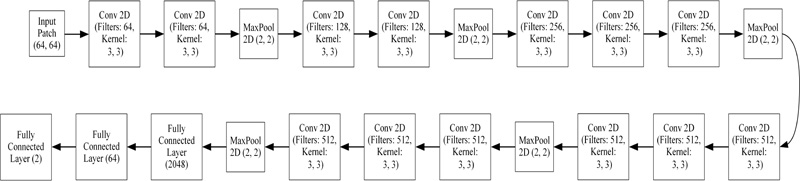
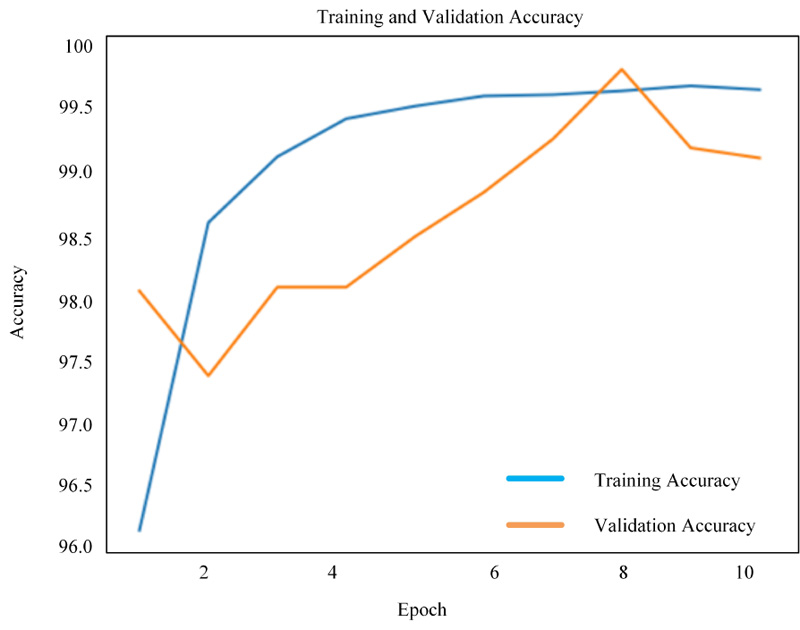
A variety of very effective CNN models have been used for 2D natural images with millions of training datasets. These models encouraged us to design our 2D-CNN model. Considering the dataset’s visual behaviors, the amount of training data and the availability of GPU computing resources, we designed a fairly simple 2D-CNN architecture shown in Fig. (5). The input layer is 64 x 64 in size. Thereby, three convolutional layers having 32, 32, and 64 filters with 3 x 3 kernels. Every convolution layer is trailed by a max-pooling layer of 2 x 2 kernels. Final fully connected layers consist of 64 and 2 neurons. We use Rectified Linear Units (ReLU) as the activation function for every convolutional layer and Softmax for the probability prediction used for classification in the fully connected layer. Our model has approximately 2 Lakhs parameters. Classification accuracy obtained by this network was 99.12%.
3.2.2. Transfer Learning (TL)
After training the network from the beginning, we found that we required better methods to infer unique features. We converted the images to a small area of concern but, the amount of dataset is low and as a result, the number of malignant nodules is lesser. Hence, we concentrated on network, which is initialized with pre-trained weights.
The TL concept is very common in RGB image classification, in which most of them use an ImageNet dataset-trained network. As a result, features are extracted on a large dataset and applied to another neural network. Nevertheless, such networks could not be used for CT scans directly because such networks were trained for RGB images, so we had to train on our own [26, 30].
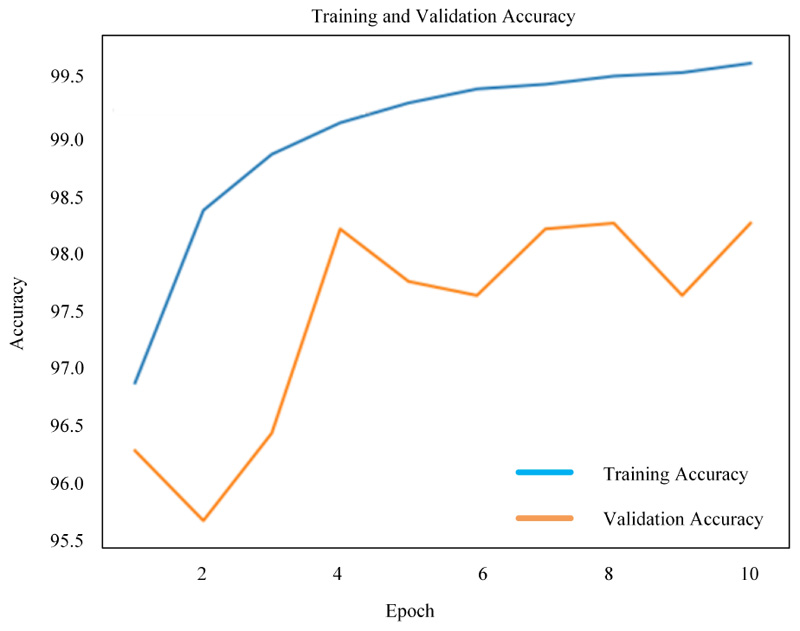
We chose VGG-16 to use the TL framework. VGGNet was born out of the need to reduce the number of parameters in the layers. VGGNet consists of 16 convolutional layers and is very appealing due to its very uniform architecture. It is currently the most preferred choice to extract features from images. However, VGG Net consists of 138 million parameters, which can be a little difficult to manage. Fig. (6) displays the architecture of VGG-16 used to classify candidates and the accuracy achieved by this network was 98.17%.
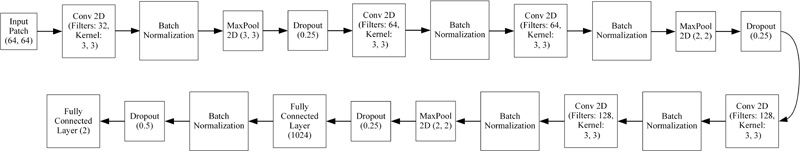
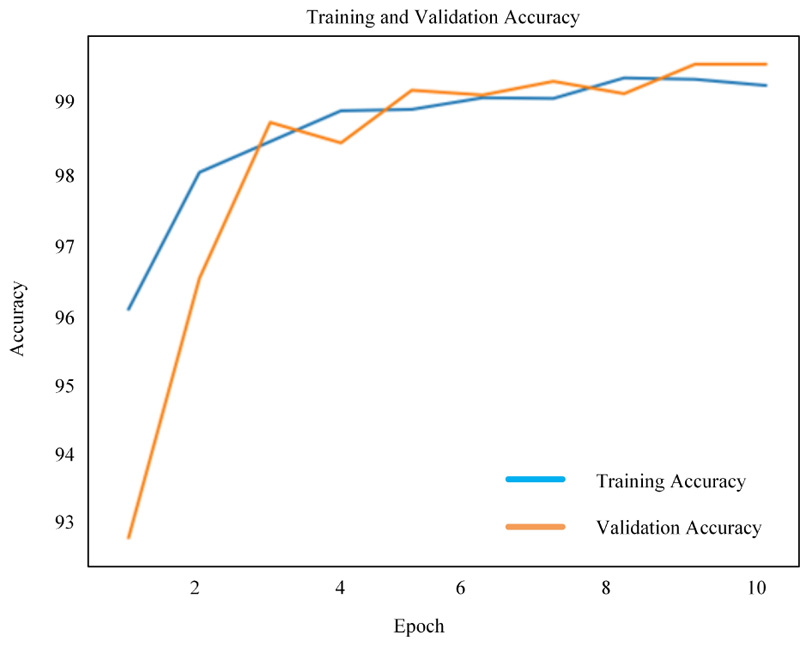
Though there are millions of parameters in VGG-16, performance has deteriorated compared to 2D-CNN. Consi- dering the benefit of TL, the VGG-16 network has been streamlined by implementing batch normalization and drop-out for achieving the convergence at high accuracy and thus, the simplified VGG-16 architecture is formed. Fig. (7) shows an architecture of the simplified VGG-16 network, which achieved an accuracy of 99.60%.
4. IMPLEMENTATION DETAILS AND RESULTS
4.1. Details of Implementation
We trained the models on candidates obtained from the LUNA16 dataset. The training set contains 90% of the patches, and a validation set has the remaining 10%. The networks were developed in Python based on the Deep Learning Library of TensorFlow. The three network architectures have been independently developed and trained. To train the networks, we randomly initialized the weights using the Gaussian distribution and modified them with the standard backpro- pagation. We used ADAM optimization on 128 patch mini-batches and reducing the loss using the categorical cross-entropy loss. ReLU activation function is used to provide non-linearity. The momentum was set to 0.9, the learning rate to 0.001, and the dropout rate of 0.25 and 0.5 was used to enhance the model's convergence rate and generalization capability. We train all networks on NVIDIA GeForce RTX 2070 GPU for 10 epochs.
4.2. Results
To quantitatively evaluate the effectiveness of our model, we considered accuracy as evaluation metrics. Accuracy is calculated by dividing the correctly categorized to the overall experimental data. It is calculated as Accuracy = (TP + TN)/ (TP + TN + FP + FN), where TP and FP represent correctly classified nodules and incorrectly classified non-nodules, respectively. Likewise, TN and FN reflect correctly labeled non-nodules and incorrectly labeled nodules, respectively.
Figs. (8-10) shows the simulation results of 2D-CNN, VGG-16 and simplified VGG-16, respectively. The findings prove that there is a significant improvement in the use of deep neural networks from scratch. The performance is measured in terms of accuracy where 2D-CNN has 99.12%, VGG-16 has 98.17% and simplified VGG-16 has 99.60%, which proved that improvement is obtained for the network, which is not too simple nor complex.
4.3. Comparative Evaluation of the Proposed Methods with the Existing Methods
Table 1 provides a comparison of our simple to complex deep neural networks with a simple network such as 2D-CNN to a complex network such as 3D-CNN and Faster R-CNN. As per the Table 1 of the proposed paper, the maximum accuracy found from the past literatures was 97.4%. The comparison shows that, when designing a deep neural network, due consideration must be taken with regard to dataset and GPU capability. Therefore, among the three deep neural networks developed and implemented, the results show that 2D-CNN had a high accuracy of 99.12%, while using a more complicated VGG-16 network shows that accuracy decreased to 98.17% and which was then improved to 99.60% on using simpler VGG-16. The comparison shows that our simplified VGG-16 network has improvement due to the fact that the network is neither too simple for learning heterogeneity of nodules, nor its too complex to burden the computing capability and use of dropout and batch normalization helped in overcoming over-fitting [35, 36].
| Author | Performance | Dataset | No. of CT Scans | Model Type |
|---|---|---|---|---|
| Ciompi et al. [14] | Accuracy: Intensity feature + SVM: 27% Unsupervised features + SVM: 39.9% ConvNet 1 Scale: 78% ConvNet 2 Scale: 79.2% ConvNet 3 Scale: 79.5% |
Train: MILD Test: DLCST |
Train:943 Test: 468 |
ML and ConvNet |
| Shen et al. [29] | Accuracy: 86.84% | LIDC-IDRI | 1010 | ML+2D-CNN |
| Shen et al. [24] | Accuracy: 87.14% | LIDC-IDRI | 1010 | 3D-CNN |
| Monkam et al. [35] | Accuracy: 88.28% AUC: 0.87 Sensitivity: 83.82% F-score: 83.45% |
LIDC-IDRI | 1010 | 2D-CNN |
| Dehmeshki et al. [18] | Detection rate: 90% | Thoracic CT | 70 | Shape-based genetic algorithm template-matching (GATM) |
| Liao et al. [23] | Accuracy: Train: 90% Test: 87% Cross entropy (Leaky noisy OR): 0.406 |
LUNA 16 DSB 2017 |
LUNA16:888 DSB: 1186 |
3D-Faster R-CNN |
| Ye et al. [16] | Detection rate: 90.2% | Thoracic CT scans | 108 | Shape-Based Computer-Aided Detection |
| Messay et al. [22] | Detection rate: 92.8% | LIDC-IDRI | 84 | ML |
| Sousa et al. [19] | Accuracy: 95.21% | CT scans | 33 | ML |
| Cascio et al. [20] | Detection rate: 97% | LIDC-IDRI | 84 | Stable 3D mass–spring models |
| Monkam et al. [36] | Accuracy: 97.35% AUC: 0.98 F-Score: 96.42% Sensitivity: 96.57% |
LIDC-IDRI | 1010 | 3D-CNN, ELM |
| Choi et al. [17] | Accuracy: 97.4% | LIDC-IDRI | 84 | 3D-shape-based feature descriptor |
| Proposed 2D-CNN | Accuracy: Train: 99.66% Validation: 99.12% |
LUNA 16 | 888 | ML+ 2D-CNN |
| Proposed VGG-16 | Accuracy: Train: 99.54% Validation: 98.17% |
LUNA 16 | 888 | ML+ VGG-16 |
| Proposed Simplified VGG-16 | Accuracy: Train: 99.38% Validation: 99.60% |
LUNA 16 | 888 | ML+ Simplified VGG-16 |
CONCLUSION AND FUTURE WORKS
In order to enhance the early diagnosis of lung cancer, three neural networks are proposed in this paper for the classification of pulmonary nodules. The results of 2D-CNN achieve great performance of 99.12% because of the simplicity of the neural network for a small quantity of dataset. Using TL concept like VGG-16, the accuracy degraded to 98.17% because of the complexity applied over the small dataset. Hence, we proposed simplified VGG-16 to improve the performance to 99.60%. This can be achieved by using batch normalization and dropout for removing the overfitting problem caused in VGG-16. In a preliminary study such as this, the potential and applicability of machine learning algorithms and deep learning in health care can clearly be observed. Deep-learning systems such as CNNs have become relevant with greater access to larger volumes of data. The ultimate goal is to make strides in the successful use of cutting-edge technology to boost the quality of life and survival levels of patients with lung cancer worldwide.
Nevertheless, there are some shortcomings worthy of note in this process. The proposed approach is based on deep neural networks, which require a very high computational cost. The implementation of the proposed model was trained on one dataset. Therefore, the generalizability of which remains uncertain. A significant part of the challenge was to construct the full framework. Much room for improvement remains there. Our future research will be to solve the problems listed above, the overcoming of which are of extreme importance for the development of effective models.
ETHICS APPROVAL AND CONSENT TO PARTICIPATE
Not applicable.
HUMAN AND ANIMAL RIGHTS
Not applicable.
CONSENT FOR PUBLICATION
Not applicable.
AVAILABILITY OF DATA AND MATERIALS
The LUNA16 dataset regarding this research are available at: https://luna16.grand-challenge.org.
FUNDING
None.
CONFLICT OF INTEREST
The author declares no conflict of interest, financial or otherwise.
ACKNOWLEDGEMENTS
Declared none.

