All published articles of this journal are available on ScienceDirect.

Temperature Influences at the Myoelectric Level in the Upper Extremities of the Human Body
Authors Info & Affiliations
Abstract
Objective:
Nowadays, surface electromyography (sEMG) signals are used for a variety of medical interaction applications along with hardware and software interfaces. These signals require advanced techniques with different approaches that enable processing the sEMG signals acquired in the upper limb muscles of a person.
Methods:
The purpose of this article is to analyze the sEMG signals of the upper limb of a person exposed to temperature changes to envisage its behavior and its nature. The anticipated diagnostic is a key factor in the health field. Therefore, it is very important to develop more precise methods and techniques. For the present study, a heat chamber that allows controlling the temperature of the area where the patient rests his or her hand was designed and implemented. With the appropriate hardware interfaces, the sEMG signals of the hand were registered with MatLab/Simulink software for further analysis. The article explains the analysis and develops knowledge, through a probabilistic approach regarding the change in the sEMG signals.
Results:
The results show that there is an activity in the sEMG signal response due to changes in temperature and it is feasible to detect them using the proposed method.
Conclusion:
This finding contributes to research that seeks to characterize temperature’s effect in the biomedical field.
1. INTRODUCTION
Electromyography signals are currently an important field of study due to their wide range of applications [1-6] One of the lines of research involves medicine and technology, and it may improve the quality of life of people. The present study is a contribution to this area. It focuses on measuring myoelectric changes in the human body when exposed to temperature variations. The responses to temperature changes are important for users of upper limb prosthesis that functions with myoelectric feedback [7] because it is related to how users feel the prosthesis, and it may help them feel as if they have their own extremity.
Currently, the robotic prosthesis of upper limbs that base their functionality in electromyography signals (EMG) uses the variations in forearm muscle contractions to control the speed of the device through a specific method. They seek a link between the EMG signal and the effort by the muscle, considering the influence of any other constant variable. This can be expressed as EMG=f(F, Others).
The present study aims to characterize the effect of temperature on the superficial electromyography or sEMG signal considering the rest of the variables as constant. This may be expressed as |sEMG|=f(T, Others). This effect may be useful for robotic prosthesis to provide feedback to the human body on the environment, in this case, on temperature.
In this research, a chamber [8] with a Proportional Integral Derivative (PID) temperature controller was designed. This way, the temperature was increased in steps up to 45 degrees celsius. This was the highest temperature because the skin gets injured after 55 degrees Celsius, also known as critical temperature. Each change took place after the temperature was stable for at least 20 seconds. The measure of neuromuscular activities can be performed in two different ways [9], by inserting a needle in the body to obtain the data of the muscles and with the help of electrodes placed in three strategic points, so the data obtained is known as Surface Electromyography (sEMG). The present study worked with the sEMG.
For the sEMG signal acquisition, two alternatives were used throughout the experiment. The first one used surface electrodes along with a signal conditioning card and a data acquisition card, which allowed registering the information in the MatLab/Simulink software. The second one used an MYO bracelet with an interface of the same manufacturer that allowed connecting with the MatLab/Simulink software. Thus, in this test, one of the two devices for sEMG signal acquisition was placed on the right hand of the patients and then their hands were placed within the chamber.
The sEMG signals showed an evident change in the graphs when the data was registered. This analysis could be performed at a simple glance of the graphs with the help of a trained and experienced person [10]. Although there were significant results with this method, a mathematical or statistical method was necessary to recognize the changes in real-time and to neglect the physical or emotional aspects of the subjects. It is important to note that all patients were healthy people with no sign of disability. They were informed of the proceeding and they agreed to participate in the tests acknowledging the risks of warming their hand in the chamber.
Time and frequency analyses of the changes in the sEMG signals were carried out to examine the possibility of developing a mathematical model to characterize the effect of temperature change over the signals. The study concluded that the characteristics of the frequency domain of these signals had a better performance than the ones obtained from the time domain [11]. However, these characteristics were not generalizable because every patient had a different anatomy and physiology.
The next step was analyzing the amount of data necessary to successfully determine or characterize the system. If there was less data, the curve did not behave as expected, and if there was more data than the requirement, the amount of irrelevant data also increased. Once the data was selected, the analyses considered the changes in the sEMG signal comparing the signal acquisition in the original temperature and once the new temperature was reached. In other words, only the signals registered in the starting temperature and the signals registered once the new desired temperature was reached, after each of the changes made, were considered.
The data obtained was analyzed after the data collection process ended. According to previous studies [8], with the development of a probabilistic analysis program using optimization methods, a link between temperature change and changes in sEMG signals was established. Therefore, the starting point for the analysis was acknowledging that the sEMG signals indeed reacted to temperature change, considering the remaining variables as constants.
Since there are variations in the sEMG signals, the next step was to look for characteristics in the behavior of time [10] and frequency [11]. Both domains help explain and weigh the changes by analyzing statistical parameters that may be combined with intelligent control techniques, such as neuronal networks. This approach illustrates the potential of application for future prosthesis and robotic arms in the field of biomedicine.
The rest of this article is organized in five sections. Section 2 describes the development of the experiment presented in previous studies [8], emphasizing signal acquisition and treatment [10]. In section 3, the variable of interest is deduced, contrasting it with probabilistic diagnostic techniques [12, 13]. In section 4, the relation of these variables obtained for every patient is calculated and a probabilistic description based on this behavior is developed. Finally, section 5 illustrates the results obtained and the conclusions achieved.
Notations: Standard notations are used in this paper. The surface electromyography signals will be denoted as sEMG signals.
2. METHODS
The right hand of a healthy person was subjected to controlled temperature changes. A PID controlled heat chamber was built to perform the experiment [8]. This chamber had four 100 Watt lamps as a heat source. The hardware was interfaced with MATLAB and Simulink to acquire the sEMG signal data, with a sampling rate of 1024 [Hz], as well as the chamber, the room and the body temperature.
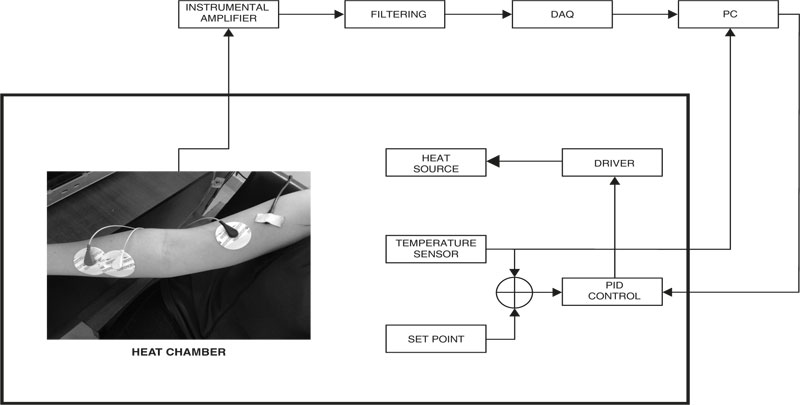
Although data acquisition originally considered the three temperatures (room, body and chamber), due to the approach of the research, the chamber temperature was analyzed as an independent variable, capable of producing the changes. The other temperatures were considered invariants throughout time. In other words, the tests were carried out in a controlled environment to consider solely the temperature changes in the chamber and the effects on the sEMG signals of the upper limb of the human body exposed to this temperature variation. A general description of the experiment is shown in Fig. (1).
2.1. Hardware
An Olimex SHIELD-EKG-EMG was used to sample EMG information [14]. This board includes an Instrumentation Amplifier (INA321EA), an Operational Amplifier with regulated gain and a Third Order “Besselworth” filter. Finally, the total gain of the board was Gtotal = 2848.
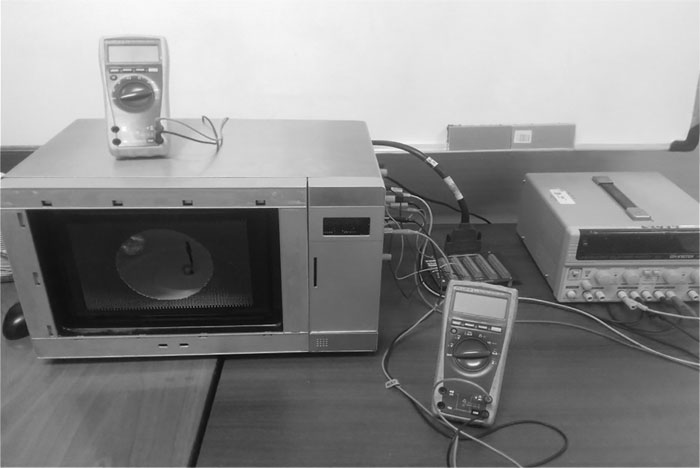
The room temperature (Ta), the temperature of the temperature-controlled chamber (Tc) and the body temperature (Tb) were registered by three different LM35 sensors. The body temperature sensor was placed on the upper arm by the biceps muscle. A NI PCI-6221 Data Acquisition was used to interface all sensors to the computer, all through analog channels. Fig. (2) shows the heating chamber used for the experiment.
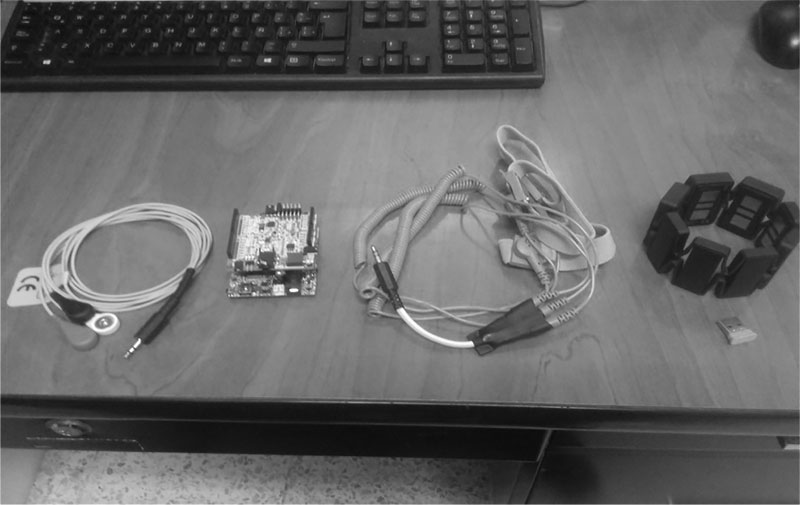
The devices used for the acquisition of sEMG signals to be sent to the system are shown in Fig. (3).
- Myo Gesture Control Armband, 8 channels to measure independent differentials signals.
- Olimex and Shield EKG/EMG, 1 channel with measure settings of the type of signal, cardiac or muscular.
2.2. EMG Specifications
The sEMG signals were acquired through non-invasive surface pre-gelled disposable electrodes. A reference electrode was placed on the biceps and the other two were placed on the right hands of the subjects at the flexor-pronator muscle group to acquire the differential voltage [15]. Previous studies have also shown these muscles, which are related to the middle and ring fingers, that show more signal variation when the temperature change is sensed than other muscles. Tested subjects were in a relaxed position to avoid artifacts and muscle temperature increase due to contraction [16, 17].
2.3. Focus Group
A group of ten healthy people, five men and five women, were randomly selected as test subjects for this experiment. All of them were students of the “Escuela Superior Politécnica del Litoral (ESPOL)”. Their relevant characteristics are shown in Table 1. However, it is important to note that the subjects were average in terms of physical activity. In other words, they were the people who did not carry out specialized physical activity due to being students . Therefore, the analysis of the body mass index (BMI) or the body fat percentage (BFP) was not considered in the present study. This element may be subject to further research focused on a different population, for example, athletes. The experiment consisted of three different tests, each with at least ten iterations. However, not all of them were applied to all subjects. Each test consisted of subjecting the patient's hand to three cycles of temperature variations. Each change took place after the previous temperature was in a steady-state Tss for 20[s]. Each test is specified in Table 2.
| Subject # | Gender | Height (cm) | Weight (lbs) | Age (years) |
| (Subject 1) | male | 158 | 186 | 25 |
| Subject 2 | female | 160 | 186 | 25 |
| Subject 3 | male | 167 | 139 | 24 |
| Subject 4 | male | 153 | 112 | 24 |
| Subject 5 | male | 179 | 206 | 23 |
| Subject 6 | female | 165 | 175 | 25 |
| Subject 7 | female | 169 | 146 | 24 |
| Subject 8 | male | 170 | 187 | 26 |
| Subject 9 | female | 161 | 150 | 22 |
| Subject 10 | female | 165 | 196 | 24 |
| Test # | Initial Temperature (°C) | Final Temperature (°C) | Time in Steady-State (s) |
| 1 | 30 | 35 | 20 |
| 2 | 35 | 40 | 20 |
| 3 | 40 | 45 | 20 |
2.4. Software
The main program was developed in Simulink (see Fig. 4). A MatLab function made sure that the Tss was constant for each step, so the temperature set point for the PID was automatically changed, as explained in Table 2. Input and output signals were interfaced with the DAQ through Simulink Desktop Real-Time Library. Digital signal processing was carried out after all data were collected.
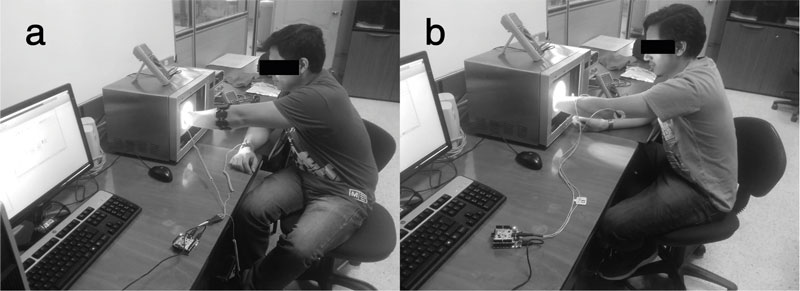
In Fig. (5), two voluntary patients who were submitted to the experiment can be observed. The purpose of obtaining the sEMG data signals was to analyze the myoelectric response to the temperature changes in the heating chamber.
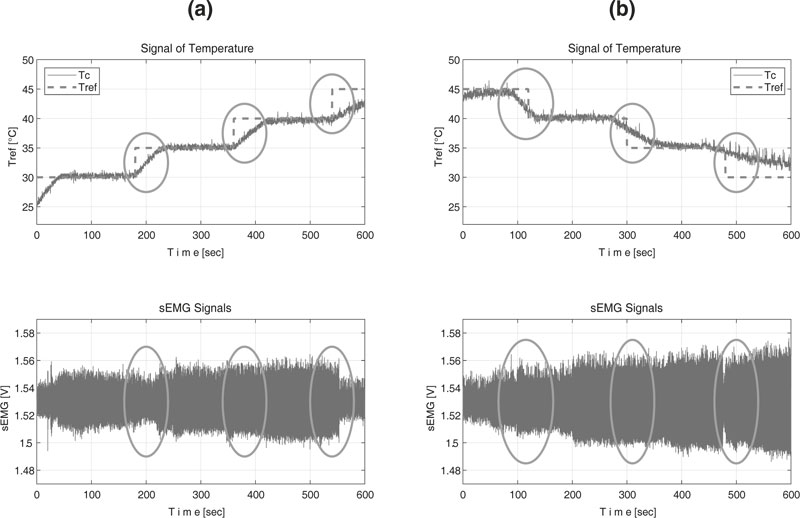
In Fig. (6), the data obtained for subjects 1(a) and 2(b) is shown, with the observed myoelectric response of the forearm to temperature variations in the hand.
The temperature variation and sEMG responses of a single subject in all six experiments are shown in Fig. (7). It can be noticed that, in the time domain, sEMG signal magnitude variation was produced while temperature variation occurred [3].

3. DETECTION
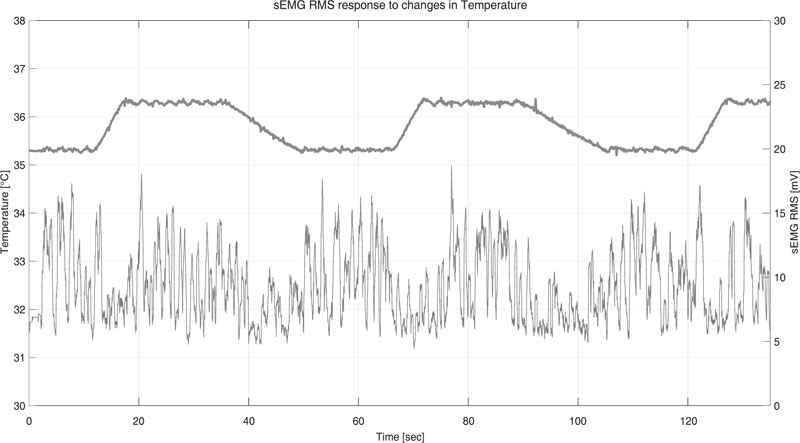
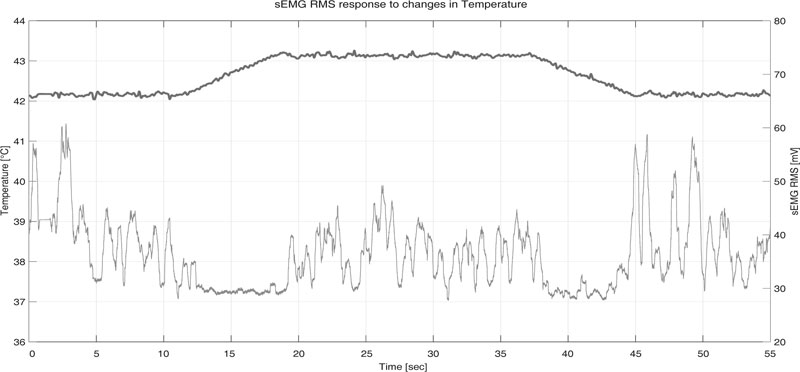
The data was obtained from subjects as described in our previous studies [8, 10, 11]. The chamber was designed to maintain temperature control. As changes occurred in temperature, the readings of the sEMG signals clearly showed changes. This is shown in Fig. (8), where it indicates how the temperature in the heating chamber varied from 35[oC] to 36[oC] approximately.
The results of sEMG data acquired from a random subject are shown in the lower part of Fig. (8). There were changes in the sEMG signals every time the temperature suffered an alteration, although these were low due to the scale used [8].

3.1. Algorithm
The Approximated Generalized Likelihood Ratio algorithm is based on the Optimal Estimator, which uses statistically optimal decision rules to detect changes in signals [11]. The Optimal Estimator evaluates the statistical properties of the measured sEMG signal before and after a possible change in model parameters [19, 20].
1) Optimal Estimator: This model assumes that the probability density function of the process yk is:
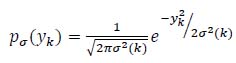 |
(1) |
The detector for the Optimal Estimator computes the maximum likelihood estimate t̂0 of the unknown onset time t 0, knowing the rest of the parameters.
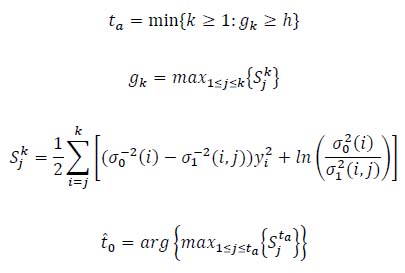 |
where σ 0 and σ1 are the standard deviations before and after a change.
This algorithm compares the log-likelihood ratio:
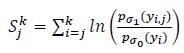 |
(2) |
between the distributions, before and after the change at time tj. with the threshold h. If the maximum Sjk exceeds h, the alarm ta is set.
This method applies the Approximated Generalized Likelihood Ratio, which searches for an abrupt change on variance by using a combination of a growing and a fixed size sliding window. This test determines whether the variances in the growing and fixed-size window are different by comparing the log-likelihood ratio with a threshold h. The time j at which the maximum value is obtained serves as the maximum likelihood estimate t̂ 0 of the unknown change time t̂ 0. In practice, σ 0 and σ1 are unknown but can also be estimated.
3.2. Approximated Generalized Likelihood Ratio (AGLR)
This method employs two test windows, one with a growing and one with a fixed-size window. Each continuously moving over the signal from the last estimated time change tm-1 to current time tk. The method is based on hypothesis Ho and hypothesis H1.
H 0: no change in statistical properties of the sequence and the variance is θ̂0 in the interval [tm-1:tk]
H1: a change in statistical properties at tk-l, and variances are θ̂a and θ̂b, before and after change, respectively.
This method compares the log-likelihood ratio between the probability density function of hypothesis H 0 and H1 with the threshold h, as described in equation 3.
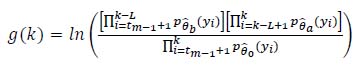 |
(3) |
where L is the length of the fixed-size window.
When g(k) > k the event alarm t͂m. is set and the sliding window procedure stops.
The g(k) function can be rewritten, for implementation purposes as:
 |
(4) |
The unknown variances before and after, (θ̂b, θ̂a), and the one corresponding to H 0, (θ̂ 0), can be calculated as:
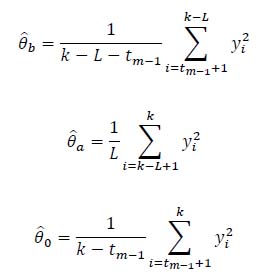 |
Analogous to the Optimal Estimator, the m-th alarm time t͂m is:
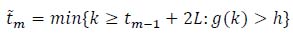 |
After an alarm occurs, tm is calculated, maximizing equation 5.
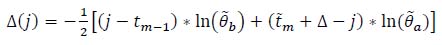 |
(5) |
where j ϵ [tm-1 + L: t͂m] and Δ is to make sure that there are still available data.
The estimated θ͂b and θ͂a are calculated for each j as follows:
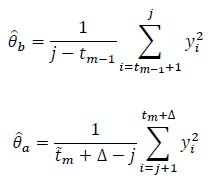 |
3.3. AGLR Results
The Universität der Bundeswehr München released a series of MATLAB scripts for the detection of muscle activation intervals from sEMG signals on their web page. For the present experiment, the function saglrstepvar.m was used. This is an AGLR detector for sequential detection of single or multiple changes in random processes. This function is defined as:
 |
(6) |
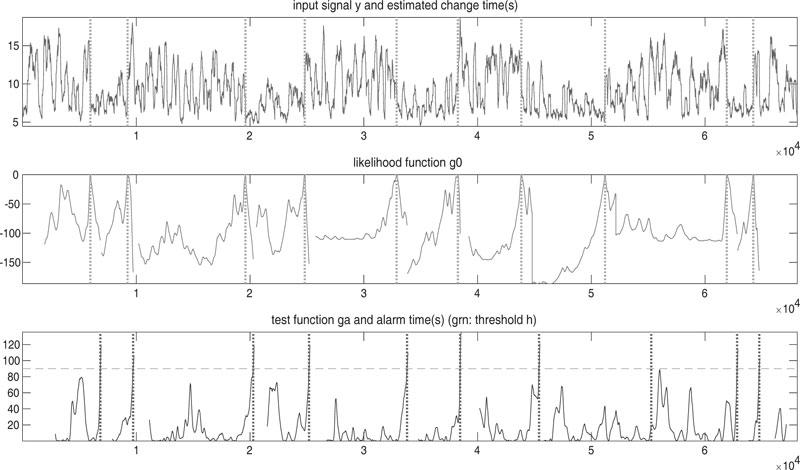
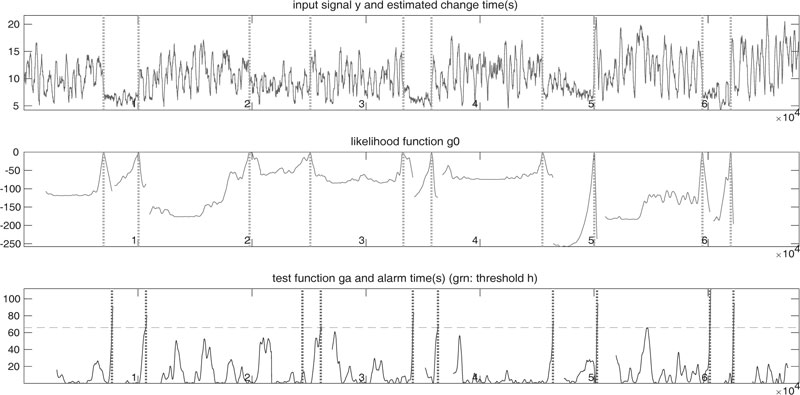
Where y is a vector with filtered sEMG data, L is the size of the sliding window, h is the detection threshold, Δ is the minimum number of samples used for Maximum Likelihood parameter estimation after the change, and mode specifies it is a 'single’ event or ’multiple’ event detection. This function returns t0 and ta as vectors with detected change and alarm time, g0 is the likelihood function for determination of change times and ga indicates the test function of stopping rule.
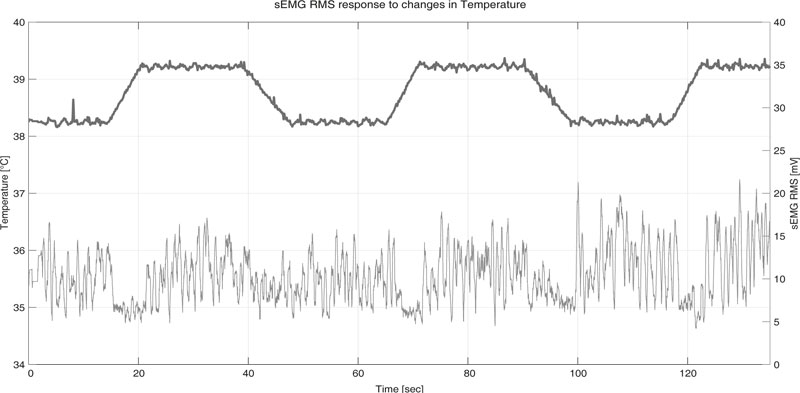
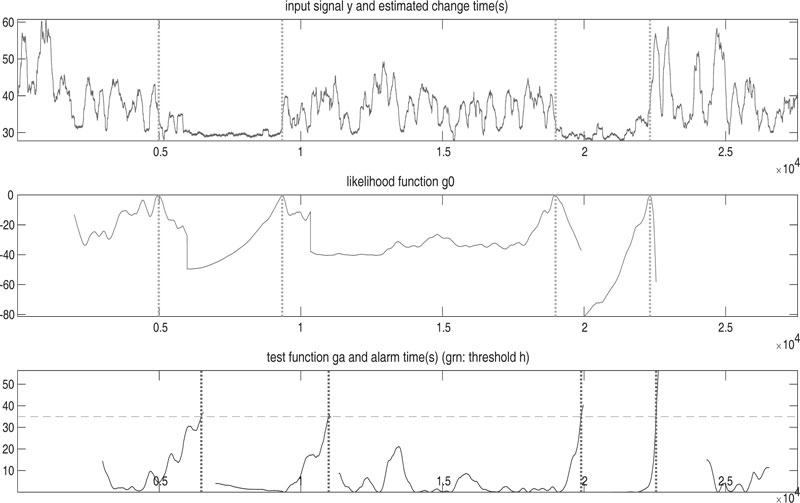
Two other tests were analyzed; these are shown in Figs. (9 and 10). It must be noticed that in Fig. (10), a single temperature variation cycle is analyzed.
Afterwards, raw data was filtered to be sent to the AGLR script. This filtering process included DC and trends removing using notch filter at 60[Hz] and 120[Hz]. Finally, with upper Root Mean Squared, RMS, the envelope was obtained [16]. This was set to be y vector.
Full parameters sent to the AGLR algorithm were:
For Test # 1: L = 960; h = 90; Δ = 80
For Test # 2: L = 1000; h = 35; Δ = 80
For Test # 3: L = 960; h = 66; Δ = 80
The results of previous studies showed the need to determine a sliding window for each subject. This was established through many samples and an estimated time in which the change occurred knowing the time when the temperature in the chamber changed [18]. Each parameter corresponds to:
- Size L of the sliding window determines the minimum distance of sequential changes.
- Threshold h is a balance between false alarms (small h) and let through small events (large h).
- The option Δ is a parameter for estimation of the maximum likelihood after the change to a minimum number of δ samples.
In Fig. (11), the result is observed after executing the software of the AGLR estimator in MatLab for Test # 1. It highlights 10 points of change with the dotted line, which will be stored in the vector of the body temperature named tcEst, for further analysis. The detail of the estimated change points is shown in Table 3.
%Error 1 and %Error 2 also appear in Tables 3, 4, 5. They are calculated as follows:
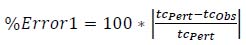 |
(7) |
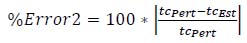 |
(8) |
Results of the AGLR estimator for Test # 2 and Test # 3 are shown in Figs. (12 and 13) with the corresponding tcEst on Tables 4 and 5.
| tc# | tcPert | tcObs | tcEst | %Error1 | %Error2 |
| tc1 | 11 | 13 | 13.2695 | 18.18 | 20.63 |
| tc2 | 17 | 19 | 19.6719 | 11.76 | 15.72 |
| tc3 | 35 | 35 | 39.9609 | 0 | 14.17 |
| tc4 | 49 | 44 | 50.1777 | 10.20 | 2.40 |
| tc5 | 66 | 64 | 66.0176 | 3.03 | 0.03 |
| tc6 | 71 | 72 | 76.5645 | 5.63 | 7.84 |
| tc7 | 88 | 91 | 87.4980 | 3.41 | 0.57 |
| tc8 | 105 | 102 | 101.8984 | 2.86 | 2.95 |
| tc9 | 121 | 120 | 122.8418 | 0.83 | 1.52 |
| tc10 | 127 | 127 | 127.4082 | 0 | 0.32 |
| tc# | tcPert | tcObs | tcEst | %Error1 | %Error2 |
| tc1 | 10 | 10 | 10.7148 | 0 | 7.15 |
| tc2 | 18 | 19 | 19.2363 | 5.55 | 6.87 |
| tc3 | 37 | 37 | 38.0938 | 0 | 2.96 |
| tc4 | 45 | 44 | 44.6094 | 2.22 | 0.87 |
| tc# | tcPert | tcObs | tcEst | %Error1 | %Error2 |
| tc1 | 14 | 14 | 15.3105 | 0 | 9.36 |
| tc2 | 20 | 21 | 21.3516 | 5 | 6.76 |
| tc3 | 38 | 37 | 40.4219 | 2.63 | 6.37 |
| tc4 | 47 | 46 | 50.8672 | 2.13 | 8.23 |
| tc5 | 65 | 66 | 66.8926 | 1.54 | 2.91 |
| tc6 | 71 | 72 | 71.7324 | 1.41 | 1.03 |
| tc7 | 90 | 87 | 90.8008 | 3.33 | 0.89 |
| tc8 | 98 | 96 | 99.7305 | 2.04 | 1.77 |
| tc9 | 115 | 117 | 118.3672 | 1.74 | 2.93 |
| tc10 | 122 | 123 | 123.2402 | 0.82 | 1.02 |
3.4. Artificial sEMG Signal Generation
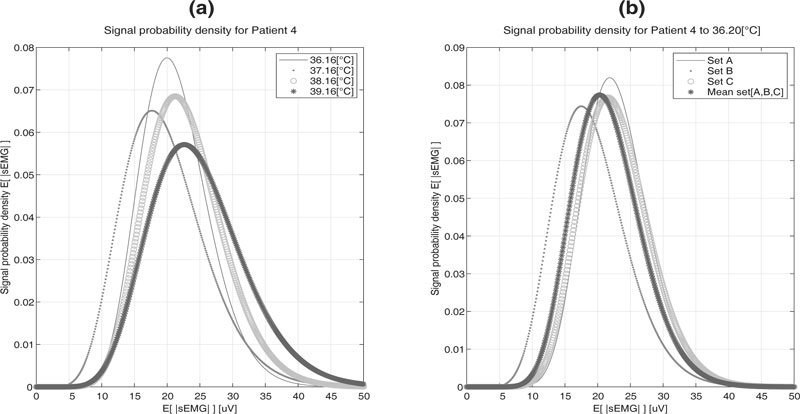
Since the change in sEMG signals of the upper extremities respond to changes in temperature, their characteristics are assessed based on the analysis of their media. A random variable of the means of the data was used as a result of the sectioning of the data. The appropriate criterion was always specified [21], which allowed representing their behavior using a Gamma function of two parameters [22], as can be observed in Fig. (14).
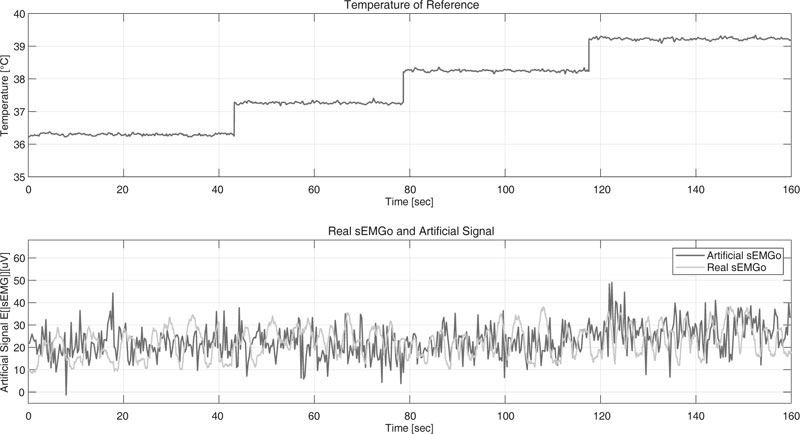
According to previous studies [23], we proceed to develop a model that allowed generating the sEMG signal artificially and whose response we appreciate in Fig. (15).
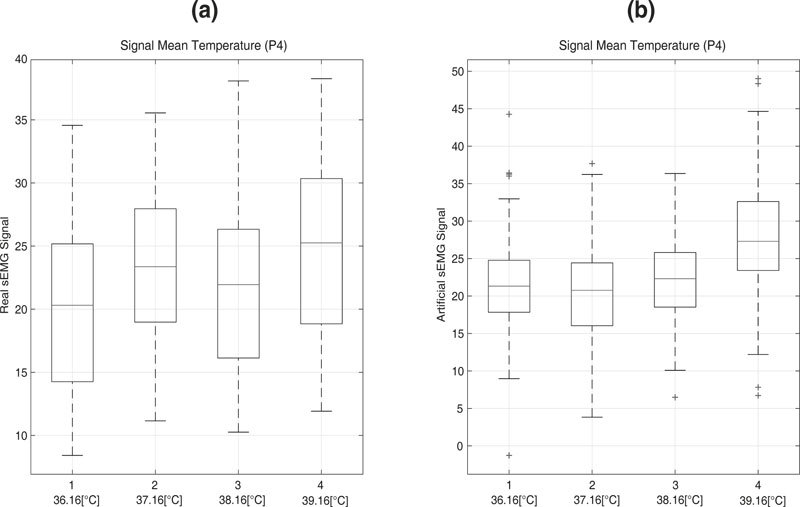
To validate the artificial signal, the real response was compared to the artificial one using a statistical analysis that may be seen in Fig. (16).
These results allowed us to determine that the artificial sEMG signal is a good representation, from the statistical point of view, of the real sEMG signal. For tests, intervals with 95% confidence for large samples were used.
4. RESULTS AND DISCUSSION
The sEMG signals acquired through the Olimex card meet the typical characteristics of these signals in the forearm in the resting state. This validates the shape of the sEMG signal. Also, any change in it will be the product of an external variable. In our case, the temperature is the external variable because it is the only parameter that is changed throughout the experiment. This may be expressed in the function |sEMG| = f (T, Others).
Due to the behavior of the data, this study seeks to obtain a relationship between |sEMG| and T, and to establish the behavior of |sEMG| before changes in temperature, by means of the Gamma probability density function. This may be used for the characterization of the relationship between |sEMG| and T by developing an emulator of these signals to be able to compare against the real ones.
CONCLUSION
The heating chamber fulfills the function of keeping the temperature constant, which allows manipulating the reference signal applied to test subjects.
The responses obtained from the test subjects show that there are changes in the sEMG signals when temperature changes, which allow us to consider that there is some kind of relationship between them.
The values of the time change obtained from observation tcObs and the AGLR estimator tcEst are very close to the moment when the disturbance is introduced tcPert. Therefore, one may affirm that the sEMG signals depend on the temperature.
The artificially generated signal is a good representation of the real signal |sEMG|. This may be used as a contribution to future research in the biomedical field, for example, to simulate the lost characteristic of environment’s thermal perception (temperature) in prostheses.
For future studies, two elements need further research and analysis. On one hand, the effect of the BMI and the BFP of the subjects of the experiments must be explored for populations with specific characteristics, like athletes. On the other hand, the effect on the sEMG signals of the environment and the body temperature outside the chamber must be subject to deeper analysis.
ETHICAL APPROVAL AND CONSENT TO PARTICIPATE
Not applicable.
HUMAN AND ANIMAL RIGHTS
Not applicable.
CONSENT FOR PUBLICATION
The authors confirm that the "patients" are voluntary participants in the research since in this study the experiment consists of the application of controlled external non-invasive temperature to the arms of the participants.
AVAILABILITY OF DATA AND MATERIALS
Not applicable.
FUNDING
None.
CONFLICT OF INTEREST
The authors declare no conflict of interest, financial or otherwise.
ACKNOWLEDGEMENTS
The author would like to acknowledge the contribution of the ESPOL in supplying the premises where the study took place. Also, the team of collaborators should be acknowledged for their valuable performance in the development of this project and for the creation of a lawful research group at the University. Finally, a special recognition is due to each student who volunteered as a subject of the experiment and being a part of this research group.

