All published articles of this journal are available on ScienceDirect.
Numerical Computational Study of Photoacoustic Signals from Eye Models to Detect Diabetic Retinopathy
Abstract
Introduction:
Detection of Diabetic Retinopathy (DR) is essential in clinical ophthalmology as it may prevent sight degradation. In this paper, a complete Photoacoustic (PA) analysis is implemented to detect DR in three different eye models representing a healthy eye as well as two abnormal eyes exhibiting Non-Proliferative Retinopathy (NPDR), and Proliferative Retinopathy (PDR)
Methods & Materials:
Monte Carlo method was used to simulate the interaction of a 0.8 ns duration laser pulse with eye tissues at 750 nm wavelength. Thermal, structural and acoustical analyses were performed using the Finite Element Method (FEM).
Results:
The results showed that there is a significant change in the amplitude of the detected PA signal for abnormal eye tissues in the retina (P < 0.05) as compared to healthy eye tissues. The maximum amplitude of the received PA signal in the NPDR and the PDR eye models is 5% and 33%, respectively, which are greater than those observed in the healthy eye.
Conclusion:
These results may provide insights into using PA imaging to detect DR.
1. INTRODUCTION
The number of diabetic patients suffering from Diabetic Retinopathy (DR) has increased recently. World Health Organization (WHO) has estimated that DR is the fifth leading cause of visual impairment and the fourth leading cause of blindness in the world [1]. DR is a microvascular disease classified as non-proliferative diabetic retinopathy (NPDR), in its earliest stage, and proliferative diabetic retinopathy (PDR) as the disease progresses. NPDR is characterized by the appearance of different types of retinal abnormalities that include redish circular Microaneurysms (MAs), Hemorrhages (HEMS)due to the rupture of damaged retinal blood vessels and yellowish exudates due to intra-retinal fluid deposits [2]. On the other hand, PDR is characterized by the growth of abnormal blood vessels which extend over the surface of the retina. Early detection of DR is of major importance to prevent further progression of eye disease and vision loss. Various retinal imaging modalities such as fundus imaging [3] and fluorescein angiography [3] are used to detect DR. Angiography is considered as invasive, where fluorescein is injected into a vein which inflicts pain and creates potential complications. Therefore, there is a need to propose a noninvasive imaging technique capable of detecting contrast between the retina tissues and retinal abnormalities. Photoacoustic Imaging (PAI) is a non-invasive imaging modality that combines the advantages of optical excitation and acoustic detection. In PAI, the laser pulse is applied over the targeted region. Accordingly, the photons’ energies are absorbed by the tissues causing instantaneous thermal expansion followed by shrinking that generates an acoustic wave called PA wave. Up to 2010, various studies have reported the ability to image ocular tissue using Photoacoustic imaging [3]. Silverman et al. [4] demonstrated PA imaging of the anterior segment (i.e., the cornea, the lens, and the pigmented iris) in ex-vivo pig eye while Hu et al. [5] imaged the peripheral ciliary processes, major iris circle, radial iris arteries, and even a single capillary with resolution down to a few micrometers (6 µm). La Zerda et al. [6] imaged both of the anterior segments of the eye and the posterior ocular chamber tissues such as retina, choroid, and blood distribution in the eye posterior. These studies were able to image a certain part of the ocular tissue experimentally, using different set-ups and light source wavelengths. On the other hand, numerical simulations are considered powerful tools for studying and designing the proper set-up for PAI as well as saving prototype time. To the best of our knowledge, this paper proposes the first computational study employing the PA technique to distinguish between a healthy eye model and abnormal eye models exhibiting NPDR and PDR. Monte Carlo simulations were used to compute light absorption maps in different eye models. The FEM was used to perform PA computations. Our results show that there is a significant change in the detected PA signals due to abnormality growth in the retina.
2. MATERIALS AND METHODS
2.1. 3-D Modeling
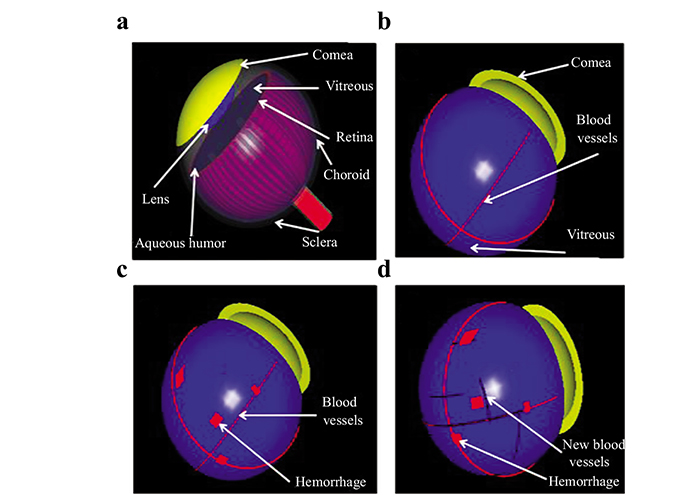
We constructed three human eye models based on literature anatomical data [7]. The eye models consisted of seven structures: cornea, crystalline lens, aqueous humor fluid, vitreous body, retina, choroid, and sclera (Fig. 1a). The first model (case 1), represents a normal eye with four retinal blood vessel branches, each having a diameter of 0.2 mm (Fig. 1b). This model was further modified by adding a random distribution of small blot HEMS with dimensions of (0.1mm × 0.2mm × 1mm) and spherical MAs of diameter 0.1 mm representing NPDR eye (case 2) (Fig. 1c). Finally, the third model (case 3) exhibited an additional formation of small new blood vessels having a diameter of 0.1 mm representing the PDR eye (Fig. 1d).
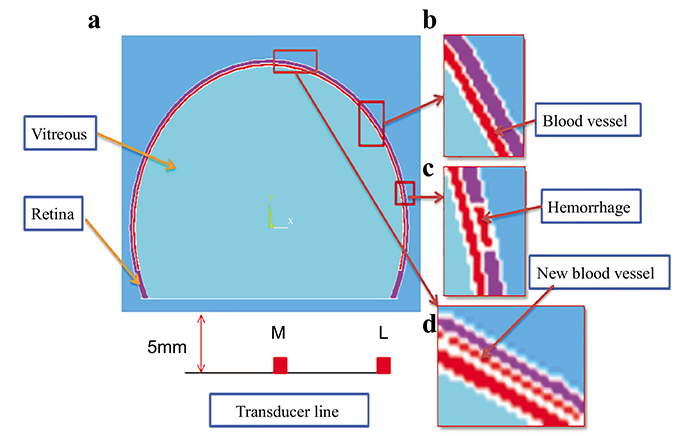
Eye model cases have been generated based on diabetic High-Resolution Fundus images [8, 9], and consultation with ophthalmologists to verify the validation of our models for each case. The dimensions of the retina, blood vessel and HEMS blots were scaled for reasonable computational time. A 2-D cross-section was extracted from the 3-D models and used to simulate the thermal, structural and acoustical propagation in this study as shown in Fig. (2). A linear transducer with a central frequency of 10 MHz was simulated to detect the PA signals.
2.2. Laser Light Transport Through The Eye
Monte Carlo method for light propagation was used to compute the photon transport in the three models in which absorption and scattering occur. The procedure describing the simulation is reported in detail elsewhere [10]. Each eye model has been used to calculate the distribution of the absorbed energy in tissues for illumination by a laser light source that covers a circular surface of radius 5 mm at a wavelength (λ) = 750 nm, which provides discrimination between normal and diseased eye tissues. The laser source sends out a Gaussian pulse density equal to 0.45m J/cm2, which is considered to be below the eye safety limit [11], and has a duration length τ = 0.8 ns. Seventy-five million photons were randomly generated to obtain accurate calculations. The light source is positioned at the cornea and focused inside the eye using a convex lens. The photons interaction with different media in each eye model was simulated based on their corresponding optical properties. Table 1 summarizes the optical properties of different eye structures at the selected wavelength [12-15]. We used the absorption coefficient of water to represent the vitreous fluid [16].
2.3. Heat Transfer of Laser Light
A commercial finite element analysis program (ANSYS 19) was used to compute the local increase in temperature. The thermal module takes into account the geometry being modeled, thermal properties, and the appropriate boundary conditions [17]. The FE method was used to divide the geometry into a mesh consisting of thousands of tetrahedral elements of various sizes. The technique uses second-order quadratic polynomials to approximate temperature values in each tetrahedral element and computes these quantities by minimizing an energy functional till the solution reaches the desired accuracy. The temperature in blood vessels changes as a result of the absorption of light energy. This change in temperature distribution can be described by the following bio-heat Eqs. (1 & 2) [18]:
 |
(1) |
 |
(2) |
Where ρ is tissue density, C is specific heat capacity, k is thermal conductivity, T the temperature, H serves as the heat source term representing the heat generation rate (W/m^3), µa is optical absorption coefficient, and ϕ is the fluence rate (W/m^2), the deposited energy within the object. The blood perfusion effect is ignored in the simulation because the laser shining time is less than the thermal confinement time [18]. The thermal properties of the eye structures used in our finite element analysis are listed in Table 2 [19, 20].
| Tissue | μa(mm-1) | μs(mm-1) | N | g |
| lens | 0.0003 | 0.2700 | 1.36 | 0.90 |
| Cornea | 0.0005 | 0.2200 | 1.37 | 0.90 |
| Vitreous | 0.0001 | 0.0001 | 1.47 | 0.90 |
| Retina | 0.0230 | 10.330 | 1.35 | 0.97 |
| Blood | 0.2000 | 14.000 | 1.35 | 0.84 |
| Choroid | 2 .700 | 48.400 | 1.40 | 0.90 |
| Sclera | 0.0400 | 61.400 | 1.40 | 0.90 |
| – | – | Thermal Properties | |
| Tissue Name | Density (kg/m3) | Conductivity(W/m.k) | Specific Heat Capacity (J/Kg.k) |
| Retina | 1000 | 0.565 | 3680 |
| Blood Vessel | 1060 | 0.505 | 4186 |
| Vitreous | 996 | 0.578 | 4180 |
2.4. Thermal Expansion
As a result of temperature changes within blood vessels, the blood vessel walls undergo thermoelastic expansion during temperature rise and shrinking as the temperature drops. This process can be described by the displacement Eq. (3) [18]
 |
(3) |
where u is the displacement (m), E is Young’s modulus, σ is the Poisson’s ratio, and β is the thermal expansion coefficient. The mechanical properties of the eye tissues used in our simulations are presented in Table 3 [21-23].
| Mechanical Properties | Acoustic Properties | |||
| Tissue Name | Young’s Modulus (x105 Pa) | Poisson Ratio | Thermal Expansion (x10-5 K-1) | Sound Speed (m/s) |
| Retina | 0.20 | 0.490 | 1.40 | 1550 |
| Blood vessel | 2.00 | 0.490 | 1.40 | 1584 |
| Vitreous | 4.20 | 0.495 | 0.25 | 1540 |
2.5. PA Signal Propagation
The retinal blood vessel's expansion and shrinking results in the generation of an acoustic pressure wave that can be detected by a linear transducer placed at the eye surface. The acceleration in the blood displacement is converted into initial pressure (p) based on the following conversion Eq. (4) [18].
 |
(4) |
Where un is the displacement in the direction of the wave propagation. The initial wave propagates through the medium based on the homogeneous wave Eq. (5) [18].
 |
(5) |
Where vs is the sound velocity in different eye media as depicted in Table 3 [24, 25]. The sparse solver was used to calculate the displacement and the propagating PA pressure waves. The number of FE nodes and elements for model 1, 2, and 3 were (115036, 114900), (115933, 115350), and (119623, 115607), respectively. The mean and standard deviation of the mesh quality for the three models were: (0.8733 ± 0.0629, 0.8728 ± 0.0678, and 0.8724 ± 0.0689).
3. RESULTS AND DISCUSSION
3.1. Optical Absorption Map for The Eye Models
Fig. (3) shows a contour plot of the optical absorption in different eye structures of model 1. Fluence in the anterior chamber tissues, at the wavelength of 750nm, was 5.6% of fluence computed in posterior chamber tissues. This observation is due to the small absorption coefficients of the lens and cornea compared to the retina, and choroid. In the near-infrared region, the lens and the cornea act as transmission media for light propagation. Therefore, we simplified the eye tissue models to consist of vitreous, retina, and blood vessels only. The optical absorption maps computed in eye model structures over time are shown in Figs. (3a-3d). It is worth noting that the photons reach the posterior side of the eye at 0.65 ns, while very small absorption values are observed at 1ns in eye tissues. Therefore, a time-duration of 0.8 ns was selected to illustrate the results. The optical fluence spatial distribution inside the normal eye model and the two abnormal models representing NPDR and PDR eye diseases is shown in Fig. (4a). The retinal blood vessels in case1, and the microaneurysms and small blot hemorrhages in case 2 and the smaller blood vessels and hemorrhages in case 3 showed higher percentage fluence compared to the surrounding retinal tissues: (46%, 55%, 85% respectively). This observation is attributed to the difference in the absorption coefficients of the retina and blood. Although the choroid tissue has a high absorption coefficient, it has lower fluence compared to blood due to its position being farther from the laser light source behind the retina.
It is worth noting that blot hemorrhages placed at the center of the retina show high optical fluence compared to those placed at the periphery of the retina (Fig. 4b). This is due to the central retinal hemorrhages being in the focus of the laser light. The optical fluence results were scaled to compensate for the effect of the eye model dimensions, being larger than the real eye dimensions. To address this effect, several simulations were performed and a scaling factor was used to compute fluence.
3.2. PA Signals from Eye Models
Fig. (5) shows the 2-D time evolution of the propagation of the PA wave at different time instants for the three eye models. Absorbed light energy by centrally located blood vessels, hemhorrages and new vessels are higher than the absorbed energy by those located at the periphery, thus exhibiting maxima in the PA wave pattern at 1.5 ns. As time evolves, the generated PA wave, focused by the retina, tends to propagate in the vitreous fluid towards the transducer, as shown in the lower row of Fig. (5).
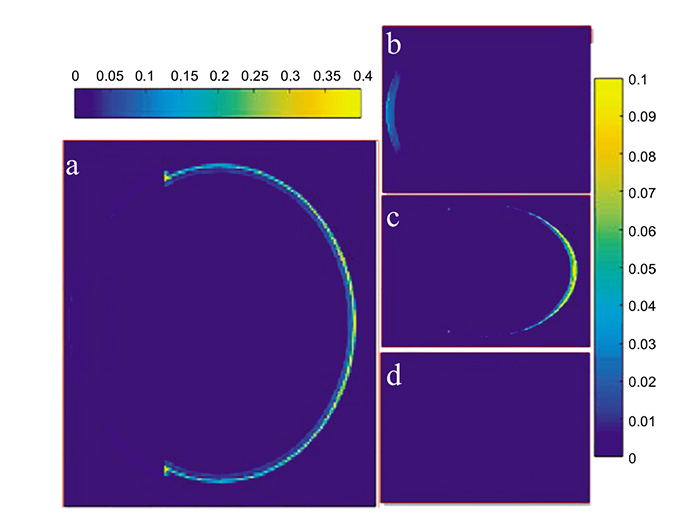
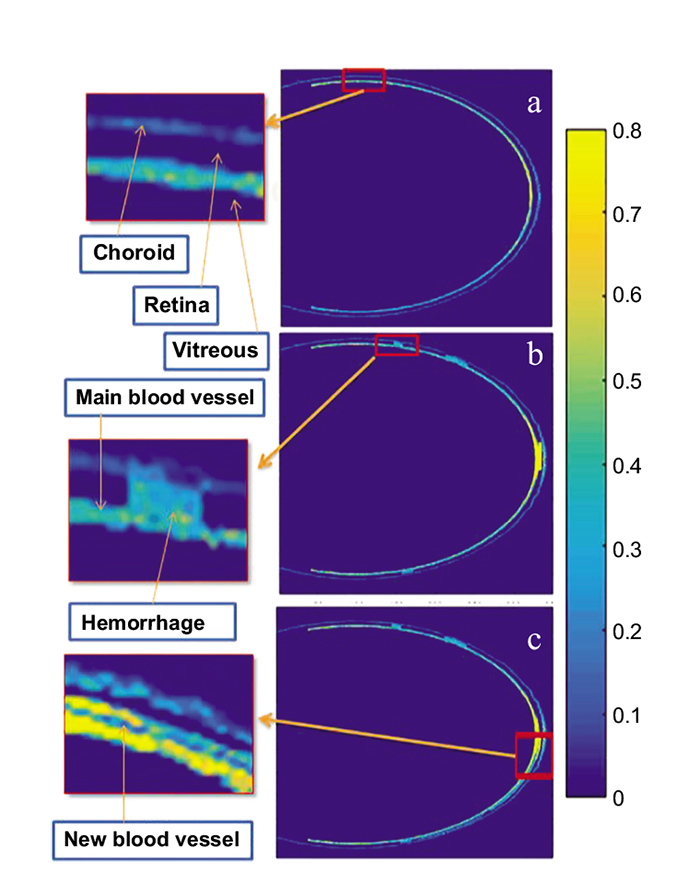
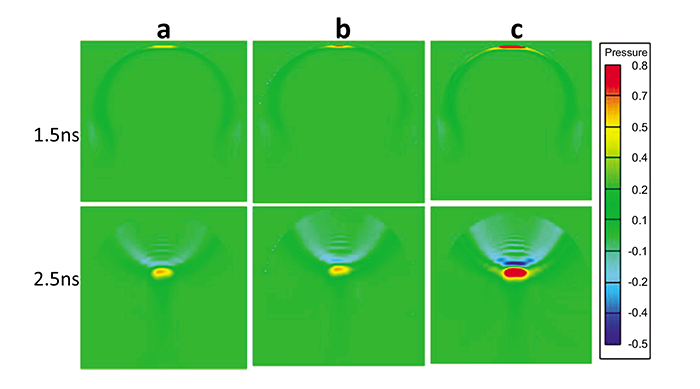
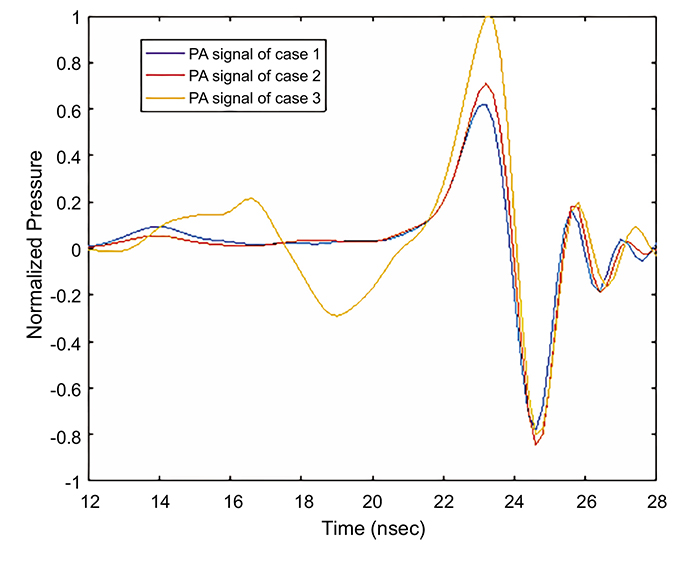
Fig. (6) shows the received PA signal for each model by the central transducer element that was placed 5 mm from the retina. It was observed that the maximum amplitude of the PA signals in case 2 and case 3 are 14.5% and 59.75% higher than the maximum amplitude in case 1. The Normalized full-width half-maximum (FWHM) of the main positive PA signal is higher for case 3 and case 2 as compared to case1, having values of 1: 0.9645: 0.8511, respectively. This is attributed to the accumulation of the received PA wave by the central element of the transducer, as this accumulation in case 2 and case 3 is higher than that in case 1. Note that the positive cycle of the PA signal was generated during the expansion process of the blood vessels and abnormalities, while the negative cycle was generated during the shrinking process of the blood vessel. The received PA signals were scaled to compensate for the effect of the eye model dimensions, being larger than the real eye dimensions.
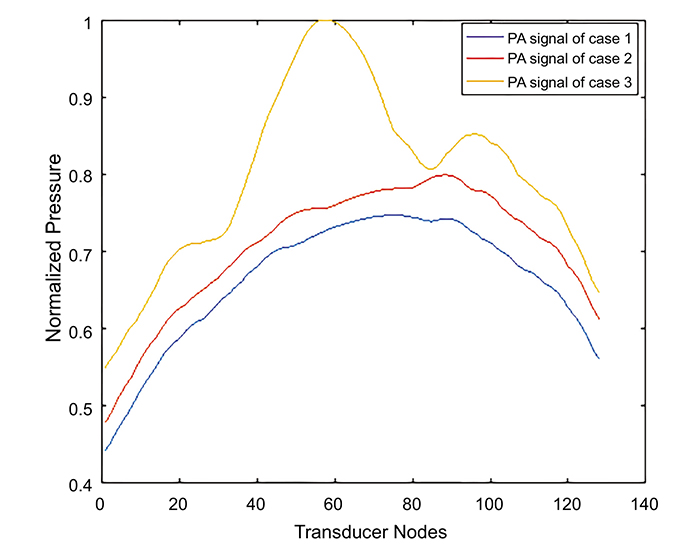
The received PA signal by the lateral element of the transducer elements for the three cases is shown in Fig. (7). The maximum amplitude of the received PA signal in case 2 and case 3 is 5% and 33% greater than the observed value in case1. Case 3 had the highest received PA signal amplitude due to the presence of the new small blood vessels and blot hemorrhages. It has also been observed that the PA signal in case3 exhibits a drop in the PA signal at 19 ns due to the presence of a small blood vessel abnormality to the right of the center of the retina, as shown in Fig. (4c). Although the eye exhibits a complex retinal microvascular network especially in DR eyes [26], our models used a smaller number of blood vessels compared to the real eye anatomy. Increasing the number of blood vessel branches in our models will increase the amplitude of the photoacoustic signal. This PA signal will be analyzed and differentiated from the PA signals of other blood branches according to the blood vessel location as well as the time the signal reaches the transducer. It is worth noting that the absence of the lens and cornea did not significantly affect the received PA signals, therefore, these structures were neglected to reduce the computational effort. A t-test was performed to find out whether there was a significant difference between the PA signal corresponding to the normal eye versus the NPDR as well as the normal eye versus the PDR eye diseases. The computed P-values were found to be significantly different between case 2 and case 1 (P = 0.0091) as well as case3 and case1 (P = 0.0013) reflecting the ability to differentiate between the normal eye and the diseased eye (P < 0.05). Although the PA phenomenon is actually of a 3-D nature, where each point on the surface of the PA source participates in the final PA signal in the back-propagation imaging, a linear transducer with anisotropic detection response will practically be used to reconstruct a 2-D PA image [27]. In fact, any signal from out-of-plane sources will be relatively rejected, while the detector will give a high response to the signal that is coming from the perpendicular plane to the transducer. Therefore, a 2-D model was used to simulate the thermal and acoustical propagation in this study. Further sensitivity analysis, to incorporate the effect of changes in optical and material properties on our results, would be the focus of future studies.
CONCLUSION
In this work, the ability of PA technique to detect DR through building a numerical package to simulate a complete photoacoustic (PA) study has been discussed. The Monte Carlo method was used to perform the light propagation and FEM was used to perform PA wave generation. The Monte Carlo results demonstrated that there is a high contrast between retina and blood vessels and abnormalities at 750 nm wavelength. The FEM results showed that there is a significant change in the detected PA signals due to the abnormality growth in the retina. Our study may lay a foundation to use PAI as a powerful imaging modality for the diagnosis of diabetic retinopathy.
ETHICS APPROVAL AND CONSENT TO PARTICIPATE
Not applicable.
HUMAN AND ANIMAL RIGHTS
No animals/humans were used for studies that are basis of this research.
CONSENT FOR PUBLICATION
Not applicable.
AVAILABILITY OF DATA AND MATERIALS
The authors confirm that the data supporting the findings of this research are available within the article.
FUNDING
None.
CONFLICT OF INTEREST
The authors declare no conflict of interest, financial or otherwise.
ACKNOWLEDGEMENTS
The authors acknowledge the Research Institute of Ophthalmology in Egypt.

