All published articles of this journal are available on ScienceDirect.

Performance Analysis of Fuzzy Multilayer Support Vector Machine for Epileptic Seizure Disorder Classification using Auto Regression Features
Abstract
Background:
Around 1% of the total population in the world suffers from epilepsy, a central nervous system disorder. Epilepsy is the neurological disorder of the human brain which can affect people of all ages. Classification techniques and Signal processing are basic methods in the advancement of an algorithm for seizure detection. The primary procedures of a typical biomedical evaluation and processing framework are data acquisition, feature extraction, preprocessing, and classification. Based on this, seizure detection is performed by using the following two methods.
Methods:
This paper proposes a technique for the classification of EEG signals to detect the epileptic seizures by using Cascade Forward Backpropagation Neural Network (CFBNN) and Fuzzy Multilayer Support Vector Machine (FMSVM) methods.
Results:
Finally, the results of developed classifiers are identified with seizure disorder activities. This research concentrated on Parametric Features such as AR (Autoregressive) Burg, AR YuleWalker, AR Covariance, AR Modified Covariance, and Levinson Durbin Recursion. Linear Prediction Coefficient was analyzed with the EEG dataset gathered from Karunya University. The sensitivity, specificity, and accuracy were calculated for the proposed classifiers.
Conclusion:
The results of the proposed classifiers were computed with minimum and maximum accuracy and these results were compared with the previous results of the classifiers like FFNN, and PNN as shown in the tables. Based on the obtained outputs and calculated parametric functions, the results validated that the FMSVM classifier performed better in the detection of epileptic seizure disorder in terms of accuracy, sensitivity and specificity.
1. INTRODUCTION
Epilepsy, the second most critical neurological disorder in humans after stroke, is a perpetual state of the nervous system and it is distinguished by recurrent unprovoked seizures. Around one in every 100 people globally is affected by epilepsy. Electroencephalography (EEG) is a significant medical device for diagnosing, observing and directing neurological disorders incidental to epilepsy. In comparison with different strategies, for example, Electrocorticogram (ECOG), EEG is a safe and clean system for observing brain actions [1]. The side effects of epilepsy are distinguished by recurrent and impulsive seizures, called epileptic seizures, caused due to extreme neuronal activities in the brain.
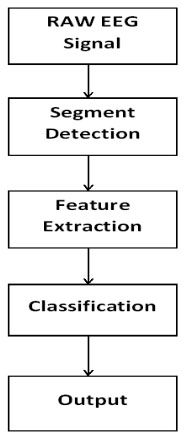
Epileptic seizures adversely affect physical and mental conduct, causing critical social maladaptation and even death. The etiology of epilepsy is known to have lesions in the brain and genetic anomalies, resulting in hindered neuronal regulation. Though, epilepsy could likewise be induced by obscure factors that are hard to detect. The prognosis and diagnosis of epilepsy are reliant on the elucidation of neuronal actions in the cerebrum. Thus, the identification of epileptic signs integrated in neural action is more vital. Because of its simplicity and effectiveness, Electroencephalography (EEG) has been generally utilized in epilepsy research [2]. The analysis of epilepsy can be subdivided into preprocessing, extraction of features, and classification. The reason behind seizure identification is to detect seizures with the most conceivable accuracy [3], Fig. (1).
In EEG data recording, an EEG device is attached to the patient which gains the information over electrode terminals fixed on the scalp of the head. The signals acquired were in the range of low microvolt that is changed into processable range and digitized by A-to-D converter. The EEG functions non-intrusively, includes more data about various physiological conditions of the brain , as well as some undesirable signals known as artifacts. Despite the fact that EEG is an imperative medical device for diagnosing, observing and overseeing neurological disorders, particular challenges incidental to EEG analysis and interpretation, which impeded its far-reaching proficiency .
1.1. EEG Epileptic Seizure Database
The databases (EEG signal) for this research were collected from Karunya University. The performance results are compared with K-means, Navies Bayesian and Neural Network with respect to the parametric method. The features were extracted by applying feature extraction methods and the extracted features were classified by implementing the Elman Neural Network.
The EEG data utilized in this research was obtained utilizing 10-20 electrodes, specified by the standard international framework. The EEG data was downloaded from the database discovered in the link http://karunya.edu/ research/EEGdatabase/public/view_all.php. The data were recorded from 18 channels (2 periocular electrodes and 16 scalp electrodes, with reference to right and left mastoid) at a sampling rate of 256 Hz with analog passband of 0.01 to 100 Hz. Before setting the electrodes, the scalp was arranged in order to contact impedance below 5kΩ. EEG data generation had a 10-second term, involving 2560 data points, all having 4-ms duration. This database contains data on clinical status of the patients [3].
1.2. Selection of Leads
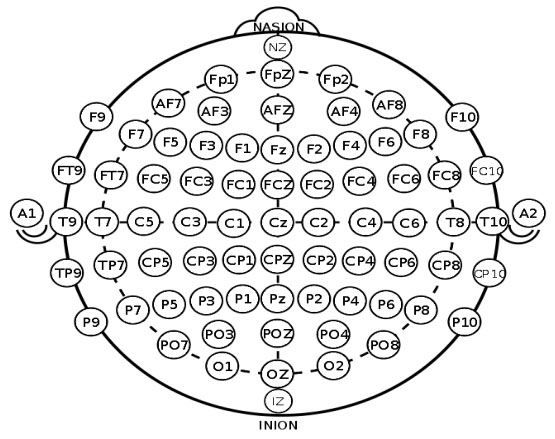
The recording of the EEG signal consisted of 32 channels that were acquired by placing metal electrodes on the scalp region. The position of the electrodes was indicated in the standard 10-20 electrode placement system. For this study, 8 channels were selected from Frontal Pole to Occipital region covering both the hemispheres of the cerebral cortex. During the onset of epileptic seizures, the cerebral functions of the human brain showed less randomness. This was captured by the EEG electrodes and transmitted to the detection system for processing. Fig (2) exhibits the 10-20 EEG lead placement system that is used for data acquisition [3-5].
1.3. Pre-processing
The pre-processing stage separated the input EEG data into different multichannel signals. The 8 signals corresponding to FP1-F3, F3-C3, C3-P3, P3-O1, FP2-F4, F4-C4, C4-P4 and P4-O2 were used for the detection of epilepsy in this study . The selected lead locations are highlighted in Fig. (2). The channels were sampled at 256 Hz and are noise-free. The data sets used for training and testing the classifier had the same time duration of 60 sec [3-5].
An extensive analysis of the brain signal could expose the decrease in the randomness of the EEG signal as the count of neurons comprising brain functions decreased during epileptic seizures. This characteristic nature of Epilepsy is used as an important classification rule in the system [3-5].

1.4. Feature Extraction
Generally, feature extraction is the process inspiring important features from a set of signals that inclines suitable classification and disease analysis. A measure which indicates the level to which the ups and downs of a wave vary on an average out of the mean voltage was said to be a SD. Since decomposing the signal, some important features could be extricated utilizing the SD. For dissecting the statistical feature of a signal, the signal's mean must be calculated. It can likewise be stated that the value of mean is the average estimation of a signal.
The feature extraction procedure is used to discover the average accuracy of the framework. The accompanying coefficients like Autoregression (AR) Burg, AR Covariance, AR Yule-Walker technique, AR Modified Covariance, Linear Prediction Coefficient, and Levinson Durbin Recursion were chosen for validation of the extraction procedure. It reduces the EEG structures and modules dependent on the training procedure.
2. RELATED WORKS
Rafiuddin et al., proposed Feature Extraction and Classification of EEG for Automated Seizure identification. One of the numerous difficulties in the automatic identification of epileptic seizures was to draw a line of division among non-seizure and seizure action. For performing this operation, detection of incidental features and their extrication out of the EEG play a key part. The research exhibited in this study is a segment of a general exertion proceeding to build up another technique for automatic identification of seizures. A wavelet-related feature extrication strategy has been discovered. Statistical features, Median Absolute Deviation (MAD), and Inter-Quartile Range (IQR) additionally frame some portion of the feature vector. The algorithm was assessed on 23 individuals with 195 seizures. The outcomes provided a normal detection precision of 96.5%. The database utilized was the CHB-MIT scalp EEG database [6].
Nicoletta Nicolaou and Julius Georgiou, have proved a significant design in the review for the identification of epilepsy. This work examined the utilization of Permutation Entropy (PE) as the feature for automatic epileptic seizure identification. SVM was utilized to classify fragments of typical and epileptic EEG dependent on values of PE. The presented framework presented the way that the EEG epileptic seizures were described by less PE than ordinary EEG. It has produced average sensitivity of 94.38% and specificity of 93.23% was acquired by utilizing PE as the feature to describe epilepsy and EEG without seizure, while 100% specificity and sensitivity were additionally acquired in the classification of a single trial [7].
B. AL-Bokhity et al., designed a smart diagnosis system for the classification of EEG which enhances the proficiency and precision of the diagnosis. Such a system required a solid learning capacity for managing the information. Diagnosing epilepsy was difficult as it required the perception of the individual and the EEG. Likewise, the collection of more medical data was required. The prescribed method included training the FIS classifier for detecting an epileptic seizure by means of utilizing the four types of EEG. These types of EEG were called as Information of the Healthy individuals, the Epileptic individuals all through without a seizure interval, the Epileptic individuals all through a seizure interval (focal), and the Epileptic individuals all through a seizure interval (Non-focal). Initially, it explained the usage of the Short-Time Fourier Transform (STFT) for denoising the signals through processing the STFT of the noise signals. they comprise of a threshold on the STFT and inverse STFT. Also, statistical features were extricated out of the wavelet sub-bands of the EEG signals. At that point, they were treated as the contributions of the FIS classifier. In this research, a huge dataset was utilized with a combination of two databases. The precision of detecting the FIS classifier was 96% throughout this application [8].
Dabye et al., proposed localization of epileptic seizure with a method dependent on the PSD with the autoregressive model. In this study, they presented a model dependent on the review of EEG signals through the mean of the conventional PSD in the target to restrict and identify the epileptic region of the brain. Initially, as the EEG signals were regularly non-stationary , they prepared the data with the method of separation so as to have the stationary which is advantageous to demonstrate with the autoregression model (AR). For this, they utilized numerous methods to decide the order which demonstrated better data in this work. Hence, they classified normal and abnormal action which compares epileptic release of the patient. This work contributes to the automatic recognition of epilepsy seizure with the PSD novel methodology by a fine resolution in the frequency domain as the examination of EEG signals is regularly completed with visual assessment of the rhythm (delta, theta, alpha, beta, and gamma) by neurologist experts. The precision of the recognition is evaluated at 70% with a sensitivity of 80.55% [9].
3. MATERIALS AND METHODS
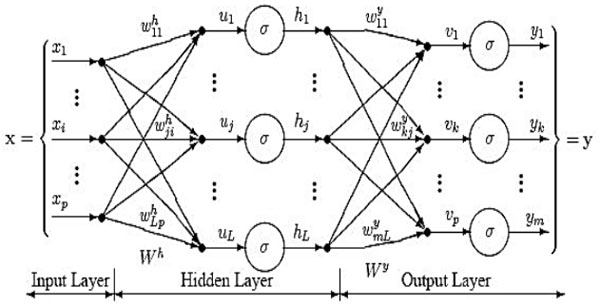
This paper proposes a technique for the classification of EEG signals to detect epileptic seizures by using CFBNN and FMSVM methods Fig. (4).
3.1. Cascade Forward Backpropagation Neural Network (CFBNN)
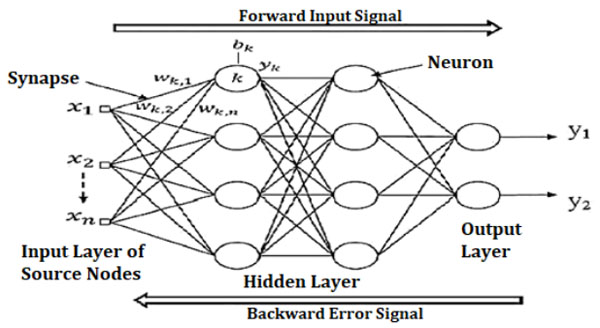
CFBNN is similar to Backpropagation Artificial Neural Network (BPANN) which uses the Back Propagation algorithm for updating weights. CFBNN has a weight connection from the input to every layer and from every layer to the following layers. The network activation flow was one-way only, from the input to the output layer passing over the hidden layer. Fig. (3) presents a three-layer network that has links from layer 1 to layer 2, layer 2 to layer 3, and layer 1 to layer 3. More connections may enhance the speed at which the network recognizes the required relationship. Back propagation algorithm is used for updating weights. The errors propagate backward from the output nodes to the input nodes [10].
Fig (5) demonstrates the architecture of CFBNN. In this architecture, the neurons in each layer relate to the neurons in the past layer. The layers of the cascade neural networks are active in quality. With regard to cascade networks, with the support of one neuron, learning is initiated amid the training stage, the learning algorithm includes new neurons subsequently making a multilayer architecture. If the training error diminishes, it suggests that the aggregate number of hidden layer of neurons increments in a well-ordered manner. The development of the network is controlled by the learning algorithm. For the enhancement of the loads in the network, two training algorithm, Levenberg-Marquardt and Bayesian control back propagation algorithms are utilized. It can result in a quick learning rate when the availability is controlled inside the network [11 – 15].

3.2. Fuzzy Multilayer Support Vector Machine Classification
Data classification is the way toward classifying and ordering the data into various types, classes, and different structures. To create a different objective, the classification and partitioning are facilitated by the classification of data according to the points of data. To separate whether the subject is epileptic or not, classification of data has been conducted . For accumulating data and various strategies, data classification is an important approach. To classify the epileptic seizure in this unit, FMSVM technique has been used. Fuzzy rule optimizes the MSVM parameters to improve the MSVM execution.
For performing different operations, feature extraction and pre-processing were conducted in the EEG signals. Uncontaminated non-cerebral artifacts are the significant issue obtained in clean information on brain activity. A hindrance was created during the task of decision-making , while occurrences of artifacts were detected in the EEG signals. Eyeblink and body movements or certain sources like electrical impedances were created by the subject during the process of data acquisition.
The proposed three-class classification of epileptic seizures is assigned a class label of yϵ(0,−1,+1), where 0, +1, and -1 represents seizure disorders for an input feature vector xϵRN. Consider an input-output training pair { (x1, y1), …, (in, yn) }, where vectors x1, x2, …, xn are input vectors and y1, y2, …, yn are the required output vectors. The issue is to identify a classifier f(x) which classifies the input samples.
These features were an input pattern and labeled as +1 for seizure presence and –1 for seizure absence. Collectively(x, y) forms an input-output pair, where x was the input feature and y was the output.
The fuzzy parameters utilized as a part of this work are necessary for a calculated relapse membership function. FMSVM implements a fuzzy membership capacity for every input data of SVM. SVM is receptive to exceptions and noises in the preparation of information that does not have a place with the three classes. Every data in the training dataset is doled out with membership and the total of the deviations weighted by its membership.
By allocating a low membership value to an outlier, the error in the training method could be decreased. The use of FMSVM is beneficial as it has less membership value and would be allocated to data points that differ from the classes. The error in training is decreased by achieving better generalization capacity. The membership rate for the membership capacities was appointed a value in the interval of [0, 1]. In the FMSVM classifier, the regularization parameter was set as C = 10, σ2 = 1 for kernel. The trial outcomes show the solidity of the present method.
FMSVMM figures out how to evaluate the objective capacity utilizing the extricated vector as input. For registering the hidden layer portrayal f(x|θ) of input vector x, these works make utilization of:
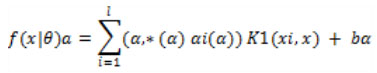 |
Which is iteratively used by each SVM to compute the element f(x|θ)a. The target values for hidden-layer features were between -1 and 1, therefore if some target output is larger than 1 for a feature, the target value should be set at 1. To allow the hidden-layer SVMs to extract different features, breaking symmetry was necessary. For this, this study randomly initializes the trainable parameters in each hidden-layer SVM. However, a better way to initialize the hidden-layer SVM is to let them train on different perturbed versions of the target outputs. Therefore, a dataset should be constructed (xi, yi + γ a i), with γ a i random value ϵ [−γ, γ] for the hidden-layer SVM Sa, where γ is another meta parameter.
FMSVM have an excellent potential to be connected in programmed identification of variations from the seizures by lessening the misclassification rate. In the analysis of research, obtaining an accurate presumed area in seizure is a vital issue. The relating execution indicates that FMSVM is higher in terms of accuracy, specificity, sensitivity, and misclassification rate. The outcomes acquired from testing exhibited which fuzzy-based SVM classifier produced the best execution, dominating regular SVM [16].
3.3. Autoregression Features
The autoregressive model was utilized to decrease the least square model and errors of prediction. This module is beneficial because it stays constant while processing the signal. The contribution to this module is in the structure of a column vector. Its parameters might be important as far as both various co-efficient and reflection coefficients are concerned. The AR module gives an elective method for examining the EEG spectral properties estimation [17-20]. Related on the discrete linear stochastic procedure, it is stated as,
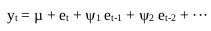 |
The errors are stated as, et = yt - µ - ψ1 et-1 - ψ2 et-2 - ··· .
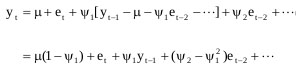
Assume the stationarity model which holds for et should hold true for et-1, then et-1 = yt-1 - µ - ψ1 et-2 - ψ2 et-3 - ··· .
Finally, substitute the model for et-1 into the model for yt
 |
(1) |
Where, y1, y2, ···, yn are the observations with a joint density Pr(y1, y2, ···, yn). et are the errors with respect to time.
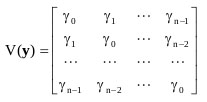
a) AR Covariance
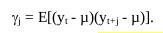
The parameter γj was called as the autocovariance at lag j, combining all results together, it would be
 |
(2) |
 |
(3) |
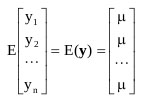
The covariance matrices, V(y) were symmetric. If E(yt) does not base on t then it must not be a stationary series, so we can normally anticipate detecting the series in the neighborhood of µ.
 |
(4) |
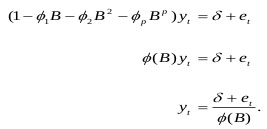
If γj > 0, we could anticipate when a higher than normal observation could be followed by another higher than normal observation. We could normalize the covariance by describing the autocorrelation,
 |
(5) |
As usual, ρ0 = 1. The structure of the autocorrelations would significantly support us in knowing the conduct of the series, y [17-20].
b) AR Yule-Walker
It calculates the AR parameters by shaping a biased measure of the signal's autocorrelation and comprehending the least square minimization of the forward prediction error. Here, the procedure linearly relies on the amplitude of a signal at the provided duration. The amplitude was acquired by adding various amplitudes of the past samples and error of estimation. The order for the filter linearly relies upon the count of AR coefficients. The modeling degree (p) consistently utilizes the Akaike Information Criteria (AIC) [17-20].
| Features | Subjects | |
|---|---|---|
|
Subject 10 (Mean Accuracy in %) |
Subject 7 (Mean Accuracy in %) |
|
| AR Burg | 92.34 | 90.25 |
| AR Yule-Walker | 90.67 | 89.42 |
| AR Covariance | 91.50 | 89.83 |
| AR Modified Covariance | 90.67 | 90.25 |
| Levinson Durbin Recursion | 91.50 | 89.00 |
| LPC | 90.67 | 89.00 |
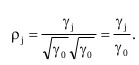
Generally, an AR model of order p could be written as
 |
(6) |
The autocorrelations and the ϕi were incidental to each other, known as the Yule-Walker Equations:
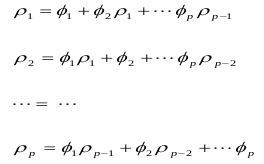 |
(7) |
Which could be utilized to measure  values.
The Yule-Walker AR model is estimated by reducing the value of the prediction error power [17-20].
c) AR Modified Covariance
The AR modified covariance was utilized to evaluate the PSD of an EEG input signal. The principal reason for this research is to reduce the forward and backward anticipation errors . At last, the evaluation order parameter should be not exactly, or equivalent to, 2:3 of the input vector length to settle the output. This procedure was completely characterized by a direct combination of past results and driving noise. It evaluates the P coefficients, where P is the model, by reducing the forward and backward prediction errors at all squares sense:
 |
(8) |
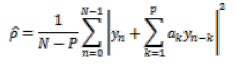 |
(9) |
Where for  the data length was N and
  was the AR coefficient of the kth term [17-20].
d) Levinson Durbin Recursion
It is a normal algorithm that is simple to solve; here, the model for k =1 and k +1 coefficients estimated issues. The initial step completed in LDR is to reduce the error. At that point, the input vector and error vector are figured. The k values from o to m are evaluated [17-20].
e) Linear Prediction Coefficient
In the linear prediction auto-correlation technique, the linear prediction coefficientsare calculated from the Bartlett-window-biased autocorrelation function [17-20].
4. RESULTS
The performance for finding the epilepsy disorder based on feature extraction and classification is carried out by collecting EEG data of patients as epileptic seizure data and normal data. The feature extractions are performed on Auto-Regressive model. Training and testing the information have been done by cross-validation extract of the information, and the extracted features were forwarded to the neural network for detecting the epilepsy data. The result of the classification is based upon the CFBNN and FMSVM classifiers.
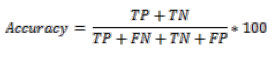 |
(10) |
 |
(11) |
 |
(12) |
Where TP represents True Positive, TN represents True Negative, FP represents False Positive and FN represents False Negative [21-25].
From the acquired dataset, the classification is initially done on subject-based and age-based patient’s data respectively. This classification is performed by using both CFBNN and FMSVM classifiers using six PSD feature extraction methods. The mean accuracy of selected data was computed and performed on proposed features as shown in the following tables.
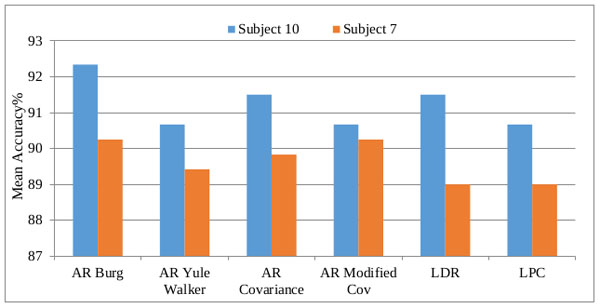
The subject-based classification accuracy of CFBNN is represented in Table 1 and the graphical representation is plotted based on the computation as shown in Fig (6). Based on the features, the computations are calculated and presented. CFBNN achieved a classification accuracy of 92.34% as the best result on subject 10.
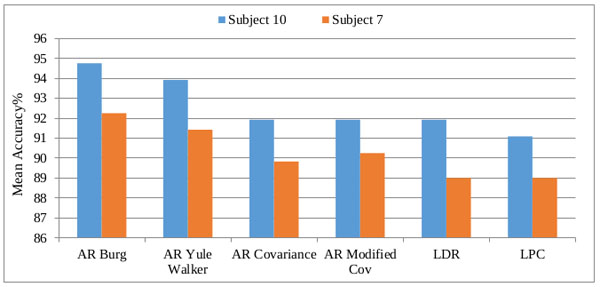
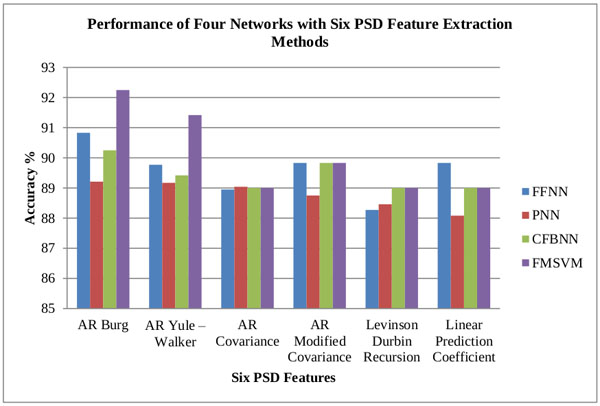
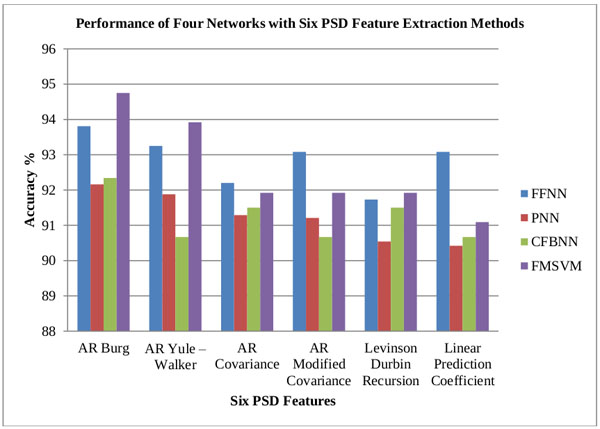
From the obtained classification results of both CFBNN and FMSVM classifiers, the minimum and maximum mean accuracy of the proposed classifiers are computerized, based on the six features as represented below in Tables 2, 3 and 4. The computed accuracy results are compared with previous results of the researches done using different classifiers like FFNN, and PNN Figs. (7, 8 and 9).
| Features | Subjects | |
|---|---|---|
|
Subject 10 (Mean Accuracy in %) |
Subject 7 (Mean Accuracy in %) |
|
| AR Burg | 94.75 | 92.25 |
| AR Yule-Walker | 93.92 | 91.42 |
| AR Cov | 91.92 | 89.83 |
| AR Mcov | 91.92 | 90.25 |
| LDR | 91.92 | 89.00 |
| LPC | 91.09 | 89.00 |
| S.No | Features | Minimum Mean Accuracy of Neural Network Classifiers (%) | |||
|---|---|---|---|---|---|
| FFNN | PNN | CFBNN | FMSVM | ||
| 1 | AR Burg | 90.83 | 89.21 | 90.25 | 92.25 |
| 2 | AR Yule – Walker | 89.77 | 89.17 | 89.42 | 91.42 |
| 3 | AR Covariance | 88.95 | 89.04 | 89.00 | 89.00 |
| 4 | AR Modified Covariance | 89.83 | 88.75 | 89.83 | 89.83 |
| 5 | Levinson Durbin Recursion | 88.27 | 88.46 | 89.00 | 89.00 |
| 6 | Linear Prediction Coefficient | 89.83 | 88.08 | 89.00 | 89.00 |
| S.No | Features | Maximum Mean Accuracy of Neural Network Classifiers (%) | |||
|---|---|---|---|---|---|
| FFNN | PNN | CFBNN | FMSVM | ||
| 1 | AR Burg | 93.81 | 92.16 | 92.34 | 94.75 |
| 2 | AR Yule – Walker | 93.25 | 91.88 | 90.67 | 93.92 |
| 3 | AR Covariance | 92.20 | 91.29 | 91.50 | 91.92 |
| 4 | AR Modified Covariance | 93.08 | 91.21 | 90.67 | 91.92 |
| 5 | Levinson Durbin Recursion | 91.73 | 90.54 | 91.50 | 91.92 |
| 6 | Linear Prediction Coefficient | 93.08 | 90.42 | 90.67 | 91.09 |
| Classifier | Sensitivity | Specificity | Accuracy |
|---|---|---|---|
| PNN | 90.10 | 91.25 | 92.16 |
| FFNN | 90.41 | 92.21 | 93.81 |
| CFBNN | 91.68 | 92.68 | 92.34 |
| FMSVM | 92.05 | 92.92 | 94.75 |
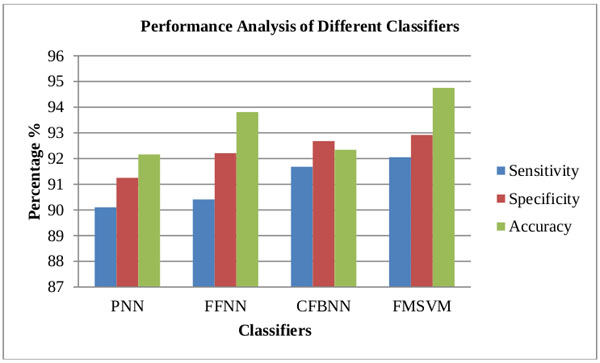
Based upon the above results it is clearly stated that FMSVM classifier has performed better and obtained better classification rates compared to the other proposed classifiers Table 5.
The comparison of the classifiers included the parametric estimations of sensitivity, specificity, and accuracy for each classifier in Fig. (10 and 11). The parameters are computed as per the equations 10, 11 and 12 . As seen from the computed estimations and graphical result, the FMSVM performed better than other classifiers in terms of sensitivity, specificity and accuracy.
CONCLUSION
In this research, CFBNN and FMSVM classifiers are proposed for classification and feature extraction of the EEG signal from the dataset, which was used to detect the epileptic seizures from the signal. The EEG dataset was collected from the database of Karunya University to conduct the proposed research. The Autoregressive methods for PSD such as AR Burg, AR Covariance, AR Yule-Walker, AR Modified Covariance, Linear Prediction Coefficient, and Levinson Durbin Recursion are used for feature extraction models. The results of the proposed classifiers were computed with minimum and maximum accuracy and these results were compared with the previous results of the classifiers like FFNN and PNN as shown in the above tables. The results validated that the FMSVM classifier performed better in the detection of epileptic seizure disorders.
LIST OF ABBREVIATIONS
| EEG | = Electroencephalography |
| AR | = Autoregressive |
| PSD | = Power Spectral Density |
| FFNN | = Feed Forward Neural Network |
| PNN | = Probabilistic Neural Network |
| LPC | = Linear Prediction Coefficient |
ETHICS APPROVAL AND CONSENT TO PARTICIPATE
Not applicable.
HUMAN AND ANIMAL RIGHTS
No animals/humans were used for studies that are the basis of this research.
CONSENT FOR PUBLICATION
Not applicable.
AVAILABILITY OF DATA AND MATERIALS
Not applicable.
FUNDING
None.
CONFLICT OF INTEREST
The authors declare no conflict of interest, financial or
otherwise.
ACKNOWLEDGEMENTS
Declared none.

