All published articles of this journal are available on ScienceDirect.

Imaging of Conductivity Changes of Excitable Tissues Based on Focused Passive Microwave
Abstract
Aims:
Modeling of ionic distribution fluctuations of excitable tissues based on data elicited using focused microwave radiometry.
Methodology:
Focused Microwave Radiometry implemented to carry out measurements of in depth body temperature distributions, may provide the capability of sensing local electrical conductivity fluctuations during the cycle of actions potentials in the case of brain excitable cell clusters. An analog beamformer consisting of a conductive inner-surface ellipsoidal cavity is used to focus the chaotic-black body radiation emerging from human tissues by providing convergence of the electromagnetic energy from one focus area where the phantom or subject is placed, to the other where the antennas of sensitive radiometric receivers are positioned. During the past 10 years numerous phantom, animal and human volunteer experiments have been performed with the focused radiometry imaging system. The results show that the detected changes of the output radiometric voltage are attributed to temperature and/or conductivity changes that occur locally concentrated at the areas of interest under measurement. Theoretical and experimental studies are continuously carried out at various frequency bands in conjunction with the use of matching materials placed around the human head or phantom to improve focusing and detection depth. It seems that the manipulation of the focusing area in the tissue in terms of detection depth and spatial resolution is feasible depending on the suitable combination of operation frequencies and matching material. In this paper, theoretical analysis of ion charge diffusion during the cycle of action potentials, propagating along the axons in case of measurements of specific cortical regions is presented. The ion charge diffusion modeling is based on electromagnetic diffusion analogies in the effort to explain the observed experimental results obtained under various psychophysiological conditions in the case of human volunteer measurements.
Results:
By implementing an analysis based on the continuity equations of ionic charges it is concluded that the microwave radiometry output voltage is not affected by the temporal and spatial average fluctuations of Na+, K+, and Cl- ions of neural cell axons.
Conclusion:
The analysis of conductivity fluctuations in the central neural system in conjunction with the electromagnetic analysis of the system, leads to the interpretation of the previously acquired experimental data. The application of this technique with other brain functional mapping methods, may provide complementary knowledge to the understanding of the functional organization of psychophysiological processes.
1. INTRODUCTION
Microwave radiometry, a well-known technology used for the observation of universe, was introduced over 30 years ago [1-3] as a diagnostic non-invasive and completely passive imaging method of temperature distributions inside the human body. The technique has been used over the years in a variety of applications including breast imaging [4-6], brain imaging and brain temperature monitoring [7-11], detection of vulnerable plaque [12], long term monitoring of brown fat metabolism [11], detection of vesicoureteral reflux [13], radiometric signatures of anomalies [14], core body temperature measurement [15, 16], in conjunction with microwave hyperthermia [17-19] as well as in multi-modal clinical setups [20]. Theoretical and experimental results obtained during the past decade imply that focused microwave radiometry is able to detect local concentrated gradual temperature and/ or conductivity changes reflected as an increase of the output radiometric voltage [7], [9, 10, 19]. In this paper, the mechanisms of the sources of the conductivity changes in question are investigated using electromagnetic modeling analogies.
2. MATERIAL AND METHODS
The
theoretical basis of this assumption lies on the analysis of the microwave
radiometric measurement of the human body performed in the past [7,
21] based on the fundamental “Dissipation-Fluctuation
Theorem” [22] and Green’s function theory [7]. The
statistical properties of the chaotic (black body) radiation are expressed in
terms of the 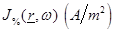 equations as:

 (1)
(1)
 (2)
(2)
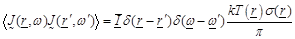
where  are the spatial position vectors,
 are the radiation angular
frequencies,
are the radiation angular
frequencies,  is the unit dyad,
 the Boltzman constant,
 the absolute temperature in Kelvin
 units,
 the
tissue conductivity at the radian frequency
the
tissue conductivity at the radian frequency
 and
and
 is the ensemble average. Eq. (2)
is valid in case the radiation photon energy
is the ensemble average. Eq. (2)
is valid in case the radiation photon energy
 is
less than
is
less than  (
( ,
,
 ,
,  is
the Planck constant). In case that
is
the Planck constant). In case that 
 the term
 should
be replaced by Planck’s function [22]:
should
be replaced by Planck’s function [22]:
 (3)
(3)
Based on eqs. (1) & (2) and the superposition principle as expressed by Green’s function theory, the power measured at the output of the radiometer is estimated to be [7, 21]:
 (4)
(4)
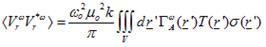
where  is the computed ensemble average,
k is Boltzman’s constant,
is the computed ensemble average,
k is Boltzman’s constant,  is the centre
frequency of the bandwidth of the observed microwave spectrum, μ0
is the free space magnetic permeability,
is the centre
frequency of the bandwidth of the observed microwave spectrum, μ0
is the free space magnetic permeability,
 is
the temperature spatial distribution within the medium of interest,
is
the temperature spatial distribution within the medium of interest,
 is the spatial distribution within
the medium of interest for the electric conductivity,
is the spatial distribution within
the medium of interest for the electric conductivity,
 is
the Kernel function related to the specific antenna and conductive wall
geometry.
is
the Kernel function related to the specific antenna and conductive wall
geometry.
Taking into
account that the radiometric measurements are performed over a finite bandwidth,
the measured receiving power  is related
to
is related
to
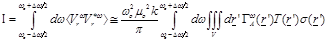
(5)
and defining
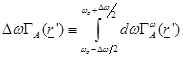 (6)
(6)
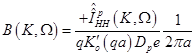
it is obtained [7]
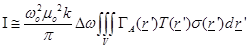 (7)
(7)
It is important to notice at
(eq.(5)) the fact that the measured receiving power quantity is proportional to
the product of temperature  , the
conductivity over a bandwidth ω and a field factor
, the
conductivity over a bandwidth ω and a field factor
 which is ultimately depended on
spatial coordinates. Hence, in case of thermodynamic equilibrium-which occurs
inside the human body under normal conditions -and if there is a slow temporal
fluctuation of tissue macroscopic conductivity where the field factor has a
high value the radiometer will detect the conductivity fluctuations.
which is ultimately depended on
spatial coordinates. Hence, in case of thermodynamic equilibrium-which occurs
inside the human body under normal conditions -and if there is a slow temporal
fluctuation of tissue macroscopic conductivity where the field factor has a
high value the radiometer will detect the conductivity fluctuations.
This argument has been verified by experimental measurements performed by a prototype Microwave Radiometry Imaging System (MiRaIS) [7, 9, 10, 19] during experiments involving human volunteers during various psychophysiological conditions [7]. Specifically, our research efforts over the past years aim at the development of a brain diagnostic tool based on focused microwave radiometry [7-10, 18, 19]. The main system modules are an ellipsoidal conductive wall dome that ensures contactless focusing on the brain regions of interest and sensitive radiometric receivers. The system’s focusing properties, detection depth and spatial resolution, depend on the operation frequency range and the geometrical spatial properties of the ellipsoidal beamformer. The prototype passive system is considered to provide temperature and/or conductivity variation measurements operating in a completely non-invasive contactless manner. During its development phase, it has been foreseen to extend the system with the addition of a module for therapeutic hyperthermia in parallel with radiometry monitoring both using the focusing properties of the ellipsoidal cavity.
The device was initially used as an in depth brain thermograph in experiments related to the biological effects of mobile telephony. Further and thorough research during human and phantom experiments though revealed that the system may be capable of sensing brain activation possibly associated with tissue temperature and/or conductivity variations. Specifically, analysis of the measured radiometric data from 16 healthy subjects during the cold pressor test (CPT), a standard experimental condition inducing pain, suggest that the focused microwave radiometry imaging methodology may be able to pick up activation of the somatosensory cortex during the pain conditions as compared with the nonpainful control conditions, possibly attributed to local changes of conductivity and/or temperature [7, 23]. The modeling approach presented in this paper is an effort to contribute to the understanding of the underlying mechanisms mediated in these results. With this view the physiological basis of conductivity fluctuations in the central neural system (CNS) is modeled using electromagnetic diffusion theory analogies.
3. MODELING OF CONDUCTIVITY FLUCTUATIONS IN EXCITABLE CELLS
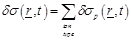
The changes measured by the output of the radiometric receivers may be attributed [7] to:
1) local increase of blood metabolism; 2) synaptic activity of the excited brain area of interest (local increase of ionic concentration); 3) ionic charge fluctuations occurring at the propagation of action potentials along the neuron axons as described by the Hodgkin–Huxley theory [24, 25].
In order to investigate the potential causality of the above mentioned approaches with the measured results, a detailed quantitative modeling of charge and mass transfer phenomena at neural cells is carried out.
3.1. Ionic Charge Fluctuations Related to Action Potentials
The propagation of action potentials in neurons was analyzed by Hodgkin and Huxley in the early 1950’s in their celebrated research work based on the experimental work using a squid’s giant axon and the implementation of a phenomenological non-linear differential equation theory to explain the propagation of electrical pulses in neural cells. During the last 50 years, many details of neural physiological activity have been analyzed and several mathematical models providing in depth understanding of associated phenomena of information processing by neural cells have been uncovered. In general terms Neurons differ from other cells in that they are excitable unlike the normal cells. Tissues other that CNS have also excitability such as muscles, heart muscles etc. When a nerve cell membrane such as the giant axon of the squid, is depolarized because of a synapse chemical excitation from its resting value (-70mV) to -10~-15mV, a rapid self-limited process occurs by which the transmembrane potential is reduced and overshoots zero, so that the medium inside the membrane becomes positive relative to the outside (extracellular) medium. This pulse shape signal is called action potential. The rise and fall of the action pulse is associated to the flux of ions of sodium (Na+) and potassium (K+), as well as chloride (Cl-) and some less important ions. The pulse duration is of the order of 1-5ms. During resting conditions, the concentration of Na+ ions in the extracellular medium is approximately 10 times larger than inside of the cell. The opposite ratio is approximately valid for the K+ ions. When the membrane is depolarized at the rise of pulse in the beginning there is a strong influx of Na+ into intracellular medium while immediately after an outflux of K+ ions take place towards the extracellular medium. The opposite sequence of ion flux phenomena occur at the reestablishment of the rest potential of the neural cell membrane. In Fig. (1), the phenomena taken place during the depolarization cycle of the neural cell membrane is shown by using a simplified illustration of neurons.
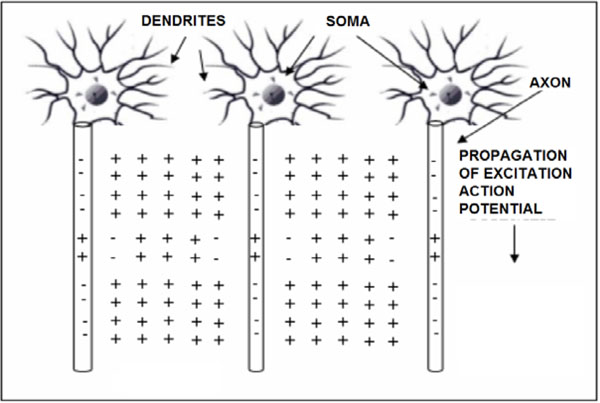
Simplified illustration of activated neurons spatial change distributions in case of positive (+) ions and extracellular medium having majority of the same ions (i.e. Na+), during the time cycle of action potentials.
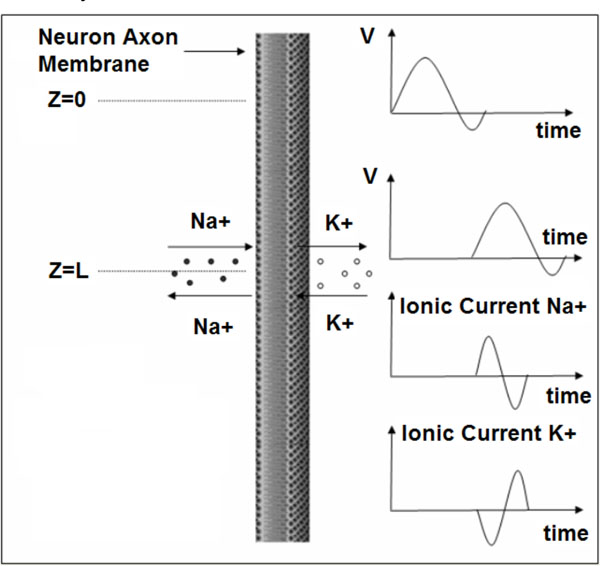
Depolarization cycle of a neural cell membrane. V symbolizes the membrane voltage.
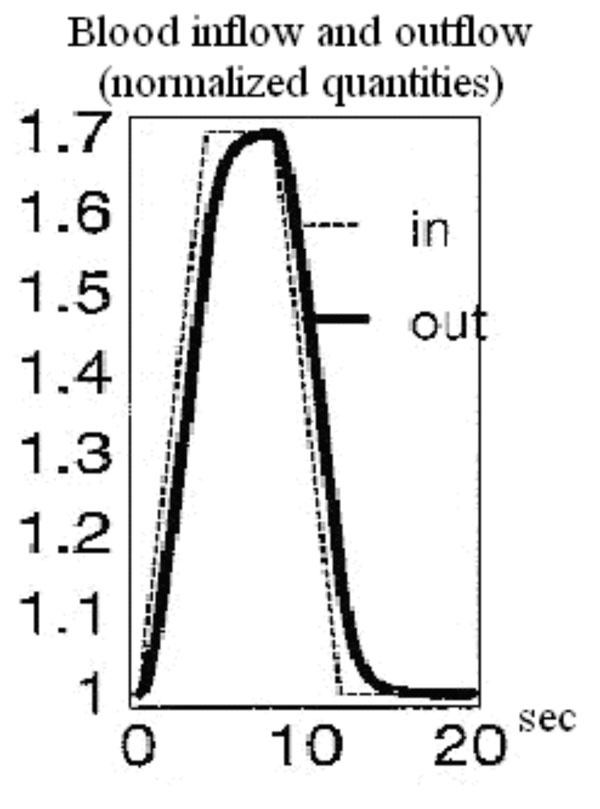
Balloon model curves for the time course of blood inflow and outflow [31].
What is important for the topic examined presently is the estimation of the average cycle of action potential which is an extremely slow phenomenon compared to the microwave signal periods. Therefore in terms of the radiometric measurement a quasi-static variation could be assumed concerning the conductivity fluctuation.
In order to estimate the variation of conductivity in the extracellular and intracellular media the diffusion equations associated with each ion population should taken into account. Based on the theory of continuity equation of changes in (semi) conductor media in the presence of an external applied field, for each ion type the following equations should be satisfied [26]:
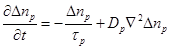 (8)
(8)
where  is
the excess ionic concentration at an arbitrary point
is
the excess ionic concentration at an arbitrary point
 and
at a moment
and
at a moment  and
and
 is
the lifetime of excess charges. The diffusion current
is
the lifetime of excess charges. The diffusion current
 is
expressed as:
is
expressed as:
 (9)
(9)
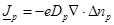
where  is the diffusion coefficient and
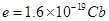 is the elementary charge. The
subindex
is the elementary charge. The
subindex  represents the ion type such as
 . Notice that the parameters, in
eqs.(8), (9), depend on the ions charges.
. Notice that the parameters, in
eqs.(8), (9), depend on the ions charges.
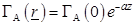
In order
to proceed further, a simplified model shown in Fig. (2) of an infinite
length cylindrical shape circular cross section neural cell axon is assumed.
Then eq. (8) should be satisfied independently outside
 and inside
 the axon. In order
to simplify the analysis, the parameters
the axon. In order
to simplify the analysis, the parameters
 and
are assumed to be the same in the
two media. Additionally, on the axon surface
and
are assumed to be the same in the
two media. Additionally, on the axon surface
 the boundary
condition concerning the current density should be imposed by taking into account the
corresponding ionic current density crossing the neural cell membrane which is
determined by the Hodgkin-Huxley theory [24, 25]. According to the above
analysis it is required to solve eq. 8 for
the boundary
condition concerning the current density should be imposed by taking into account the
corresponding ionic current density crossing the neural cell membrane which is
determined by the Hodgkin-Huxley theory [24, 25]. According to the above
analysis it is required to solve eq. 8 for
 and
and
 respectively while
also to satisfy the boundary condition
respectively while
also to satisfy the boundary condition
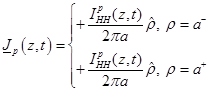 (10)
(10)
where  is the unit normal
vector on the surface of the axon cylinder at
is the unit normal
vector on the surface of the axon cylinder at
 ,
,
 is the ionic current
crossing the membrane at the vertical position
is the ionic current
crossing the membrane at the vertical position and time instant
 . Notice that because
of the assumed symmetric axon model azimuthial symmetry is assumed. The +, -
signs of eq. (10) refer to the opposite influx of ions. In order to solve eq.
(8) for and
while
satisfying the boundary condition of eq. (10) a Fourier transformation method
is applied with respect to the and
variable
as follows.
. Notice that because
of the assumed symmetric axon model azimuthial symmetry is assumed. The +, -
signs of eq. (10) refer to the opposite influx of ions. In order to solve eq.
(8) for and
while
satisfying the boundary condition of eq. (10) a Fourier transformation method
is applied with respect to the and
variable
as follows.
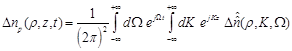
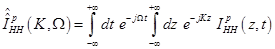
Defining the two dimensional Fourier transform as
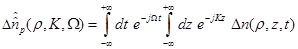 (11)
(11)
where  are the spectral
domain variables. The inverse Fourier transform is known to be,
are the spectral
domain variables. The inverse Fourier transform is known to be,
 (12)
(12)
By substituting eq. (13) in eq. (8) we obtain:
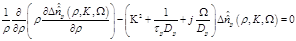 (13)
(13)
By
solving eq. (13) for the two regions satisfying the boundary value conditions
at  and at
 the following
solutions are obtained:
the following
solutions are obtained:
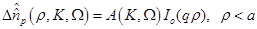 (14)
(14)
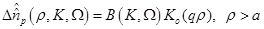 (15)
(15)
where ,
,
 are the unknown to
be determined coefficients,
are the unknown to
be determined coefficients,  and
and
 are the zero order modified Bessel and Hankel functions respectively.
Also,
are the zero order modified Bessel and Hankel functions respectively.
Also,  appearing in eqs. (14) and (15), is expressed
as:
appearing in eqs. (14) and (15), is expressed
as:
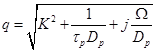 (16)
(16)
By
rewriting eq. (8) in terms of the excess ionic density and also transforming it
with respect to and
variables,
it is found that
 (17)
(17)
where
 (18)
(18)
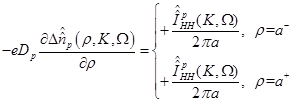
Substitution of eqs. (14), (15) in (17) results in:
 (19)
(19)
 (20)
(20)
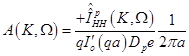
Then the excess change density,
provided that the  function
is known from the Hodgkin-Huxley theory, is found to be:
function
is known from the Hodgkin-Huxley theory, is found to be:
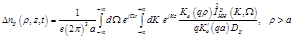 (21)
(21)
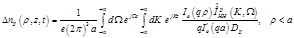 (22)
(22)
After
having determined the excess ionic charge density (concentration) let’s turn
attention to the corresponding conductivity fluctuation
 of tissue medium
enclosing the neural axon. Based on the fundamental equation
of tissue medium
enclosing the neural axon. Based on the fundamental equation
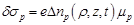 (23)
(23)
where  is the ionic change
mobility related to diffusion coefficient according to the Einstein [6] relation:
is the ionic change
mobility related to diffusion coefficient according to the Einstein [6] relation:
 (24)
(24)
Then the spatio-temporal global conductivity inside and outside of the axon based on (21)-(23) is defined to be:
 (25)
(25)
In order
to calculate (7), a cluster of N neurons is considered and function
 is approximated by
the exponential law of plane wave penetration along the z-axis:
is approximated by
the exponential law of plane wave penetration along the z-axis:
 (26)
(26)
where α is an attenuation constant. The excited tissue is considered of finite length along the z-axis of the neuron. Thus, regardless of the rest of the neurons, each neuron is symmetrical and conductivity changes occur only close to the surface of its axon.
After taking all of the above into consideration it is concluded that:
 (27)
(27)
The above equation results in zero value, leading to the conclusion that the radiometric measurements due to conductivity changes aren’t attributed to axon action potentials but either to synaptic activity or changes in local blood flow and volume.
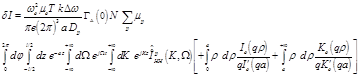
Thus, based on the fact that the temporal and spatial average fluctuations of Na+, K+, and Cl- ions of neural cell axons are zero, it is concluded that they don’t provide any effect on the microwave radiometry output voltage, as also in the case of event related potential experiments, where the direct result of specific stimuli triggered events are brain responses recorded in electroencephalography data.
3.2. Local Increase of Blood Volume and Subsequent Conductivity Change
The
possibility of conductivity variations in activated brain regions can be
studied with the help of a well known hemodynamic model used to correlate the
measured bold signal at fMRI to the Cerebral Blood Volume (CBV) changes in the
brain. In specific, the variations of CBV are of special interest in the study
of conductivity variations since the mean blood conductivity has a greater
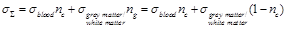
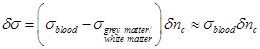
value than the mean tissue conductivity at microwave frequencies. Namely, the
ratio of the mean blood conductivity  to the mean
value of grey- and white matter conductivity
to the mean
value of grey- and white matter conductivity
 is
estimated around 1.6 at 3.5 GHz [27]. In particular, the mean blood
conductivity in the brain is estimated to 3.57 S/m at 3.5 GHz, the grey matter
conductivity is 2.64 S/m and the white matter conductivity is 1.81 S/m [27].
The value of
is
estimated around 1.6 at 3.5 GHz [27]. In particular, the mean blood
conductivity in the brain is estimated to 3.57 S/m at 3.5 GHz, the grey matter
conductivity is 2.64 S/m and the white matter conductivity is 1.81 S/m [27].
The value of  is calculated as the
average of grey matter- and white matter conductivity, since these two
constitutes of the brain have a volume ratio of about 1:1 in a healthy middle
aged man [28]. The percentage of the cerebral vascular volumes and the
percentage of the grey matter/white matter volume in the brain are symbolized
as
is calculated as the
average of grey matter- and white matter conductivity, since these two
constitutes of the brain have a volume ratio of about 1:1 in a healthy middle
aged man [28]. The percentage of the cerebral vascular volumes and the
percentage of the grey matter/white matter volume in the brain are symbolized
as  and
and
 respectively.
The cerebral volume in man has a mean value of 1700 ml [28-30]. From this
quantity we only take into consideration 1400 ml covered by grey and white
matter and 150 ml covered by the blood volume, ignoring 150 ml covered by the
cerebrospinal fluid which does not concern the possible activated brain
regions.
respectively.
The cerebral volume in man has a mean value of 1700 ml [28-30]. From this
quantity we only take into consideration 1400 ml covered by grey and white
matter and 150 ml covered by the blood volume, ignoring 150 ml covered by the
cerebrospinal fluid which does not concern the possible activated brain
regions.
Based on the above, the estimated
total mean conductivity  in the brain
region of interest is expressed in the following way:
in the brain
region of interest is expressed in the following way:
 (28)
(28)
The total conductivity increase can therefore be estimated through equation (29):
 (29)
(29)
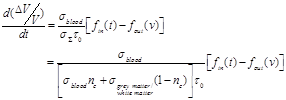
Consequently, the measured increase in the output signal of the radiometer can be correlated to the conductivity increase described above:
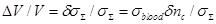 (30)
(30)
In
equation (30) the change in the cerebral vascular volume
 can be expressed through a well
known hemodynamic model as it was already mentioned above. In particular, the
model chosen for the correlation of cerebral conductivity variations to
hemodynamics is the Balloon model which expresses the relationship between the
bold signal, cerebral blood volume and the metabolic rate of oxygen in the activated
brain region [31].
can be expressed through a well
known hemodynamic model as it was already mentioned above. In particular, the
model chosen for the correlation of cerebral conductivity variations to
hemodynamics is the Balloon model which expresses the relationship between the
bold signal, cerebral blood volume and the metabolic rate of oxygen in the activated
brain region [31].
3.3. Using the Balloon Model for the Study of the Microwave Radiometric Signal
According to Buxton’s modeling approach [31] a simple expression for the bold signal measured in fMRI is the following:
 (31)
(31)
In
equation (31) the first term expresses the intrinsic extravascular signal, the
second term describes the intravascular signal, and the third term describes
the effect of changing the balance in the total measured bold signal.
 is the resting blood volume
fraction and the parameters
is the resting blood volume
fraction and the parameters  ,
,
 ,
,  and
are dimensionless and can be estimated through experimental procedures.
Evidently, bold signal variations depend on the quantities q and v
which stand for the normalized total deoxyhemoglobin content and the normalized
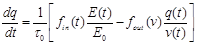
blood volume respectively. The time course of these quantities, which define
the bold signal, was modeled by Buxton et al. through equations (32) and
(33):
and
are dimensionless and can be estimated through experimental procedures.
Evidently, bold signal variations depend on the quantities q and v
which stand for the normalized total deoxyhemoglobin content and the normalized
blood volume respectively. The time course of these quantities, which define
the bold signal, was modeled by Buxton et al. through equations (32) and
(33):
 (32)
(32)
 (33)
(33)
where  is the mean transit time through
the venous compartment at rest,
is the mean transit time through
the venous compartment at rest,  is the resting
net extraction of
is the resting
net extraction of  by the capillary bed and
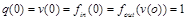 .
.
Since in
the Balloon model [31] v expresses the normalized value for the blood
volume percentage, expression (32) can be used for the study of the microwave
radiometric signal. In particular, the possibility of a relation between this
signal and the conductivity variations related to hemodynamic changes in the
activated brain is investigated. This possibility is directly dependent on the
cerebral blood volume variations in the activated brain region. Quantity
 expresses the time variation of
the cerebral vascular volume percentage. This quantity is assumed to indicate
the time variation of the cerebral blood volume percentage. This way it can be
substituted by the time variation of normalized v which consists an
equal expression. Consequently:
expresses the time variation of
the cerebral vascular volume percentage. This quantity is assumed to indicate
the time variation of the cerebral blood volume percentage. This way it can be
substituted by the time variation of normalized v which consists an
equal expression. Consequently:
 (34)
(34)
An exemplary arithmetic estimation for the time variation of the measured signal as the latter is expressed in equation (34) is attempted. For this purpose documented studies of cerebral blood inflow and outflow for the Balloon model are used. Specifically, two exemplary time curves for the normalized blood inflow and outflow in an activated brain region are used, as they were presented in Buxton’s et al. “Dynamics of Blood Flow and Oxygenation Changes During Brain Activation: The Balloon Model” [31]. The time course of these curves can be observed in Fig. (3). The blood inflow curve is assumed to have a trapezoidal shape with an initial sharp increase of about 4-6 sec. Outflow lags slightly behind inflow, but both curves show a similar pattern of evolution.
Based on the Balloon model curves for blood inflow and outflow during brain activation in Fig. (3) three exemplary moments and estimate three representative values of the signal variation pace are chosen. At 4 sec the normalized quantities of blood inflow and outflow take the values 1.69 and 1.6 respectively. The signal change pace is calculated at about 0.0679 with the help of equation (34). At 9 sec the normalized quantities of blood inflow and outflow take the values 1.59 and 1.65 respectively. The signal change pace is calculated at about 0.045 with the help of equation (34). Lastly, at 12 sec the normalized quantities of blood inflow and outflow take the values 1.02 and 1.15 respectively. The signal change pace is calculated at about -0.098 with the help of equation (34). For specified time intervals of blood inflow/outflow increase (e.g. 1-4 sec) or decrease (e.g. 10-12 sec) which last more than 1 sec, we notice an almost stable ratio between the two normalized quantities (blood inflow and outflow). Consequently, the three exemplary values estimated for the signal change pace (mostly the first for t=4 sec and the third for t=12 sec) indicate the possibility for significant signal variations.
The sign change from positive to negative noticed at the arithmetic calculations of equation (34) is justified through the ratio changes between blood inflow and outflow. In specific, during 0-6 sec the normalized quantity of blood inflow is larger than that of blood outflow. Therefore, equation (34) leads to a positive signal change pace. Likewise, during 6-15 sec the normalized quantity of blood outflow is larger than that of blood inflow. Therefore, equation (34) leads to a negative signal change pace.
Based on the hemodynamic study of this unit, it can be concluded that the measured radiometric signal [7, 9, 10] is related to the blood volume variation and consequently to the blood inflow and outflow in the activated brain region. In fact, it depends on the quantities defining Buxton’s Balloon model which was developed for the description of the hemodynamic background underlying the bold signal in functional Magnetic Resonance Imaging. These observations provide evidence for the existence of mutual parameters defining the signal changes measured both by the prototype Microwave Radiometric Imaging technique (MiRaIS) and fMRI.
At this point, another piece of evidence should be noted in support of the hemodynamic background of the measured radiometric signal: Namely, there is an apparent similarity between the duration of the evolution of the radiometric signal and the time interval covering the variation of blood inflow/outflow (Balloon model) during brain activation [7].
The results presented in this paper are in accordance with the underlying mechanisms mediating on one hand, event-related potentials EEG data, which are mainly attributed to synaptic activity [32] and on the other, localized hemodynamic response, as measured with fMRI. Taking into account neurovascular coupling which refers to the relationship between local neural activity and subsequent changes in cerebral blood flow, future research could focus on adding both aspects, neural and blood flow, in the modeling of the underlying mechanisms of the observed radiometric signal. It should also be taken into consideration that the proposed focused radiometry imaging methodology is able to provide real-time temperature and/or conductivity variation measurements and thus, the radiometric output is also directly influenced by temperature variation. In literature, it is shown that brain temperature fluctuations reflect neural activation [33]. It is known that relatively large increases in local brain temperature may occur in response to various stressful and emotional stimuli. Nevertheless, the source of this increase remains unclear. Based on the above mentioned it is important to incorporate also the temperature parameter in the modeling in order to fully comprehend the correlation of the factors resulting in the elicited radiometric data.
Conclusion
In the framework of the present research the analysis of conductivity fluctuations in the central neural system in conjunction with the system’s operational characteristics, leads to the interpretation of the previously acquired experimental data, showing that the radiometer output is not affected by action potentials of axons but it is rather attributed to changes in local blood flow and volume related to concentrated conductivity and/or temperature changes. The application of the proposed technique with other brain functional mapping methods may provide complementary knowledge to the understanding of the functional organization of psychophysiological processes.
CONFLICT OF INTEREST
The author confirms that this article content has no conflict of interest.
AcknowledgementS
The author would like to thank Ms. Anastasia Sylaidi for contributing to the explanation of the radiometric measurements with the use of the Balloon model.

